

Introduction
Both Japan and Australia are facing the economic and clinical burden of caring for a growing ageing population. It is predicted that in 2051, 26.1% of Australians and 38.8% of Japanese will be older than 65 years (Australian Bureau of Statistics, 2011; Ministry of Internal Affairs and Communications, 2014). Current estimates of the prevalence of depressive symptoms in community-dwelling elderly populations are thought to be between 8 and 16% (Blazer, Reference Blazer2003), but vary enormously, with ranges between 0.4 and 35% reported (Beekman et al. Reference Beekman, Copeland and Prince1999). Estimates of prevalence of depression in the elderly Australian population range from 1 to 49% (Haralambous et al. Reference Haralambous, Lin, Dow, Jones, Tinney and Bryant2009) with depressive symptoms in community dwelling adults thought to occur in 10–15% of the population (Cole & Dendukuri, Reference Cole and Dendukuri2003; Baldwin, Reference Baldwin, Jacoby, Oppenheimer, Dening and Thomas2008). In elderly community dwelling Japanese adults prevalence of depressive symptoms range from 0.4 to 35% (Wada et al. Reference Wada, Ishine, Sakagami, Okumiya, Fujisawa, Murakami, Otsuka, Yano, Kita and Matsubayashi2004), however several studies have demonstrated ranges between 25 and 40% in community dwelling older women (Wada et al. Reference Wada, Ishine, Sakagami, Kita, Okumiya, Mizuno, Rambo and Matsubayashi2005; Abe et al. Reference Abe, Fujise, Fukunaga, Nakagawa and Ikeda2012). Broad ranges of reported prevalence in this population suggest the need for more targeted research.
The need for early identification of older people at risk of depression is particularly relevant as elderly people have a higher risk of completed suicide than any other age group in Western and Asian countries (O'Connell et al. Reference O'Connell, Chin, Cunningham and Lawlor2004). As women have a longer life expectancy than men (World Health Organization, 2014) and are consistently reported to have higher occurrence of depressive illness in general (Kessler, Reference Kessler2003), assessment of the ageing female population is especially important.
The core symptoms associated with clinical depression have been demonstrated to be culturally consistent (Radford et al. Reference Radford, Nakane, Ohta, Mann and Kalucy1989), however differences in culturally specific risk factors associated with the development and maintenance of depressive symptoms are not as clear. Factors that have been associated with depression in the Japanese elderly include: moderate alcohol consumption, quality of relationships with neighbours, physical exercise, well balanced meals including milk products (Aihara et al. Reference Aihara, Minai, Aoyama and Shimanouchi2011), hearing loss, decreased appetite, lower financial leeway, low emotional support, decreased subjective usefulness (Okamoto & Harasawa, Reference Okamoto and Harasawa2011), poor perceived health, high BMI, smoking, sleeping more than 9 hours a day (Tanaka et al. Reference Tanaka, Sasazawa, Suzuki, Nakazawa and Koyama2011) and level of social support (Murata et al. Reference Murata, Kondo, Hirai, Ichida and Ojima2008).
In Western studies risk factors for the onset of depression in late life include; chronic illness, pain, institutionalisation, previous history of depression, bereavement, not having a spouse, living alone, having a disability, insufficient social support, developing a new health condition, perceiving ones health as poor and having limited ability to perform physical activities (Haralambous et al. Reference Haralambous, Lin, Dow, Jones, Tinney and Bryant2009). While it is predicted that certain risk factors will be universal it is also anticipated that there will be certain culturally specific risk and protective factors that impact the development of depressive symptoms. Identification of such influences may guide the implementation of early intervention strategies for both populations.
In any assessment of cross-cultural prevalence, the impact of semantics and culturally unique response patterns in item selection must be taken into consideration. Japanese populations have shown a trend to express depression using more semantic symptoms (Arnault et al. Reference Arnault, Sakamoto and Moriwaki2006), and to limit the expression of positive affect compared with their Western counterparts (Iwata et al. Reference Iwata, Roberts and Kawakami1995). In a study comparing Beck Depressive Inventory scores in Japanese and American college students, 31% of the variance in the Japanese student scores could be explained by somatic distress, compared with 1% for the American students (Arnault et al. Reference Arnault, Sakamoto and Moriwaki2006). Japanese populations have been shown to understate their personal virtues (Iwata et al. Reference Iwata, Saito and Roberts1994), and to be more prone to self-criticism than those from Western cultures (Kitayama et al. Reference Kitayama, Markus, Matsumoto and Norasakkunkit1997), which in turn may inflate endorsement on certain items, such as feeling like a ‘failure’ or not feeling ‘good enough’ (Iwata & Buka, Reference Iwata and Buka2002). The Geriatric Depression Scale (GDS), and its short form, excludes somatic items which are endorsed more often by older adults due to comorbid physical health problems (Colasanti et al. Reference Colasanti, Marianetti, Micacchi, Amabile and Mina2010). This would also reduce the potential inflation resulting from the Japanese tendency to endorse more somatic items (Arnault et al. Reference Arnault, Sakamoto and Moriwaki2006).
Aims of the study
The aim of this study was to compare depression scores for elderly, community dwelling women in Australian and Japanese samples, using the GDS. A further goal was to identify the impact of comparable lifestyle and health variables thought to be associated with higher ratings of depressive symptoms. The GDS was chosen to; (1) reduce the impact of physical symptoms associated with old age and, (2) reduce the inflation in scores that may be a result of the Japanese tendency to endorse somatic items more often than Western adults.
Materials and methods
Participants
The data used in this study was gathered as a part of collaboration between Australian and Japanese researchers examining depressive symptoms in older populations. The Australian cohort had data available for 222 participants aged between 65 and 75 who had undergone an assessment of depressive symptoms using the GDS short form. The Japanese collaborators provided data for 222 age matched women who had completed the Japanese translation of the GDS short form. The age ranges for both cohorts was 65–75 years with mean age 70 years. Data for both groups were drawn from larger studies of ageing with distinct protocols. All comparable data were utilised. Response categories to items of a similar nature were grouped as closely as possible, but in some circumstances this resulted in general response categories rather than specific categories outlined in the original protocol from the larger studies. The Japanese data were drawn from a cross-sectional sample while the Australian data were drawn from the 2012 time point of an ongoing longitudinal study.
Australian sample
Data for 222, randomly selected Australian women, aged 65–75 years were obtained from the Women's Healthy Ageing Project, a longitudinal epidemiological study examining women's healthy ageing. A more detailed summary of the cohort and procedure has been described elsewhere (Szoeke et al. Reference Szoeke, Robertson, Rowe, Yates, Campbell, Masters, Ames, Dennerstein and Desmond2013). Data from the 20th year of follow-up, examining 65–75 year old participants, were used. Only measures consistent with those used by the Japanese cohort were included in this analysis and as such only these variables are described.
Japanese sample
The Japanese cohort included 222, randomly selected women, aged 65–75 years drawn from a larger study, conducted by researchers at Kumamoto University, examining differences in prevalence and risk factors of depression in older populations living in urban and rural Japanese areas (Abe et al. Reference Abe, Fujise, Fukunaga, Nakagawa and Ikeda2012). A multi-stage, random sampling procedure was used to recruit elderly residents, aged 65 years and over, from Kumamoto City and Aso, a rural area, both in Kumamoto Prefecture in Southern Japan. For each area 2500 participants were recruited. In this investigation, female participants aged between 65 and 75 years were selected via random computer sampling from the Kumamoto City group. Women from Kumamoto city were selected as it represented an urban sample consistent with Melbourne. The subsample of the larger study used in this study is referred to as the ‘Kumamoto cohort’.
Methods
GDS – short form
The shortened version of the GDS was used to assess depressive symptoms in both samples (Yesavage et al. Reference Yesavage, Brink, Rose, Lum, Huang, Adey and Leirer1983). The English version was used for the Australian sample and the Japanese translation, validated by Muraoka et al. (Reference Muraoka, Ikuchi and Ihara1996), was used with the Kumamoto participants. The GDS is a screening inventory designed to assess for the presence of depressive symptoms in older populations and is extensively used in epidemiological research of geriatric psychiatry. The GDS does not include any somatic items in order to negate the impact of comorbid physical illness or medication use which are known to inflate scores on depression measures in older adults (Colasanti et al. Reference Colasanti, Marianetti, Micacchi, Amabile and Mina2010). The short form of the GDS was developed to lessen response fatigue and includes 15 items, reduced from the 30 items used in the full version. The ‘yes’/‘no’ format of response is thought to be easier for older adults and for individuals with limited education (Olin et al. Reference Olin, Schneider, Eaton, Zemansky and Pollock1992). Scores of 0–4 are considered normal, 5–9 mildly depressed and scores above 10 moderately to severely depressed. Internal consistency = 0.94 and test-retest reliability = 0.85 in a normative sample are good, and the scale has been validated against Research Diagnostic Criteria (Yesavage et al. Reference Yesavage, Brink, Rose and Rush2000).
Socio-demographic variables
In addition to the GDS the following variables were comparable across both cohorts: age, employment status, living status, sleep, alcohol use and self-rated health. Response categories were created to encompass response options for both cohorts. The living status variable was broken into four categories: lives alone, lives with children, lives with partner or lives with partner and children. Sleep was categorised by self-report as either ‘good’ or ‘poor’. Alcohol use was grouped into ‘never drinks’ compared with ‘two or more standard drinks a week’. Self-reported medical history for the following diseases was also gathered: heart disease; stroke; diabetes and, hypertension. When a response could not be incorporated it was treated as a missing data point. All missing data points are identified in the analysis and results, and range from n = 1 to n = 33.
Data collection
The Australian sample participants completed the GDS 15 and other self-completed questionnaires related to health and lifestyle prior to a semi-structured interview. All the data were collected with the written informed consent of the participants and met ethical standards of the Human Research Ethics Committee of the University of Melbourne, and the National Health and Medical Research Council.
The Japanese data were collected via self-administered questionnaires which were mailed to participants and returned with a reply paid envelope. Written informed consent was provided by all participants and guidelines and procedures of the 2009 Clinical Study Guidelines of the Ethics Committee of Kumamoto University Hospital were followed.
Statistical methods
Descriptive univariate analysis was used to determine if there were any significant differences in the patient demographics between the two sample populations. Chi-squared tests were used to assess differences in categorical responses, with Fishers' exact test used when the frequency within any group were less than 5. Student's t-tests were used for normally distributed data types (e.g. age) with Mann–Whitney (rank-sum) tests used to assess non-parametric data such as overall GDS score. To confirm whether any patient demographics contributed to any differences in overall GDS scores between countries, multivariate negative binomial regression analysis was conducted, with all variables considered in the study retained in the multivariate analysis model. Statistical analysis was conducted using both SPSS software (SPSS Statistics for Windows, Version 22.0. Armonk, NY: IBM Corp) and STATA software (Stata Statistical Software: Release 13. College Station, TX: StataCorp LP). All statistical tests were two-sided, with p-values of less than 0.05 considered statistically significant.
Results
Sample characteristics
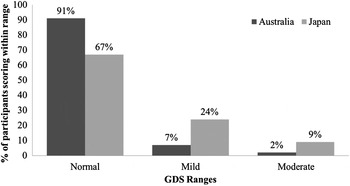
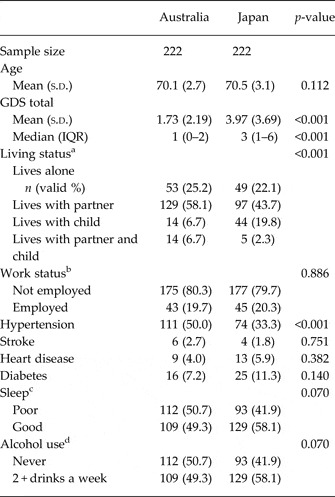
The characteristics of the endorsement on each of the lifestyle and health factors for each population, as well as the significance levels of difference between the cohorts, are outlined in Table 1. The mean age for the Australian cohort was 70.1 years and for the Japanese women 70.5 years (p = 0.112). Mean scores (standard deviations) on the GDS were 1.73 (2.7) and 3.97 (3.69) for the Australian and Japanese samples, respectively (p < 0.001). Due to the non-normality of the GDS scores, non-parametric tests were also conducted and confirmed that Australian GDS scores [median 1: interquartile range (IQR): 0–2] were significantly lower than the Japanese cohort [median = 3: IQR: 1–6] (p < 0.001). The distribution of GDS scores based on the clinical ranges are presented in Fig. 1. The figure illustrates the percentage of participants endorsing each category by cohort. In the Japanese cohort 33% of women reported mild or moderate symptoms of depression compared with 9% of Australian women.
Percentage of participants scoring within each Geriatric Depression Scale (GDS) category by country.

Characteristics of the Australian and Japanese cohorts and significant differences in variables

GDS, Geriatric Depression Scale; IQR, interquartile range; s.d., standard deviation.
n (valid per cent) unless otherwise indicated.
a n = 12 missing from Australia cohort and 27 missing from Japanese cohort.
b n = 4 missing from Australian cohort.
c n = 1 missing from Australian cohort.
d n = 30 missing from Australian cohort and 33 missing from Japanese cohort.
Living status was significantly different between cohorts (p < 0.001), with more than three times as many Japanese women living with their children (22.6% in Japanese sample compared with 6.7% in Australian sample) and more than twice as many Australian women living with their partner and child compared with Japanese women (6.7% compared with 2.6%). While both countries scored similarly in prevalence of reported medical health issues, Australian women did report significantly higher rates of hypertension (50.0% compared with 33.3%, p < 0.001).
GDS total score and risk factors
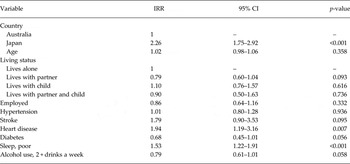
Lifestyle and health factors were examined to determine if they contributed to a higher GDS total score when data from both cohorts were pooled. The incidence rate ratio (IRR) for risk factors affecting higher GDS total score is presented in Table 2.
Incidence rate ratio for factors affecting higher GDS total score, n = 373
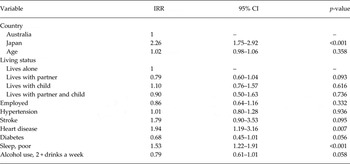
CI, confidence interval; GDS, Geriatric Depression Scale; IRR, incidence rate ratio.
When adjusting for all reported patient characteristics as part of multivariate negative binomial regression analysis, the Japanese sample continued to demonstrate a significantly higher GDS score with an IRR of 2.26 (95% CI: 1.75–2.92, p < 0.001). Other independent factors found to be associated with higher GDS scores when considering combined data for both cohorts, were the presence of heart disease (IRR = 1.94, 95% CI: 1.9–3.16, p = 0.007) and poor sleep (IRR = 1.53, 95% CI: 1.22–1.91, p < 0.001).
Culture specific risk factors
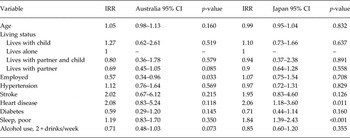
In order to examine the impact of different factors on each population, multivariate regression analysis was conducted for each cohort separately, as outlined in Table 3.
Incidence rate ratio for factors affecting higher GDS total score in the Australian and Japanese samples
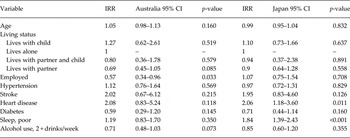
CI, confidence interval; GDS, Geriatric Depression Scale; IRR, incidence rate ratio.
Current employment was the only variable identified to be associated with significantly lower GDS scores for the Australian sample when data were considered independently for this population (IRR = 0.57, 95% CI: 0.34–0.96 p = 0.033). In the Japanese cohort heart disease (IRR = 2.06, 95% CI: 1.18–3.60, p = 0.011) and poor sleep (IRR = 1.84, 95% CI: 1.39–2.43, p < 0.001) were both found to be associated with higher GDS scores when only this population was considered. Of the lifestyle and physical factors assessed, none were consistently associated with higher scores for both the Australian and Japanese cohorts when they were considered independently.
Discussion
The findings of this study suggest that older Japanese women are more vulnerable to experiencing depressive symptoms than their Australian counterparts based on their GDS scores, with 33% of Japanese women reporting mild or moderate symptoms of depression compared with 9% of Australian women. Of particular concern is that 9% of Japanese women scored in the moderate range of symptoms, suggesting that many of these women may meet criteria for a clinical diagnosis of depression.
The analysis of the profile of lifestyle and health characteristics showed that the greatest difference was in the area of living status, with more Australian women living with their partner and more than three times as many Japanese women living with their children. While most of the health concerns that were assessed showed similar prevalence, hypertension was reported significantly more often in the Australian women.
The model utilised in this analysis demonstrated that two risk factors were associated with higher scores on the GDS when both countries were included in the model. These were; heart disease, and poor sleep. When the data for the countries were considered independently, employment status affected the likelihood of higher depression scores in the Australian sample while heart disease and poor sleep impacted the risk for the Japanese population. None of the lifestyle or health factors included in this analysis was a consistent risk factor for both countries when countries were assessed independently. The lack of overlap in lifestyle or health factors associated with increased odds of risk suggests that there may be culturally unique influences impacting higher scores.
When considering the literature examining differences between Western and Asian populations, the nature of an independent as opposed to interdependent culture is often the focus of examination (Karasawa et al. Reference Karasawa, Curhan, Markus, Kitayama, Love, Radler and Ryff2011). While Western cultures tend to promote self and encourage personal goals, interdependent countries such as Japan have a stronger focus on the social unit as a whole, with the requirements of the community being more important than personal needs (Kitayama et al. Reference Kitayama, Markus and Kurokawa2000). Japanese culture has a strong focus on filial piety, and a substantial proportion of elderly parents continue to be cared for by their children (Hashizume, Reference Hashizume2000). Far fewer Australian women live with their children, as supported by our own finding that 19.8% of Japanese women lived with their children compared with 6.7% of Australian women.
Similar numbers of Australian and Japanese women reported to be employed at the time of assessment, yet an association between employment status and depressive symptom scores was shown only for the Australian women, with women who were not working having higher GDS scores. The mean age of the Australian women was 70 years, at the time of assessment, 5 years older than the Australian pension age of 65 years (Atalay & Barrett, Reference Atalay and Barrett2015). Previous findings in the Women's Healthy Ageing Project (WHAP) cohort showed that work satisfaction was positively associated with increased mood (Dennerstein et al. Reference Dennerstein, Lehert, Dudley and Guthrie2001) and the findings from this study suggest that this pattern may continue into late life. Comparisons of work satisfaction levels were not available for this combined cohort analysis but would provide an interesting direction for future research.
While more Japanese women reported their sleep as good compared with Australian women, those with poor sleep patterns had higher ratings of depressive symptoms than their Australian counterparts. The findings related to sleep may be impacted by the fact that Japan has one of the shortest sleep durations in the world, with an average sleep duration of 470 min compared with 512 min for Australians (Kohyama, Reference Kohyama2011). Researchers have shown that poor sleep is associated with increased levels of depressive symptoms in Japanese participants (Honda et al. Reference Honda, Date, Abe, Aoyagi and Honda2014) and may also be a risk factor for suicide (Kohyama, Reference Kohyama2011). More detail about sleep patterns would need to be obtained before any conclusive association could be drawn between culturally distinct sleep patterns, or attitudes towards sleep, and depressive symptoms.
Similarly, while depression has been shown to be associated with increased risk of coronary heart disease (Rugulies, Reference Rugulies2002), this result is inconsistent and impacted by definitional issues and differences in sampling (Nicholson et al. Reference Nicholson, Kuper and Hemingway2006). The complexity of the association between coronary heart disease and depression needs to be better understood before the influence of culture on this relationship could be addressed.
The cohorts that were used for comparison in this assessment were matched as closely as possible. However, inherent in combining data from two large population studies some response options needed to be classified as missing data points, resulting in a reduction in sample size. Several important risk factors commonly associated with higher rates of depression, such as history of a diagnosis of major depressive disorder, could not be assessed. A clinical assessment of depressive disorder would have been useful in determining the consistency with which the cut offs for mild and moderate symptoms of depression were consistent with clinical diagnosis of Major Depressive Disorder. Neither study conducted clinical diagnostic interviews and as such this data was not available.
A limitation of the current analysis was the comparison of a cross-sectional population compared with that of a longitudinal cohort. The women who participated in the 20th year of follow-up had significantly higher mood ratings based on a self-report measure, the Affectometer 2, administered at baseline in 1991 when compared with participants who had dropped out. This may explain why the depressive symptom scores for this population were lower than the Japanese population. The prevalence of depressive symptoms in the Australian cohort is consistent with the 10–15% that has been reported elsewhere in the literature for older adults (Cole & Dendukuri, Reference Cole and Dendukuri2003). This is also true for the Japanese cohort, with the prevalence of 33% found in this study being consistent with the 25 and 40% prevalence reported in studies of community dwelling older Japanese women (Wada et al. Reference Wada, Ishine, Sakagami, Kita, Okumiya, Mizuno, Rambo and Matsubayashi2005; Abe et al. Reference Abe, Fujise, Fukunaga, Nakagawa and Ikeda2012).
This analysis demonstrated that there were overall higher scores on the GDS in the Japanese participants. Future work would benefit from establishing identical protocol to ensure that the variables are assessed using the same ranges and response categories. The GDS was used in this study in order to reduce the potential inflation of scores due to the Japanese tendency to rate somatic symptoms higher (Arnault et al. Reference Arnault, Sakamoto and Moriwaki2006). Specific cultural patterns in item endorsement on the GDS were not detailed in this study but it may be a useful direction for future research. Previous research has documented differences in the nature of item endorsement for Japanese compared with Western cultures, with Japanese participants understating their own virtues and being more prone to self-criticism (Iwata et al. Reference Iwata, Saito and Roberts1994; Kitayama et al. Reference Kitayama, Markus, Matsumoto and Norasakkunkit1997). Further research examining cultural influence on item endorsement may provide further insight into the nature of the influences resulting in higher scores for the Japanese women.
Over three times as many community dwelling older Japanese women reported mild or moderate symptoms of depression compared with their Australian peers. Of the lifestyle and health factors assessed in this analysis no single variable was a common risk factor for higher depressive scores for both countries. The presence of cultural influences that may impact the risk of experiencing depressive symptoms, or the endorsement of certain items on depressive symptom measures, needs to be explored in more detail. A more thorough investigation of which symptoms are most related to this discrepancy is warranted.
Acknowledgements
The authors would like to thank the Department of Psychiatry at the University of Melbourne for providing funding and support to the PhD Candidate. Authors would like to acknowledge the ongoing support of the National Health and Medical Research Council. Dr Fujise and Professor Ikeda received support for their project as part of an investigation for strengthening regional emergency against suicide, funded through the Cabinet office in Japan.
Financial Support
This research received no specific grant from any funding agency, commercial or not-for-profit sectors.
Conflict of Interest
Katherine Campbell, Prof Dennerstein, Prof Ikeda and Dr Fujise declare that they have no competing interests. Dr Szoeke has provided clinical consultancy and been on scientific advisory committees for the Australian CSIRO, Alzheimer's Australia, University of Melbourne and other relationships which are subject to confidentiality clauses. She has been a Chief Investigator on investigator driven research projects in partnership with Pfizer, Merck, Vifor Pharma, Sisu Wellness, Bayer and GE. Her research program has received support from NHMRC, Alzheimer's Association, Collier Trust, Scobie and Claire McKinnon Foundation, JO and JR Wicking Trust, Shepherd Foundation, Brain Foundation, Mason Foundation, Ramaciotti Foundation, Alzheimer's Australia and Royal Australian College of Physicians. She may accrue revenues from patent in pharmacogenomics prediction of seizure recurrence. Prof Ikeda received grants and personal fees from Daiichi Sankyo, Eisai, FUJIFILM RI, Janssen, Nihon Medi-Physics, Novartis, Pfizer, Takeda, and Tsumura, and personal fees from MSD and Ono Pharmaceutical, outside the submitted work. All grants were for his department, and he received them as the director of the department.
Ethical Standard
The authors assert that all procedures contributing to this work comply with the ethical standards of the relevant national and institutional committees on human experimentation and with the Helsinki Declaration of 1975, as revised in 2008.