1. Introduction
Since at least the mid-2000s, many advanced economies have experienced low productivity growth. This development is often related to the declining productivity gains at the technology frontier, which is commonly assumed to be determined by the US (IMF (2015)). We challenge this explanation and ask (i) whether US technology gains have sizable productivity spillovers across advanced economies and (ii) whether various institutional characteristics can explain the degree of productivity spillovers across countries.
These research questions are motivated by Keller’s (Reference Keller, Hall and Rosenberg2010) finding that for most countries, foreign technological innovations account for around 90% of domestic productivity growth. Moreover, new technologies originate from a small number of countries that determine the pattern of global technology transmission. Since the US economy represents the world technology frontier, we examine the spillovers of US technology gains on productivity in advanced economies. We focus on technology spillovers rather than on diffusion, since the latter is a process that spans over decades (Comin et al. (Reference Comin, Hobijn and Rovito2008), Comin and Hobijn (Reference Comin and Hobijn2010)), whereas spillover effects become apparent over shorter horizons. Further, we scrutinize the work of Cette et al. (Reference Cette, Fernald and Mojon2016) who highlight the role of labor and product market regulations in explaining the fallback of European economies relative to the US productivity level at varying rates.
The slowdown in US productivity growth in the recent decade has become the subject of extensive research. Fernald (Reference Fernald2015) finds two structural breaks the mean of US hourly productivity growth in the post-1973 period.Footnote 1 Further, while the average growth rate of Fernald’s (Reference Fernald2014) utilization-adjusted total factor productivity (TFP) (following Basu et al. (Reference Basu, Fernald and Kimball2006), we henceforth refer to this “purified” technology measure as PTFP) was 2.0% from 1995 to 2003, it dropped to 0.5% from 2004 to 2017. The literature explains this phenomenon by the lack of major innovations (Gordon (Reference Gordon2012) and Fernald (Reference Fernald2015)), decelerating technology diffusion (Decker et al. (Reference Decker, Haltiwanger, Jarmin and Miranda2014) and Andrews et al. (Reference Andrews, Criscuolo and Gal2015)), financial frictions (Anzoategui et al. (Reference Anzoategui, Comin, Gertler and Martinez2019)), and measurement problems (Byrne et al. (Reference Byrne, Fernald and Reinsdorf2016) and Syverson (Reference Syverson2017)). Our study contributes to the literature by addressing this issue from a cross-country perspective and by providing novel results on the elasticities that indicate the degree to which a slowdown in US productivity growth might account for productivity developments in advanced economies.
The literature focusing on cross-country differences in productivity levels is large. Acemoglu and Zilibotti (Reference Acemoglu and Zilibotti2001) argue that technology-skill mismatch can largely explain cross-country productivity differences even in the absence of any barriers to technology transfer. Hall and Jones (Reference Hall and Jones1999) find that gaps in productivity residuals across countries are driven by differences in institutions and government policies. Lagos (Reference Lagos2006) shows that labor market institutions can affect the level of TFP. Similarly, Dabla-Norris et al. (Reference Dabla-Norris, Guo, Haksar, Kim, Kochhar, Wiseman and Zdzienicka2015) and Cette et al. (Reference Cette, Fernald and Mojon2016) highlight the role of labor and product market regulations for technology spillovers across borders.
While technology transfer keeps countries from drifting apart, institutional barriers generally push the economies further from the frontier. Structural rigidities in product and labor markets can affect productivity via various channels. Missing competition could prevent creation of ideas and adoption of new technologies. Further, highly regulated product and labor markets impede the efficient allocation of resources in the economies. Following Svirydzenka (Reference Svirydzenka2016), the degree of a country’ s financial development operates through saving and investment channels affecting the accumulation of physical and human capital and thus TFP growth. Masuch et al. (Reference Masuch, Moshammer and Pierluigi2016) find that good-quality institutions promote productivity growth and improve economic performance. Therefore, we analyze the role of cross-country institutional characteristics in determining the size of international productivity spillovers.
We use country-specific structural vector autoregressive models (SVARs) to estimate the spillover effects of US technology shocks on productivity levels for 13 advanced economies. For the USA, we use Fernald’s (Reference Fernald2014) PTFP as our technology measure. Given the lack of comparable quarterly PTFPs for other countries, we estimate quarterly unadjusted TFPs. At annual frequency, our estimated TFPs match the corresponding TFPs provided in the Penn World Table (PWT). To isolate idiosyncratic US technology shocks, we use the medium-run identification approach introduced by Uhlig (Reference Uhlig2004a,b). This approach extracts the shock series explaining the largest share of fluctuations in Fernald’s (Reference Fernald2014) PTFP over the medium to the long horizon. At the same time, we control for technology changes in the rest of the world (RW). We also show that approaches relying on hourly labor productivity yield similar results. Finally, using indicators of non-price competitiveness, we analyze the relationship between the cross-country TFP spillovers and institutional characteristics.
Our key results are as follows. First, we do not find large TFP spillover effects of US technology shocks. For most countries, these effects are not significantly different from zero. The elasticity of foreign TFPs with respect to a 1% increase in the US technology level is significantly lower than 1 for many countries. This picture is robust across all model specifications and identification approaches.
Second, though the degree of US technology spillovers varies across countries, this variation is not significant. Also when we use indicators of non-price competitiveness to cluster countries into groups characterized by high and low degree of institutional rigidity and contrast the results, we are not able to find significant cross-country differences regarding the size of the US productivity spillovers. This result contradicts the finding in Cette et al. (Reference Cette, Fernald and Mojon2016) who emphasize the role of labor and product market regulations in shaping the transmission of new technologies across countries.
We stress the importance of our key findings as technology has the feature of non-rivalry (Keller (Reference Keller2004)). That is, in the absence of any barriers, technological innovations should translate into an equal technological improvement in other countries. However, our findings indicate an incomplete pass-through of the US technology shocks to other countries. Thus, the recent US productivity slowdown must have had a limited effect on developments in advanced economies.
Our results might be instructive for the literature studying the sources of international business cycle comovement (Backus et al. (Reference Backus, Kehoe and Kydland1992), Heathcote and Perri (Reference Heathcote and Perri2002), Kose et al. (Reference Kose, Otrok and Whiteman2003), and Ambler et al. (Reference Ambler, Cardia and Zimmermann2004)). In particular, our analysis considers the transmission of US technology gains to foreign TFPs, which might consequently trigger reactions of other macroeconomic aggregates. By contrast, other studies focus directly on the spillovers of US technology shocks on foreign macroeconomic variables without explicitly considering the TFP transmission channel. For example, Corsetti et al. (Reference Corsetti, Dedola and Leduc2008), Enders and Müller (Reference Enders and Müller2009), Keller (Reference Keller, Hall and Rosenberg2010), and Miyamoto and Nguyen (Reference Miyamoto and Nguyen2017) study the international transmission of US technology shocks on GDP, private consumption, trade balance, and international relative prices.
One exception is the work by Rabanal et al. (Reference Rabanal, Rubio-Ramrez and Tuesta2011) who study TFP spillovers between the US and the RW. In contrast to our analysis, the authors neither examine the international transmission of technology shocks country by country nor take a stand on which economy represents the technology frontier. Thus, while we examine the role of technology spillovers originating from the global technology frontier, Rabanal et al. (Reference Rabanal, Rubio-Ramrez and Tuesta2011) study the convergence of technology levels that can happen due to the transmission of innovations originating from both the USA and the rest of the word.
The literature on international business cycle comovement often encounters two issues that we try to address. First, a large number of studies rely on TFP as a measure of technology, which can be misleading. Specifically, a strong positive correlation between TFPs across countries might arise due to the international comovement of factor utilization, which reflects non-technological factors. Therefore, we rely on the utilization-adjusted TFP as our target technology series to study how exogenous changes in this measure propagate across countries.
Second, several studies consider contemporaneous correlations between technology measures across countries. For example, Imbs (Reference Imbs1999) and Huo et al. (Reference Huo, Levchenko and Pandalai-Nayar2020) show that their estimated PTFPs are uncorrelated across countries and conclude that international technological propagation does not generate much output comovement. Notably, while both studies focus on contemporaneous correlations, we employ a structural framework to estimate the dynamic propagation of US technology shocks across countries. Thus, our approach accounts for a delayed reaction of foreign technology to a US shock.
Similar to our study, Levchenko and Pandalai-Nayar (Reference Levchenko and Pandalai-Nayar2020) use a structural analysis and find that US technology shocks do not have a perceptible impact on Canadian technology. They conclude that technology spillovers, which are usually assumed to be the key driver of international real business cycles, cannot explain international business cycle comovement.
This paper is organized as follows: Section 2 provides evidence on the US as technology frontier. Section 3 describes our empirical approach and Section 4 presents our baseline results. In Section 5, we provide evidence from institutional characteristics. In Section 6, we test the sensitivity of our baseline results. Finally, Section 7 concludes the analysis.
2. The USA as technology frontier
The focus on cross-country productivity spillovers resulting from US technology gains is motivated by the fact that the US economy is largely considered as the global technology frontier (Growiec (Reference Growiec2012), IMF (2015), and Cette et al. (Reference Cette, Fernald and Mojon2016)). Inklaar and Diewert (Reference Inklaar and Diewert2016) corroborate this statement by providing estimates of internationally comparable TFP levels for several economies. The authors analyze dispersion in international TFP measures using industry-level data on real value added over the period 1995–2011. The main data source is the World Input-Output Database (Timmer et al. (Reference Timmer, Dietzenbacher, Los, Stehrer and De Vries2015)).
Table 1 reports the percentage deviations of the cross-country TFP measures from the US TFP level for the years 1995 and 2010. The tradable sector refers to the industries producing market-oriented goods, the non-tradable sector covers market-oriented service industries, and the aggregate of the latter two sectors is the market sector.
Productivity gaps as percentage deviations from the US TFP level

Notes: Productivity levels are determined by Inklaar and Diewert (Reference Inklaar and Diewert2016). Data for Norway are not available.
The negative productivity gaps suggest that the selected countries are less productive than the US economy. The productivity lead of the USA is particularly pronounced in the non-tradable sector, and it became even larger in 2010 with respect to many countries. For the market sector, the largest negative productivity gaps are reported for Japan, Italy, and South Korea, which amount to about 60% in 2010. For Germany, the UK, and Ireland, the respective productivity gaps are significantly smaller with roughly 20%.
In addition, Dabla-Norris et al. (Reference Dabla-Norris, Guo, Haksar, Kim, Kochhar, Wiseman and Zdzienicka2015) analyze sector-level patterns in TFP growth rates across developed countries and show that the US economy represents the technology frontier in finance, business, and personal services, whereas Germany represents the technology frontier in manufacturing. Using data for 185 countries, Comin et al. (Reference Comin, Hobijn and Rovito2008) demonstrate that the USA also leads the world in the intensity of use of a broad range of technologies. For example, they find that the usage degree of electricity, cars, trucks, and phones in a broad set of countries lags the corresponding usage degree in the USA by several decades.
3. Empirical framework
3.1. The data
Our baseline analysis relies on Fernald’s (Reference Fernald2014) quarterly utilization-adjusted TFP for the US business sector, which we label PTFP. Fernald’s (Reference Fernald2014) PTFP is closely related to the annual technology measure derived in Basu et al. (Reference Basu, Fernald and Kimball2006). Using disaggregate information at the industry level, Fernald (Reference Fernald2014) obtains PTFP from a growth-accounting exercise that controls for varying utilization of labor and capital. Thus, our SVAR identification does not require an explicit control for non-technological factors, which in our view is an advantage compared to other approaches, like the long-run identification approach proposed by Galí (Reference Galí1999).Footnote 2
Notably, Fernald’s (Reference Fernald2014) PTFP is prone to measurement errors (Kurmann and Sims (2020)). Particularly, the detrending (filtering) method in the estimation of factor utilization affects the PTFP estimate. However, identification approaches of US technology shocks in SVARs encounter similar and other issues. They are vulnerable to lower-frequency movements in the considered variables, are unreliable in small samples, depend on the proxy for factor utilization, and do not account for composition effects contained in the disaggregated data.
The lack of comparable quarterly PTFPs across countries challenges our analysis.Footnote 3 Therefore, we rely on quarterly unadjusted TFP estimates for the countries under consideration. To this end, we interpolate annual Solow residuals provided in the PWT (Feenstra et al. (Reference Feenstra, Inklaar and Timmer2015)) using our own estimates of “auxiliary” quarterly TFPs. An appealing feature of this approach is that when converted to annual frequency, our final TFP estimates match the respective PWT measures. The latter are, in turn, highly correlated with the TFP series provided by the EU KLEMS Growth and Productivity Accounts database, the annual macroeconomic (AMECO) database of the European Commission, and the OECD, respectively.
Specifically, we employ the following two-step procedure. First, we compute “auxiliary” quarterly TFP series assuming a Cobb–Douglas production function with constant returns to scale. The production elasticities for labor input are from the PWT. We use quarterly data for real GDP and investment from the OECD. Ohanian and Raffo (Reference Ohanian and Raffo2012) provide internationally consistent hours worked series. To obtain a quarterly capital stock series, we use the perpetual inventory approach (Appendix B gives the details). The annual averages of our “auxiliary” TFPs are highly correlated with TFPs from the PWT, as reported in Table 2.
Correlations of annual unadjusted TFP series from different sources

Notes: This table reports the correlations between the annual growth rates of our estimated TFP measures from the two steps as described in Section 3 and the corresponding TFPs from the Penn World Table (PWT), the EU KLEMS Growth and Productivity Accounts database, the annual macroeconomic (AMECO) database of the European Commission, and the OECD, respectively. The sample period varies due to data availability. N/A: values are not available.
Second, we use the “auxiliary” quarterly TFPs to convert annual PWT data into quarterly TFP series employing the Chow–Lin interpolation method (Chow and Lin (Reference Chow and Lin1971)). In addition, using the final TFP series for the 13 countries in the sample, we construct a weighted average TFP measure for the RW. The weights are obtained from the country-specific shares of world GDP based on purchasing power parities (PPPs), provided by the IMF.Footnote 4
3.2. VAR specification
We estimate for each individual country a three-variable VAR that includes PTFP, the RW TFP, and the TFP measure for the country under consideration. We include RW TFP to capture fluctuations in global technology outside the US. All models include a constant and four lags. We use seasonally adjusted quarterly data that cover 13 advanced economies over the sample period 1970:1–2016:4, unless otherwise indicated. Determined by the availability of quarterly total hours series in the Ohanian–Raffo dataset (Ohanian and Raffo (Reference Ohanian and Raffo2012)), which we use to compute TFP measures, we consider the following countries: Australia, Austria, Canada, Finland, France, Germany, Ireland (1970:1–2014:4), Italy, Japan, Norway, South Korea, Sweden (1974:1–2016:4), and the UK (1971:1–2016:4).Footnote 5
The VARs do not include country-specific TFPs in the estimation equations for PTFP and RW TFP. We estimate each model as a subset system of equations using the method of seemingly unrelated regressions, which guarantees that the sequence of US technology shocks is the same for each country.
All variables enter the model in first log-differences as cointegration tests for PTFP and RW TFP do not provide evidence that both series are cointegrated, which would warrant the estimation of the model in log-levels. Moreover, we find for almost all country-specific TFPs no cointegration relationships with PTFP. Exceptions are Canada and to a lesser extent Sweden. Table 3 summarizes the results of the cointegration tests. The Engle–Granger test statistics (columns 1–2) and the trace and maximum eigenvalue statistics for the Johansen test (columns 3–4).Footnote 6 The test results are not sensitive with respect to the number of lags.
Cointegration tests

Notes: This table reports the results of the cointegration tests. For the Engle–Granger test, we use the residuals from the regression of the country-specific TFP series on Fernald’s (Reference Fernald2014) PTFP (in log-levels). For the Johansen test, we specify a bivariate VAR with Fernald’s (Reference Fernald2014) PTFP and a country-specific TFP. The Johansen’ s trace and maximum eigenvalue tests include an intercept in the cointegration equation and the dynamic part of the system. For the dynamic part, we assume four lags. The null hypothesis of each test assumes no cointegration relationship between the variables under consideration. Sample period is 1970:1–2016:4, except for Ireland (1970:1–2014:4), Sweden (1974:1–2016:4), and the UK (1971:1–2016:4). ***
 $p<0.01$
, **
 $p<0.05$
, *
 $p<0.1$
.
3.3. Identification of US technology shocks
Changes in PTFP capture a domestic (idiosyncratic) and a global (common) component. Therefore, to isolate the idiosyncratic US technology shocks, we use the medium-run identification approach introduced by Uhlig (Reference Uhlig2004a,b), which extracts the shock series explaining the largest share of fluctuations in PTFP over the medium to the long horizon as follows.Footnote 7
The reduced-form moving average (MA) representation of
 $Y_t$
, a
 $k\times1$
vector of endogenous variables at time t, with PTFP ordered first is:
 \begin{equation} Y_t = C(L)u_t,\end{equation}
where
 $u_t$
is a vector of prediction errors with covariance matrix
 $\Sigma_u$
.Footnote 8 The vector of structural shocks
 $\varepsilon_t$
can be represented as a linear combination of prediction errors
 $u_t = A\varepsilon_t$
. To obtain
 $\varepsilon_t$
, the impact matrix A must satisfy
 $\Sigma_u = AA^{\prime}$
, which given the symmetry of
 $\Sigma_u$
is not unique. The Cholesky decomposition of
 $\Sigma_u$
gives such a matrix
 $\tilde{A}$
, which allows to summarize the entire space of acceptable impact matrices as
 $A =\tilde{A}Q$
, where Q is a
 $k \times k$
orthonormal matrix (
 $QQ^{\prime} =I$
). Thus, the structural MA representation of
 $Y_t$
takes the form:
 \begin{equation} Y_t = C(L)\tilde{A}Q\varepsilon_t.\end{equation}
The medium-run identification approach by Uhlig (Reference Uhlig2004b) isolates the structural shock that accounts for the largest forecast error variance (FEV) share of the target variable
 $y_{i,t}$
in
 $Y_t$
over the forecast horizon
 $h = \underline{h} \leq \overline{h}$
.Footnote 9 The h-step ahead forecast error of
 $y_{i,t}$
is:
 \begin{equation} y_{i,t+h} - E_{t}y_{i,t+h} = e_i^{\prime}\Bigg[\sum\limits_{l=0}^{h-1}C_l\tilde{A}Q\varepsilon_{t+h-l}\Bigg],\end{equation}
where
 $e_i$
is a column vector with 1 in the i-th position and 0’s elsewhere. The shock explaining most of the FEV of the i-th variable in
 $Y_t$
results from the maximization problem:Footnote 10
 \begin{equation} q_{1}^* = \arg\phantom{{\tiny x}}\underset{q_1}{\max}\phantom{{\tiny x}} e_i^{\prime}\Bigg[\sum\limits_{h=\underline{h}}^{\overline{h}}\sum\limits_{l=0}^{h-1}C_l\tilde{A}q_1q_1^{\prime}\tilde{A}^{\prime}C_l^{\prime}\Bigg]e_i, \quad \text{s.t.} \quad q_1^{\prime}q_1 = 1,\end{equation}
where
 $q_1$
is a vector of unit length that represents a column of Q. Uhlig (Reference Uhlig2004b) shows that the maximization problem in (4) can be expressed as
 $Sq_1 = \lambda q_1$
, where
 $S = \sum\limits_{h=\underline{h}}^{\overline{h}}\sum\limits_{l=0}^{h-1}(C_l\tilde{A})^{\prime}(e_ie_i^{\prime})(C_l\tilde{A})$
. To find the structural shock associated with the largest FEV of
 $y_{i,t}$
over
 $h = \underline{h} \leq \overline{h}$
, we need to find the eigenvector
 $q_1$
with the maximal eigenvalue
 $\lambda$
of the matrix S. Following Uhlig (Reference Uhlig2004b), we specify the forecast horizon between
 $\underline{h} = 12$
and
 $\overline{h} = 40$
quarters.
4. Results
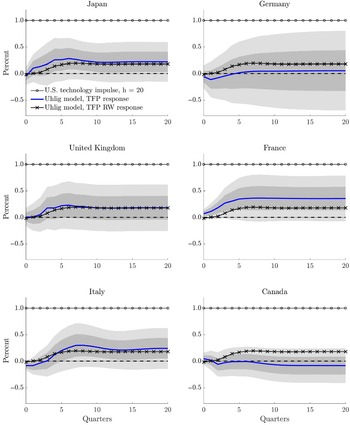
Figure 1 shows the baseline cumulated impulse response functions (IRFs) of country-specific TFPs following the US technology shock for the major six economies (Japan, Germany, the UK, France, Italy, and Canada) together with the cumulated IRF of the RW TFP. Since we focus on the long-run effects of the US technology shock on country-specific TFPs, we normalize the magnitude of the structural shock to induce a 1% increase in PTFP after 20 quarters.Footnote 11 The 95% confidence intervals for the country-specific IRFs are based on a recursive design wild bootstrap procedure proposed by Gonçalves and Kilian (Reference Gonçalves and Kilian2004).
Spillover effects of a US technology shock. Notes: Cumulated IRFs of country-specific TFPs to a US technology shock are obtained from the three-variable SVARs identified using the Uhlig’s (Reference Uhlig2004) approach with
 $\underline{h}=12$
and
 $\overline{h}=40$
on a country-by-country basis. All models are estimated as subset SVARs using data for the sample period 1970:1–2016:4. The IRF for the rest of the world (RW) is obtained using the TFP measure representing the weighted average of TFPs for the 13 countries in the sample. We standardize the US technology shock such that the structural shock induces a 1% increase in Fernald’s (Reference Fernald2014) PTFP after 20 quarters (
 $h=20$
). All models include four lags and all variables are in first log-differences. Shaded areas are the 68% and 95% confidence intervals for the country-specific IRFs based on a recursive design wild bootstrap procedure proposed by Gonçalves and Kilian (Reference Gonçalves and Kilian2004). Data sources and definitions are provided in the Data Appendix A.
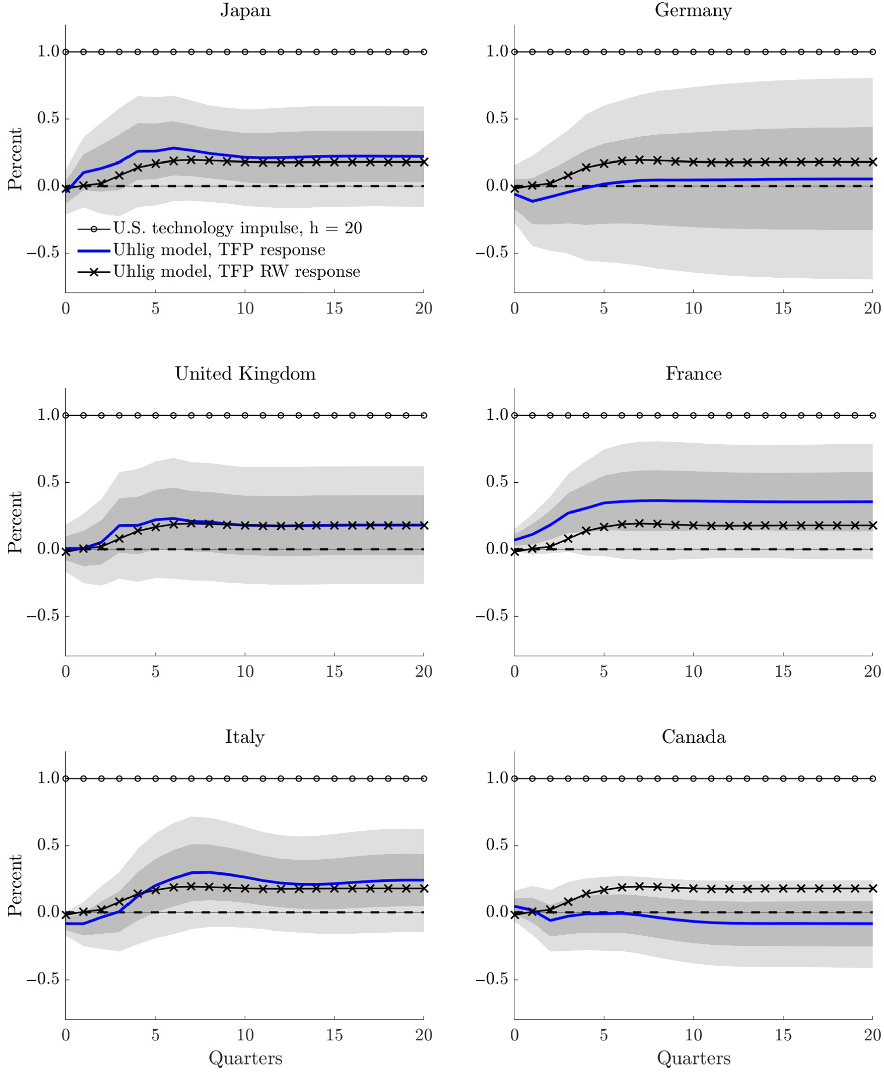
Our first main result is that the long-run spillover effects of the US technology shock are positive in almost all countries. We find the largest spillovers for France, Italy, and Japan, which exceed those for the RW. By contrast, we find no spillovers for Germany and Canada, which is in line with other studies. Miyamoto and Nguyen (Reference Miyamoto and Nguyen2017) and Levchenko and Pandalai-Nayar (Reference Levchenko and Pandalai-Nayar2020) also find no perceptible spillovers from the US technology shock on Canadian technology.
Second, the point estimates of the cumulated IRFs at a 1- and 5-year horizon for 13 countries and the RW in Figure 2 imply that the elasticity of foreign TFP with respect to a 1% increase in the US technology level is significantly lower than 1. That is a 1% increase in the US technology level increases foreign TFP by less than 1%. Nevertheless, the results suggest that the spillover effects build up over time, as the RW TFP increases by 0.14% after 1 year and by 0.18% after 5 years. The spillovers are larger for the RW output, which rises by 0.21% and 0.35%, respectively. Further, we find a positive but not perfect relationship between TFP and output gains across countries—the correlation between the respective IRFs is 0.76 after 1 year and 0.72 after 5 years.
Cross-country spillover effects of the US technology shock. Notes: This figure shows the cumulated IRFs of country-specific TFPs (bars) and output (markers) to the US technology shock at a 1- and 5-year horizon for 13 advanced economies and the aggregate for the rest of the world (RW). TFP and output measures enter the model as subset variables, one at a time, except for RW TFP. The error bars are the 95% confidence intervals for the country-specific IRFs based on a recursive design wild bootstrap procedure proposed by Gonçalves and Kilian (Reference Gonçalves and Kilian2004). Section 3 and notes to Figure 1 give further details.

Further, our results reveal that the magnitude of the spillover effects is heterogeneous across countries. In particular, the TFP point estimates at a 5-year horizon range between near-zero in Canada to 0.36% in France, and the corresponding output responses range between near-zero in Norway to 0.67% in Ireland (see Figure 2).
Since we find positive but quantitatively limited spillovers of US technology shocks, we conclude that the recent slowdown in the US technology growth had only a limited effect on the decline in technology growth in advanced economies. We stress the importance of our key findings, since technology (knowledge) has the feature of non-rivalry (Keller (Reference Keller2004)). In a setting with perfect competition and without structural rigidities, innovations in one country should increase the technology level in all other countries by the same magnitude after the same time.
Rabanal et al. (Reference Rabanal, Rubio-Ramrez and Tuesta2011) study the transmission of new technologies between the US and the rest of world in a cointegration framework. In contrast to our analysis, the authors do not conduct a country-by-country comparison and do not take a stand on which economy is the technology frontier. They find that the TFP processes are cointegrated, and that the cointegrating relationship is significant for both the US and the RW. This implies that convergence of technology levels can happen due to a transmission of the US technology shock to the RW, or vice versa, technological innovations outside the US can improve the US productivity. Thus, these TFP processes converge perfectly but slowly over time, implying a full international absorption of new technologies independent of their origin.
This finding is difficult to reconcile with our result that the long-run elasticity of foreign TFP with respect to a 1% increase in the US technology level is significantly lower than 1. Furthermore, we do not find a cointegration relationship between the US technology measure and RW TFP. The difference between our results and the findings in Rabanal et al. (Reference Rabanal, Rubio-Ramrez and Tuesta2011) might be due to the different time samples considered, the different composition of countries in the aggregate for the RW, and different technology measures used in the analysis.
To shed light on the possible sources behind limited spillovers of US technology shocks on foreign TFP, we trace their effects on international relative prices. In open economies, international prices play a key role as shock absorbers, see, for example, Corsetti et al. (Reference Corsetti, Dedola and Leduc2008) and (Reference Corsetti, Dedola and Leduc2014). Therefore, we analyze the reactions of country-specific terms of trade and real effective exchange rates following a US technology shock. However, we do not find that the limited technology spillovers are due to sizable adjustments in international relative prices. In almost all cases, the responses are insignificant (see Figure D.1 in Appendix D). Moreover, we do not find a significant correlation between the size of TFP spillovers and the size of the international price adjustments. On average, the point estimates of the terms trade indicate a persistent appreciation following the US technology shock.
5. Evidence from institutional characteristics
5.1. Indicators of institutional characteristics
While our baseline results do not reveal significant cross-country heterogeneity in the spillovers of US technology gains, the IRFs after 5 years vary to some degree, which warrants further analysis. Following Acemoglu (Reference Acemoglu2009), differences in institutional environments can explain the gaps in technology and income across countries. Thus, to analyze the role of institutions for our key results, we estimate the spillover effects of the US technology shock on TFPs for the groups of countries with contrasting institutional environments. We group the countries along various institutional dimensions using indicators of non-price competitiveness.
First, we scrutinize the statements in Cette et al. (Reference Cette, Fernald and Mojon2016) on the importance of labor and product market regulations for the transmission of US technology gains.Footnote 12 Following Gnocchi et al. (Reference Gnocchi, Lagerborg and Pappa2015), regulations that influence job and worker flows (employment rigidities) are key determinants of labor market adjustments.Footnote 13 Therefore, we use the OECD indicator of the strictness of employment protection legislation (EPL) against individual dismissal (based on regular contracts). Further, we use the OECD index of product market regulation for the total economy that measures the degree to which policies promote or inhibit competition in product markets (Koske et al. (Reference Koske, Wanner, Bitetti and Barbiero2015)).
Second, the literature shows that financial development and an overall high quality of institutions enhance productivity growth (Kose et al. (Reference Kose, Prasad and Terrones2009); Bekaert et al. (Reference Bekaert, Harvey and Lundblad2011)). Svirydzenka (Reference Svirydzenka2016) argues that the degree of a country’ s financial development influences saving and investment decisions, which affect the accumulation of physical and human capital and thus TFP growth. Masuch et al. (Reference Masuch, Moshammer and Pierluigi2016) find that good institutions promote the catching-up process in terms of economic performance.Footnote 14
The diversity of financial and institutional systems across countries requires a broad and multidimensional approach to computing an encompassing index. We use the IMF broad-based index of financial development (Svirydzenka (Reference Svirydzenka2016)) that summarizes important dimensions, like depth (size and liquidity of markets), access (ability of individuals and companies to access financial services), and efficiency (ability of institutions to provide financial services at low cost and with sustainable revenues, and the level of activity of capital markets). To capture the quality of institutions across countries, we use the Global Competitiveness Index (GCI) reflecting the overall efficiency of public and private sectors, that is legal and administrative framework within which individuals, firms, and governments interact.
Figure 3 shows the time series averages of the institutional characteristics for each country. Based on these cross-country averages, we compute the median for each indicator, excluding the US (dashed lines). Using each median value as a threshold, the countries with a score above (below) the respective median are clustered into “high” (“low”) regime groups, excluding the median country (dark bars) and the US (see Table E.1 in Appendix E). Thus, each regime-grouping includes an equal number of countries. Note that high (low) scores for the strictness of employment protection and product market regulation point to rigid (flexible) institutions. By contrast, high scores for the financial development and the quality of institutions point to a favorable institutional environment.
Cross-country institutional characteristics. Notes: The bars show for each country the time series averages of indicators and the highlighted bars correspond to the respective median country. The dashed lines show the cross-country median value of each indicator (excluding the US). The OECD indicator of the strictness of employment protection legislation refers to individual dismissals (regular contracts) and covers the period from 1985 to 2013. The OECD indicator of product market regulation reflects the degree to which policies promote or inhibit competition and is available for the years 1998, 2003, 2008, and 2013 (Koske et al. (Reference Koske, Wanner, Bitetti and Barbiero2015)). The IMF index of financial development summarizes factors like depth, access, and efficiency of financial markets (Svirydzenka (Reference Svirydzenka2016)) and is available from 1980 to 2016. The Global Competitiveness Index (GCI) of quality of institutions reflects the efficiency of public (with a weight of 75% in the index) and private (25%) sectors and is available from 2006 to 2016. Data Appendix A provides further details and definitions.

While labor and product markets in major European economies (Germany, France, and Italy) are highly regulated, the opposite applies to Anglo-American countries (Australia, the UK, and the USA) and Japan. Interestingly, the qualitative institutional differences between these groups of countries also hold for financial development, which is below average in European economies and high in Anglo-American countries and Japan. In Canada, loose labor market institutions stand in contrast to strict product market regulation. Regarding the quality of institutions, France, Italy, Japan, South Korea, and the USA display scores well below average. By contrast, the Scandinavian countries (Finland, Norway, and Sweden) have the highest quality of institutions.
5.2. The role of institutions
To analyze the differences in TFP spillovers across countries after the US technology shock, we adopt the approach by Calza et al. (Reference Calza, Monacelli and Stracca2013). We first estimate our baseline model country by country and then compute the average impulse responses of TFPs for “high” and “low” regime groupings as defined in the previous section. The computation of mean IRFs based on country-specific SVARs (mean group estimator) results in efficiency gains versus panel estimation methods, like pooled ordinary least squares or fixed effect VAR approaches. Estimating subset SVARs country by country does not only take into account country-specific fixed effects (intercepts) but also results in country-specific estimates of the slope parameters.Footnote 15
Figure 4 shows the mean IRFs and the 95% confidence intervals. We normalize the US technology shock to induce a 1% increase in PTFP after 20 quarters. We find that differences in TFP spillovers are negligible between the two regimes and along the four institutional dimensions. However, the difference between two regimes is more pronounced for the quality of institutions, with a surprisingly stronger TFP response in the “low” regime.
Mean impulse responses to a US technology shock. Notes: The average IRFs of TFPs to a US technology shock are computed over the groups of six countries, respectively. The IRFs were obtained from the estimation of the baseline model on a country-by-country basis (see Figures 1 and 2). The classification of countries into “high” and “low” regime groupings is done according to their respective institutional characteristics, which can be found in Table E.1. We standardize the US technology shock such that the structural shock induces a 1% increase in Fernald’s (Reference Fernald2014) PTFP after 20 quarters (
 $h=20$
). Shaded areas are the corresponding cross-sectional averages of the 68% and 95% confidence intervals computed using a recursive design wild bootstrap procedure proposed by Gonçalves and Kilian (Reference Gonçalves and Kilian2004). All details concerning the model estimation, specification, and data sources are provided in Section 3 and in the notes to Figure 1.

Following Gnocchi et al. (Reference Gnocchi, Lagerborg and Pappa2015), we further examine the link between TFP spillovers and institutional characteristics based on Spearman’s rank correlation coefficients.Footnote 16 Table 4 reports the correlations between the cumulated TFP responses at a 1- and 5-year horizon for 13 countries and indicators of institutional characteristics. The results broadly support our findings in Figure 4 and Section 4. Thus, labor, product, and financial market characteristics do not seem to be able to explain the cross-country differences in the size of the spillover effects. This evidence is at odds with the statements made by Cette et al. (Reference Cette, Fernald and Mojon2016).
Evidence from Spearman’s correlation coefficients

Notes: This table reports the Spearman’s rank correlation coefficients between the cumulated IRFs of TFPs at a 1- and 5-year horizon for 13 countries and indicators on institutional characteristics. ***
 $p<0.01$
, **
 $p<0.05$
, *
 $p<0.1$
.
While isolated institutional characteristics do not seem to affect the transmission of US technology shocks across countries, the results in the last column of Table 4 suggest that in the short run, the overall quality of institutions is negatively associated with the size of TFP spillovers. A possible explanation for this puzzling result is that countries with a lower quality of institutions provide a worse environment for innovation and instead rely more on imitation, at least in the short run (Benhabib et al. (Reference Benhabib, Perla and Tonetti2014)). However, this relationship is only short-lived and the correlation becomes insignificant after 5 years.
6. Robustness checks
In this section, we conduct various robustness checks that test the identification of US technology shocks and introduce modifications in the model specification.
6.1. Identification approach
We check the robustness of our baseline results with respect to alternative identification schemes that rely on US labor productivity by employing Uhlig’s (Reference Uhlig2004a) medium-run identification approach and a modified version of a Proxy-SVAR model proposed by Mertens and Ravn (Reference Mertens and Ravn2013, Reference Mertens and Ravn2014). Following Kurmann and Sims (2020), Fernald’s (Reference Fernald2014) PTFP is subject to measurement errors and changes due to methodological refinements.
While the medium-run and Proxy-VAR approaches rely on different identification assumptions, both models use US labor productivity as target technology measure to recover structural shocks. Notably, labor productivity is defined as the ratio of real GDP to total hours worked and is not corrected for cyclical variations in factor utilization. We address this issue by controlling for fluctuations in US total hours worked in the nonfarm business sector adjusted by the working-age population in the VAR specification. To control for global productivity developments, we compute a weighted average labor productivity measure for the the RW. Similar to RW TFP measure, the weights are obtained from the country-specific shares of world GDP based on PPPs, provided by the IMF.
Since RW labor productivity is also not corrected for variations in factor utilization, we include an aggregate measure of total hours worked adjusted by the working-age population for the RW. Both RW variables are based on data for 13 countries. Finally, we include country-specific labor productivity as subset variable one at a time. Thus, we exclude country-specific labor productivity from the equations for the US and RW variables and estimate the models as a subset system of equations. All variables are in first log-differences. The VAR models include a constant and four lags.
In contrast to our baseline model, this section employs both a different target technology measure for the US and a different instrument series to isolate variations in factor utilization. Figure 5 illustrates the time series used in our SVARs. Therefore, in addition to alternative identification schemes of US technology shocks, we also test the robustness of our baseline results with respect to an alternative specification of the empirical model.
Time series used in VARs. Notes: The figure shows the growth rates of the US time series used in SVAR models for the sample period 1970:1–2016:4. The shaded areas are NBER recession periods. Data sources: Fernald (Reference Fernald2014) and the Federal Reserve Economic Data (FRED).

While being mainly driven by technology shocks, labor productivity can also be shifted in the long run by changes in dividend taxation and/or social attitude toward workplace. Thus, we employ the medium-run identification approach by Uhlig (Reference Uhlig2004a), which maximizes the contribution of technology shocks to the FEV of labor productivity at intermediate horizons while letting other shocks play a role. Similar to our baseline model, we use
 $\underline{h} = 12$
and
 $\overline{h} = 40$
and obtain a shock series that is highly correlated with our baseline technology shocks (0.70).Footnote 17
Next, we estimate a Proxy-SVAR model that uses PTFP as instrument to isolate technology shocks from US labor productivity. The shock series is defined as unexpected changes in US labor productivity that have the highest correlation with the instrument series. The shock series from the Proxy-SVAR model is highly correlated with our baseline US technology shocks (0.74) and with the shock series from the model described above (0.97).
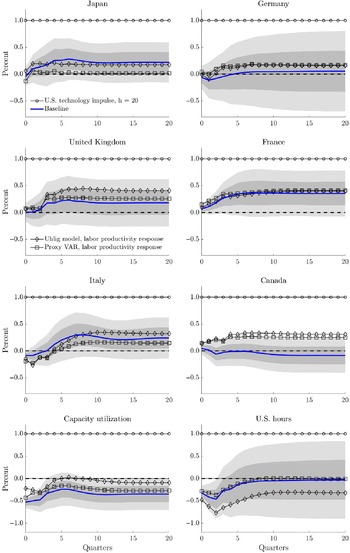
Figure 6 shows the cumulated IRFs of labor productivity for the major six economies and the IRFs of US capacity utilization (Fernald (Reference Fernald2014)) and hours to the US technology shock. Figure 7 summarizes the results for 13 countries and the RW at a 1- and 5-year horizon. The results in Figure 6 are very close to the baseline IRFs, with the exception of Canada, where the labor productivity effect of the US technology shock is higher than the baseline TFP response. The results in the upper row of Figure 7 are broadly in line with the baseline outcomes. The US capacity utilization and hours decline significantly following the US technology shock, which is in line with other studies (see, e.g., Basu et al. (Reference Basu, Fernald and Kimball2006)).
Impulse responses to a US technology shock from different models. Notes: Cumulated IRFs of country-specific labor productivity, the US capacity utilization, and hours following the US technology shock from five-variable SVARs identified using Uhlig’s (Reference Uhlig2004) approach with
 $\underline{h}=12$
and
 $\overline{h}=40$
and Proxy-SVAR model proposed by Mertens and Ravn (Reference Mertens and Ravn2013, Reference Mertens and Ravn2014) that uses PTFP as instrument. All models are estimated as subset SVARs using data for the sample period 1970:1–2016:4. The US capacity utilization enters these models as a subset variable. We normalize the scale of shocks to induces a 1% increase in Fernald’s (Reference Fernald2014) PTFP after 20 quarters (
 $h=20$
). All models include four lags and all variables are in first log-differences. Shaded areas are the 68% and 95% confidence intervals based on a recursive design wild bootstrap procedure proposed by Gonçalves and Kilian (Reference Gonçalves and Kilian2004). Data sources and definitions are provided in the Data Appendix A.

Robustness checks of the US productivity spillovers. Notes: This figure shows the cumulated IRFs of TFPs and labor productivity following the US technology shock over a 1- and 5-year horizon for 13 advanced economies and the aggregate for the rest of the world (RW) from alternative model specifications and identification schemes. The graphs in the first row show the results from the baseline model (bars) and the markers denote the point estimates from the Uhlig’s (Reference Uhlig2004) medium-run identification approach with
 $\underline{h}=12$
and
 $\overline{h}=40$
and Proxy-SVAR model proposed by Mertens and Ravn (Reference Mertens and Ravn2013, Reference Mertens and Ravn2014) that uses PTFP as instrument. The graphs in the second row show the results from the baseline model (bars) and the markers denote the point estimates from the baseline model that uses data for the post-1985 sample period, the detrended PTFP and TFP series, respectively. We normalize the scale of shocks to induces a 1% increase in Fernald’s (Reference Fernald2014) PTFP after 20 quarters (
 $h=20$
). All models include four lags and all variables are in first log-differences.

Consequently, using labor productivity as target and outcome variables and applying alternative identification approaches does not change our baseline statements. Thus, the results from the two alternative models support our main conclusions related to an overall low elasticity of cross-country productivity with respect to the US technology shock, as well as heterogeneous productivity spillovers across the major advanced economies.
6.2. Specification of the empirical model
Next, we test the robustness of our baseline results with respect to alternative sample period and transformations of variables included in our baseline VAR model. First, we follow Canova et al. (Reference Canova, Lopez-Salido and Michelacci2010) and restrict our estimation sample to start in the first quarter of 1985.Footnote 18 Second, we detrend PTFP to account for breaks in the mean growth rate of the series. For this purpose, we use the break dates documented in Fernald (Reference Fernald2015): 1973:2, 1995:4, and 2003:4. In a final check, we use detrended growth rates of TFPs for 13 advanced economies while leaving PTFP unchanged.Footnote 19
The second row of Figure 7 shows the results. Overall, these robustness checks confirm our finding of broadly positive but quantitatively limited spillovers of US technology shocks across countries. Thus, our key outcome that the elasticity of foreign TFP with respect to a 1% increase in the US technology level is significantly lower than one remains unaffected. Furthermore, we again find some heterogeneity in the magnitudes of the IRFs across countries.
Notably, concerning the model specification with detrended PTFP, an interesting pattern emerges. While the key conclusions related to limited spillover effects and thus low elasticity of foreign TFP with respect to changes in US technology level hold, responses in some countries flip signs. However, we still find positive effects in France, Italy, Japan, and South Korea.
In sum, our main statements are unaffected by these modifications in the empirical model.
7. Conclusions
This study adds to the empirical literature on international technology spillovers. Specifically, we provide new evidence regarding the size of international TFP spillover effects originating from the US economy. To do so, we use a direct utilization-adjusted US technology measure and analyze the dynamic effects of changes in this measure on TFPs in 13 advanced economies and an aggregate TFP measure representing the RW.
Overall, we do not find large TFP spillover effects of US technology shocks. Specifically, for most countries, these effects are not significantly different from zero. Moreover, the elasticity of foreign TFP with respect to a 1% increase in the US technology level is significantly lower than one for many countries. The finding of low spillover effects is somewhat surprising as technology (knowledge) has the feature of non-rivalry (Keller (Reference Keller2004)). In our opinion, studying the reasons for this incomplete pass-through of US technology gains opens an important avenue for future research. Regarding the sources of the marked slowdown in productivity growth in many advanced economies since the mid-2000s, we conclude that the decline in US productivity growth must have had only a limited role.
Finally, we find no sizable cross-country heterogeneity regarding the magnitude of the US technology spillover effects. Using indicators of non-price competitiveness, we find that isolated institutional characteristics are not able to explain the cross-country differences in the size of the spillover effects. This result contradicts the finding in Cette et al. (Reference Cette, Fernald and Mojon2016), who stress the importance of labor and product market regulations in shaping the transmission of ideas and innovations across countries.
Acknowledgments
We are deeply grateful to the Editor, William A. Barnett, and two anonymous referees for their insightful comments and suggestions. We thank Christoph Fischer, the participants of the Brown Bag Seminar at RWI, the 28th Annual Meeting of the Midwest Econometrics Group in Madison (Wisconsin), and the 6th Annual Conference of the International Association for Applied Econometrics for helpful comments and discussions. We are grateful to Marcelle Chauvet (University of California Riverside, CA) for discussing our paper at the MEG 2018 meeting. We thank the International Association for Applied Econometrics for supporting this article with a travel grant for the IAAE 2019 Annual Conference and the Board of Directors of the RWI and Christoph M. Schmidt for financial support. The views expressed in this paper are those of the authors and do not necessarily coincide with the views of the Bundesrechnungshof, Deutsche Bundesbank, the ECB, or the Eurosystem.
A. The Data
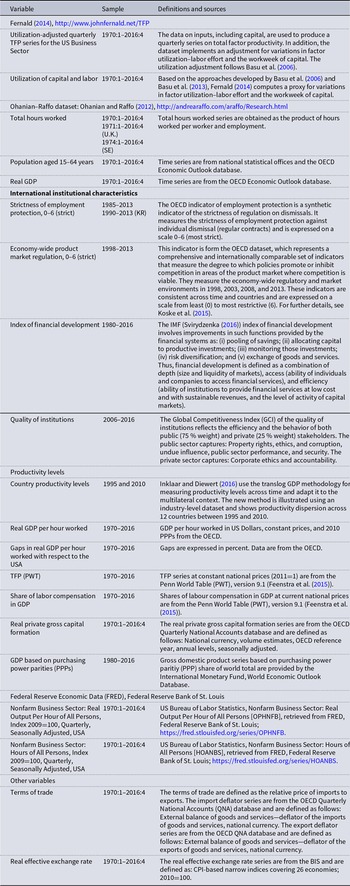
Data sources and definitions

Notes: All definitions are from the original sources. The dataset covers 14 countries: Australia (AU), Austria (AT), Canada (CA), Finland (FI), France (FR), Germany (DE), Ireland (IE), Italy (IT), Japan (JP), Norway (NO), South Korea (KR), Sweden (SE), the U.K., and the US. We exclude Spain from the analysis due to a late starting date of the hours series in 1995:1.
B. The perpetual inventory method
The following steps describe the perpetual inventory method. Imbs (Reference Imbs1999) discusses the derivation of the steps in detail. To compute the equilibrium depreciation rate
 $\delta_t$
, we use a proxy for capital utilization.
-
1. We use the perpetual inventory method to construct the starting capital stock series from the official investment series
 $I_t$
and a quarterly average depreciation rate set to
$\overline{\delta}=0.025$
. The initial value of the capital stock is obtained from
$K_0 = I_1 / (r + g_I)$
, where
$g_I$
is the average growth rate of investment and r is the average interest rate. We tested our results with respect to other choices for the initial capital stock with no significant changes in the final outcome. Following Levchenko and Pandalai-Nayar (Reference Levchenko and Pandalai-Nayar2020), we set r to 1%.
-
2. The starting capital utilization series
$U_t$
is computed using the capital stock series
$K_t$
from the previous step,
$Y_t$
,
$\overline{\delta}$
, and r from the equilibrium relationship
$U_t=$
$\left(\dfrac{Y_t/K_t}{Y/K}\right)^{\dfrac{\overline{\delta}}{\overline{\delta}+r}}$
, where
$Y/K$
is the average period value. -
3. Construct the time-varying depreciation series
$\delta_t$
from
$\delta_t=\overline{\delta}U_t^{1+r/\overline{\delta}}$
.
$U_t$
defines the starting capital utilization series from step (2). -
4. Use the time-varying depreciation rate
$\delta_t$
from the previous step and the official investment series to construct the capital stock series using the standard capital accumulation equation
$K_{t+1}=(1-\delta_t)K_t+I_t$
. To do so, use
$K_0$
determined in step (1) as initial value of the capital stock.


C. Unit root and cointegration tests
Unit root tests

Notes: This table reports the ADF t-statistics for the null hypothesis of a unit root and KPSS LM statistics for the null hypothesis that the data are stationary. Test equations include an intercept and a time trend. Time series are specified in log-levels and log first differences (
 $\Delta$
). Sample period is 1970:1–2016:4, except for Ireland (1970:1–2014:4), Sweden (1974:1–2016:4), and the UK (1971:1–2016:4). ***
 $p<0.01$
, **
 $p<0.05$
, *
 $p<0.1$
.
Cointegration tests

Notes: This table reports the results of the cointegration tests. For the Engle–Granger test, we use the residuals from the regression of the country-specific TFP series on Fernald’s (Reference Fernald2014) TFP (in log-levels). For the Johansen test, we specify a bivariate VAR with Fernald’s (Reference Fernald2014) TFP and a country-specific TFP. The Johansen’ s trace and maximum eigenvalue tests include an intercept in the cointegration equation and the dynamic part of the system. For the dynamic part, we assume four lags. The null hypothesis of each test assumes no cointegration relationship between the variables under consideration. Sample period is 1970:1–2016:4, except for Ireland (1970:1–2014:4), Sweden (1974:1–2016:4), and the UK (1971:1–2016:4). ***
 $p<0.01$
, **
 $p<0.05$
, *
 $p<0.1$
.
D. US technology spillovers on the terms of trade and real effective exchange rate
To study the responses of the terms of trade (henceforth TOT, defined as relative price of imports to exports, thus, a decline signaling an appreciation) and the real effective exchange rate (henceforth REER) following the US technology shock, we replace the country-specific TFPs by the latter variables, one at a time. Figure D.1 shows the cumulated IRFs of the TOT and REER at a 1- and 5-year horizon for 13 advanced economies. In almost all cases, the responses are insignificant. On average, the point estimates of the TOT appreciate persistently after the US technology shock by around 0.30% at each considered horizon. We find similar qualitative dynamics in REER responses across countries.
Terms of trade and exchange rate effects of a US technology shock. Notes: This figure shows the cumulated IRFs of country-specific terms of trade (TOT) and real (REER) effective exchange rate (bars), and TFPs (markers) to the US technology shock over a 1- and 5-year horizon for 13 advanced economies, which enter the SVARs as subset variables, each at a time. Section 3 and notes to Figure 1 give further details. We report the correlation coefficients between the IRFs of TFPs for 13 advanced economies and TOT and REER, respectively. In addition, the correlation between the TOT and REER after 1 (5) year(s) is
 $-0.46$
(
 $-0.41$
).

E. Institutional characteristics
Classification of countries according to institutional characteristics

Notes: This table shows the classification of countries into “high” and “low” regimes, based on the respective institutional characteristics. For this purpose, we compute the country-level averages of the respective institutional indicators. Based on these averages, we compute the median value of each indicator (excluding the US). Consequently, countries displaying an average value above (below) the corresponding median are classified into high (low) regimes. To obtain the same number of countries in each regime, we exclude for each institutional characteristic the respective median country. Definitions and sources of the institutional characteristics considered in this table can be found in the Data Appendix A.