As a complex biological fluid, milk is an important source of energy, proteins, vitamins and minerals, consumed by people in every age. The benefit of milk for human health comes not only from its nourishing properties but also from its antioxidative components. The importance of milk antioxidants may be considered in two ways: the antioxidative components serve consumers by several mechanisms for providing oxidative defence (Chen et al. Reference Chen, Lindmark-Månsson, Gorton and Åkesson2003) and they can maintain milk quality by preventing lipid peroxidation.
Several fractions of milk bear antioxidant properties, such as casein (CN), whey, and lactoferrin (Chen et al. Reference Chen, Lindmark-Månsson, Gorton and Åkesson2003). Unfortunately, the antioxidative ability of thiols and other special amino acid residues existing in proteins are often neglected in most current antioxidant assays. As a distinctive example, Suetsuna et al. (Reference Suetsuna, Ukeda and Ochi2000) separated, purified, and identified antioxidant casein peptides having free radical scavenging power due to their structural properties, e.g., certain amino acid residues of milk casein play an important role in radical scavenging where a certain sequence of the amino acids were found to be more effective than the free amino acids.
Besides milk casein, whey was also investigated for possible antioxidant action. Zulueta et al. (Reference Zulueta, Maurizi, Frígola, Esteve, Coli and Burini2009) separated casein and whey by acetic acid precipitation and determined the individual total antioxidant capacity (TAC) values of these two parts. The antioxidative properties of whey arise from soluble proteins, mainly consisting of β-lactoglobulin (β-LG), α-lactalbumin (α-LA), proteose-peptones, immunoglobulins (IgG, IgA, and IgM) and serum albumins. Analyses of the whole milk, whey and deproteinised milk showed that the major contributor to the TAC of whole milk was the casein fractions, while albumin was the major contributor to the TAC of whey protein. Zulueta et al. (Reference Zulueta, Maurizi, Frígola, Esteve, Coli and Burini2009) observed the lowest TAC values for deproteinised milk containing only water-soluble antioxidant compounds such as vitamin C and uric acid; they also reported difficulties in obtaining Oxygen Radical Absorbance Capacity using fluorescein as probe (ORACFL) values for some samples of deproteinised milk because the values of the areas under the curve were equal to blank values.
There are about 20 amino acids in proteins that can interact with highly energetic free radicals such as ·OH, but the antioxidant activity of proteins was found to be higher than that of free amino acids. This phenomenon can be explained by chemical and physical properties of proteins originating from their amino acid sequences. On the other hand, it is important that the resultant peptide radicals are stable and do not initiate or propagate further oxidative actions (Elias et al. Reference Elias, Kellerby and Decker2008).
Bovine milk β-LG consists of 162 amino acid residues, and five of them are CYS residues (CYS-66, CYS-106, CYS-119, CYS-121 and CYS-160). Being a most important whey protein, the chain-breaking antioxidative effect of β-LG arises from its free thiol groups (Yagi et al. Reference Yagi, Sakurai, Kalidas, Batt and Goto2003).
Although Ellman's method is accepted to be specific for thiols, it is known that the high polarity and negative charge of the reagent generate a drawback for determination of protein sulphydryls (Egwin & Gruber, Reference Egwin and Gruber2001).
As a complex fluid, milk has several redox systems having reactivity that depends on several factors such as reversibility, reduction potential (E 0), oxidant/reductant ratio and concentration. Although milk has some hydrophobic antioxidant species that are supposed to remain in the lipophilic phase when milk fat separates, Noyhouzer et al. (Reference Noyhouzer, Kohen and Mandler2009) claimed that one of the redox species is highly hydrophilic and can be determined in the aqueous phase after phase separation. Thiol groups in amino acids (basically cysteine and methionine), peptides and proteins are the principal antioxidants in milk capable of reducing or scavenging reactive species and free radicals both in vitro and in vivo, and additionally of chelating transition metal ions thereby preventing Fenton-type oxidation reactions. Thus it is the aim of this study to measure the antioxidant power of milk and its various fractions by a reliable procedure (essentially CUPRAC and ABTS methods) capable of reacting with protein thiols and other antioxidative amino acid residues on milk peptides and proteins. The buried protein thiols can be exposed to oxidative attack by the CUPRAC reagent after preliminary separation of the related fractions. Additivity of TAC values of various fractions will also be tested; i.e. if the optical absorbance of a mixture with respect to a given spectrophotometric method is the sum of individual absorbances of the mixture constituents, then the property of additivity is said to be maintained (Bergmann et al. Reference Bergmann, von Oepen and Zinn1987) and chemical deviations from Beer's law may be assumed to be absent in the system of concern. Likewise, additivity of TAC values in a mixture defines the case when the measured TAC of a mixture is equal to the sum of individual antioxidant capacities of its constituents (Van den Berg et al. Reference Van den Berg, Haenen, Van den Berg and Bast1999).
Materials and methods
Milk samples
Different milk samples {skim milk with 0·1% milk fat, light milk with 1·5% milk fat, fatty milk with 3% (minimal) milk fat, special milk produced for children (milk for children), goat milk, organic milk} were purchased from local markets as ultra high-temperature (UHT) processed, homogenised milk in their commercial packagings. Pasteurised milk sample in glass bottle was also studied. Milk samples were kept in the refrigerator at 4 °C.
Chemicals and solutions
Analytical reagent grade neocuproine (2,9-dimethyl-1,10-phenanthroline) hydrochloride, casein (CN), β-lactoglobulin (β-LG), α-lactalbumin (α-LA) (all from bovine milk) were supplied from Sigma Chemical Co. (Steinheim, Germany) and L-cysteine (CYS) from Fluka Chemicals (Steinheim, Germany); CuCl2.H2O, tris(hydroxymethyl) aminomethane (Tris), glycine, trisodium citrate 5,5-hydrate, urea, sodium dodecyl sulphate (SDS), 5,5′-dithio-bis(2-nitrobenzoic acid) (DTNB) (Ellman's reagent), 2,2′-azinobis(3-ethylbenzothiazoline-6-sulphonic acid) diammonium salt (ABTS), ethanol (EtOH), trichloroacetic acid (TCA), hydrochloric acid (36·5%), potassium persulphate, ammonium acetate and all other chemicals purchased from E. Merck (Darmstadt, Germany)
Standard tris buffer (pH 8.0)
The buffer used was the one originally used by Sava et al. (Reference Sava, Van der Plancken, Claeys and Hendrickx2005) with the modification that the masking agent of buffer was Na-citrate instead of Na2-EDTA at same concentration (Çekiç et al. Reference Çekiç, Sözgen Başkan, Tütem and Apak2009). In the present study, SDS was added at 5% (w/v) final concentration to tris buffer in order to eliminate sample turbidity.
Protein dissolution buffer (pH 6·8)
The buffer contained 50 mm Tris, 2% SDS, and 8 m urea (the final pH of solution was adjusted to 6·8 with 2 m HCl) (Papp et al. Reference Papp, Szaras, Korcsmaros and Csermely2006). This buffer was used for dissolving TCA−precipitated milk proteins in the experiments.
CYS, β-LG, α-LA and CN solutions
A suitable weight of CYS was dissolved in 0·5 ml of 1·0 m HCl solution, and diluted to volume with distilled water to yield a final solution at 10 mm. A mass of 0·1 g β-LG (or α-LA) was weighed and dissolved in 10 ml distilled water to obtain a 1% (w/v) solution. One gram casein was weighed and dissolved in 100 ml 5·0 × 10−2 m NaOH to obtain a 1·0% (w/v) solution, which may be slightly heated if necessary to enhance solubility.
CUPRAC reagent solutions
CuCl2.H2O (1·0 × 10−2 m, in distilled water), neocuproine (7·5 mm, in EtOH), and pH 7·0 urea buffer (a suitable amount of urea was dissolved in standard tris buffer, 6 m HCl was added to adjust the pH to 7·0, and diluted with distilled water so as to yield a final total urea molarity of 8 m) were prepared (Çekiç et al. Reference Çekiç, Sözgen Başkan, Tütem and Apak2009).
CUPRACEtOH reagent solutions
CuCl2.H2O (2·0 × 10−2 m, in distilled water), neocuproine (7·5 mm, in EtOH), and pH 7·0 ammonium acetate (1·0 m NH4Ac in EtOH) solutions were prepared (Sözgen Başkan et al. Reference Sözgen Başkan, Tütem, Özer and Apak2013).
ABTS reagent solutions
The reagent for the ABTS/persulphate method (Re et al. Reference Re, Pellegrini, Proteggente, Pannala, Yang and Rice-Evans1999) was produced by reacting 7·0 mm stock solution of ABTS with 2·45 mm potassium persulphate and allowing the mixture to stand in the dark at room temperature for 12–16 h prior to use.
Ellman reagent solution
DTNB solution at 4 mg/ml of standard tris buffer was prepared (Ellman, Reference Ellman1959).
Preparation of milk samples for analysis
Milk samples containing milk fat were defatted before analysis by refrigerated centrifuge. The samples were centrifuged at 9000 g for 30 min at 4 °C (Sava et al. Reference Sava, Van der Plancken, Claeys and Hendrickx2005), solid milk fat collected from the upper part of the centrifuge tube and removed (process repeated when necessary). For skim milk samples, this step is not necessary.
For each type of milk three different kinds of sample were prepared, namely whole milk (defatted whole milk, DWM for fatty milks, SWM for skim milk), milk protein solution (MPS) and milk serum (MS). The samples were prepared as follows: to 5 ml of DWM, 5 ml TCA (5%, w/v) was added; precipitated milk proteins were separated by centrifugation (for 5 min at 2500 g), washed twice with cold acetone and redissolved with 5 ml protein dissolution buffer (MPS). The centrifugate (approximately 5 ml milk serum, MS) was neutralised with 1·0 m NaOH. The MS volume was completed to 6 ml with distilled water.
Milk casein and whey
CN and whey were obtained from skim milk as described by Zulueta et al. (Reference Zulueta, Maurizi, Frígola, Esteve, Coli and Burini2009). To separate milk CN from whey, 0·5 ml 10% acetic asid was added to 9·5 ml skim milk. The mixture was kept at 42 °C in a water bath for 10 min, and precipitated CN was separated by centrifugation. Precipitated milk CN was dissolved with 10 ml protein dissolution buffer and diluted with 5% SDS-containing standard tris buffer at a dilution ratio of 1 : 5 for CUPRAC and 1 : 40 for ABTS measurements. A 0·5 ml-aliquot of CN solution was withdrawn, and CUPRAC and ABTS tests were applied for five repetitive measurements. The separated whey fraction was diluted to 50 ml with distilled water, and a 5 ml-sample aliquot was withdrawn for CUPRAC and ABTS measurements.
Antioxidant capacity and thiol assays
Modified CUPRAC method
(x) millilitre sample and (1−x) ml standard buffer (pH 8) were added to 1 ml 1·0 × 10−2 m CuCl2.H2O, 1 ml 7·5 mm neocuproine, and 2 ml pH 7·0 urea buffer mixture. The final mixture at 5·0 ml total volume was left to stand at room temperature for exactly 30 min, and the absorbance at 450 nm was read against a reagent blank (Çekiç et al. Reference Çekiç, Sözgen Başkan, Tütem and Apak2009). TAC values were calculated as CYS equivalent using the linear regression equation for CYS.
CUPRACEtOH method
Half millilitre 2·0 × 10−2 m CuCl2.H2O, 0·5 ml EtOH, 1 ml 7·5 mm neocuproine and 1 ml 1·0 m NH4Ac solutions were mixed in this order, and × ml sample and (1−x) ml EtOH were added to the reaction medium (final volume was 4·0 ml); the mixture was left to stand for 30 min at room temperature. Absorbance was read at 450 nm against a reagent blank.
ABTS method
In this slightly modified method, the matured ABTS radical solution with blue-green colour was diluted with standard tris buffer at a ratio of 2 : 50 (v/v). To 3 ml of the radical cation solution × ml sample solution and (1·0 − x) ml standard tris buffer were added, and the absorbances were read at the end of the 6 min. The absorbance difference (ΔA) was found by subtracting the absorbance of the sample from that of the reagent blank (radical solution) (Re et al. Reference Re, Pellegrini, Proteggente, Pannala, Yang and Rice-Evans1999). Linear regression equation was determined using CYS as ΔA vs. molar concentration.
Ellman's method
A volume of (x) ml sample + (1−x) ml standard tris-buffer at pH 8.0 + 2 ml pH 8·0 urea buffer (a suitable amount of urea, so as to yield a total urea molarity of 8 m, was dissolved in standard tris buffer, pH was adjusted to 8·0 adding 6 m HCl) +30 μl Ellman's reagent were added in this order to obtain a mixture of 3·03 ml final volume. The absorbance at 412 nm was recorded after 2 min mixing the sample with reagents (Sava et al. Reference Sava, Van der Plancken, Claeys and Hendrickx2005).
Investigating the effect of sodium dodecyl sulphate (SDS)
For eliminating turbidity in CUPRAC application to milk, SDS was added to reaction medium. To investigate the effect of SDS, the method was applied in solutions containing 1·0 mm CYS, 0·2% (w/v) β-LG and 1·0% (w/v) CN in the presence and absence of 5% SDS (in standard tris buffer). In addition, CUPRAC method was applied to 0·2 ml MPS obtained from skim milk in the presence of different volumes of 5% SDS.
Determining the optimal dilution ratio for milk samples
To test the dilution sensitivity, all kinds of milk samples (DWM, SWM, MPS, and MS) were diluted at different ratios with 5% (w/v) SDS containing standard tris buffer. For this purpose, a suitable aliquot was withdrawn from defatted milk samples, as described earlier. For CUPRAC measurements, 1·0 ml aliquots were taken from each sample and diluted 1, 2, 5, 10 and 20 times, whereas for ABTS, 0·3 ml aliquots from each sample were diluted 50, 100, 150 and 200 times. The recorded absorbances of samples were substituted in the linear calibration equation for CYS in the corresponding method (A = 0·79 × 104 C+0·0086 for CUPRAC method and A = 2·03 × 104 C+0·0450 for ABTS method; where A is absorbance and C is molar concentration); the results were calculated as CYS-equivalent (mol/l) and given as μm CYS equivalent by multiplying with the factor of 1·0 × 106.
Linearity experiments
To control the linear responses of selected methods to milk samples, linearity experiments were conducted by taking different volumes from diluted milk samples. For CUPRAC measurements, 0·2–0·9 ml aliquots were taken from 1 : 10 diluted milk samples, whereas for ABTS, 0·1–0·6 ml aliquots were taken from 1 : 100 diluted milk samples, and the methods were applied. Results were calculated and expressed as μm CYS equivalents. Ellman's thiol assay was only applied to SWM sample, which was diluted at 1 : 1 ratio and 0·2–1·0 ml aliquots were taken for Ellman measurements. All dilutions were performed with standard tris buffer containing 5% SDS throughout the experiments.
Standard addition experiments
To observe possible interactions among certain milk constituents that may cause deviations from Beer's law in absorbance measurements regarding TAC determination, standard addition experiments were performed. For this purpose, different volumes of varying sample solutions were added to SWM. In CUPRAC measurements, volumes in the range of 0·1–0·7 ml 50 mm CYS, 0·2–1·0 ml 1% CN, 0·1–0·7 ml 0·2% β-LG and 0·1–0·7 ml 0·5% α-LA were added to 0·2 ml 1 : 10 diluted SWM. For ABTS measurements, 0·1–0·4 ml aliquots taken from 0·1% CN and β-LG solutions, and 0·05% α-LA solution were added to 0·3 ml 1 : 40 diluted SWM. Results were calculated as μm CYS equivalent.
Preparation of CN calibration curves for CUPRAC, ABTS and Ellman methods
To investigate the antioxidant properties of CN, i.e. the main antioxidative fraction of milk, CUPRAC method was applied by taking volumes varying between 0·1 and 0·5 ml from 1% CN solution (in 5·0 × 10−2 m NaOH). For ABTS tests, the same standard CN solution was diluted at a ratio of 1 : 20 with distilled water and the method was applied to sample volumes in the range 0·1–0·4 ml. Finally Ellman's method was applied by taking different volumes of standard CN solution between 0·2 and 1·0 ml. For all three methods, calibration curves were drawn between CN concentration in ppm and TAC values as μm CYS equivalent.
TAC determination of milk samples
Milk samples (i.e. fatty milk, light milk, skim milk, pasteurised milk, child milk and goat milk) were prepared as described in section the Methods. For CUPRAC TAC determinations, 0·5 ml aliquots were taken from 1 : 10 diluted DWM and 1 : 5 diluted MPS samples, and 1·0 ml aliquots were taken from MS samples. As described earlier, 5 ml filtrate was neutralised and diluted to 6 ml for MS samples, extra dilutions being made when necessary. For ABTS measurements, 0·5 ml aliquots were taken from 1 : 100 diluted DWM and MPS, and 1 ml aliquots were taken from MS samples. Each sample was subjected to N = 5 repetitive determinations, and the results were calculated as μm CYS equivalents.
Investigation of TAC entrapped in milk fat
To investigate the entrapped antioxidant activity in milk fat during homogenisation, separated milk fat and DWM were analysed separately and the percentage of the entrapped TAC was calculated. Because the solvent medium of the CUPRACEtOH method contained mostly alcohol instead of water, it was more suitable for dealing with milk fat. In order to compare the TAC of milk fat and defatted part of the whole milk, the same method was applied to both. For this purpose, 30 ml whole fatty milk was divided into 6 equal portions each containing 5 ml sample, and milk fat was separated as stated earlier. All milk fat obtained from different portions was thawed to room temperature and combined. An aliquot of 0·25 ml was taken from it, and CUPRACEtOH was applied as described previously. Additionally, an aliquot of 0·20 ml was taken from DWM and analysed in the same way. TACs of both samples were calculated as μm CYS equivalent by substituting CUPRAC absorbance values in the equation obtained from CYS concentration vs. absorbance graph.
The CUPRACEtOH reaction mixtures were not clear for all samples, i.e., fat turbidity was caused by the immiscible nature of the milk fat, and for defatted part it was the consequence of denaturation of milk proteins by alcohol. For both samples during 30 min reaction time, precipitation was observed and therefore centrifugation and decantation were applied prior to absorbance reading. The supernatant phase was completely clear and the developed colour was stable. For each part of the milk sample, TAC was calculated using absorbance of the aliquots taken from the supernatant.
Results and discussion
Effect of SDS on CUPRAC method
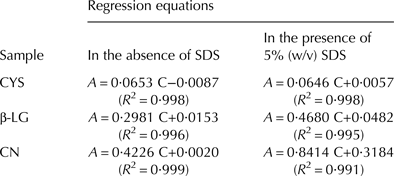
In this work, SDS was added for the first time to tris buffer used in CUPRAC measurements to remove turbidity. The regression equations of the modified CUPRAC method with and without SDS for CYS (as a simple thiol) and for β-LG and CN (as milk proteins) are presented in Table 1.
The regression equations of the modified CUPRAC method with and without SDS for CYS, β-LG and CN

A, absorbance; C, concentration (as ppm)
As can be seen from the corresponding regression equations, CYS results were nearly the same in the absence or presence of SDS, whereas for representative milk proteins (β-LG and CN), SDS caused an increase in absorbance values. Although SDS alone was non-responsive to CUPRAC, its synergistic enhancement of milk protein responses may be attributed to increased exposure of thiols (R-SH) and certain amino acid moieties on proteins by surfactant solubilisation. In similar cases, protein solubilisation by surfactants was reported to enhance the susceptibility to enzymatic cleavage (Pan et al. Reference Pan, Stocks, Brown and Konermann2009). Finally, to investigate the effect of SDS on proteins, milk proteins were precipitated and redissolved from skim milk to obtain MPS, and different volumes of 5% SDS solution (in standard tris buffer) were added to 0·2 ml of this MPS (Fig. 1). As can be seen from Fig. 1, MPS thiols and CUPRAC-responsive amino acid residues are exposed increasingly by surfactant addition, and then reach a saturation level (observed by an absorbance plateau region) where more SDS would not increase absorbance.
The effect of SDS on MPS response to the CUPRAC method.
Determination of the optimal dilution ratio for milk samples
The dilution sensitivities of applied TAC methods, namely CUPRAC and ABTS, were tested by recording μm CYS equivalent results against dilution ratios only for SWM samples (Figs. 2 & 3). Dilution ratios between 2–10 times gave linear results for CUPRAC, but starting from 20 times dilution, curvi-linear results were obtained (Fig. 2). On the other hand, ABTS method showed an acceptable linearity in the range of 50–200 times dilution ratios.
The relationship between dilution ratios and CYS equivalent results for whole skim milk sample with respect to the CUPRAC method.
Linearity experiments
Selected TAC methods were applied to DWM, MPS and MS samples for all tested milk types. For all tested samples, the squared linear correlation coefficients (R 2) of calibration curves – drawn between sample volume and μm CYS equivalent TAC results– were calculated with the aid of MS Excel 2007. R 2 values were between 0·9993–0·991 for CUPRAC and 0·998–0·98 for ABTS methods. Although the curves were highly linear for both methods within a reasonable concentration (volume) interval, CUPRAC in general had a better linearity. Ellman's method only responded to concentrated milk samples (also producing turbidity problems), and yielded very low absorbances for diluted samples. Therefore, the method was only applied to 1 : 1 diluted SWM, and the equation of calibration graph was:
 $${\rm TAC}\,({\rm as}\,\,{\rm \mu} {\rm M}\,\,{\rm CYS}) = {\rm 15}\,{\rm V}_{{\rm ml}} - {\rm 1}\!\! \cdot\! 0{\rm 4} (R^{\rm 2} = 0 \cdot {\rm 995})$$
However, Ellman's thiol exchange is known to respond to only thiols, and not to other antioxidative moieties on proteins.
Standard addition experiments
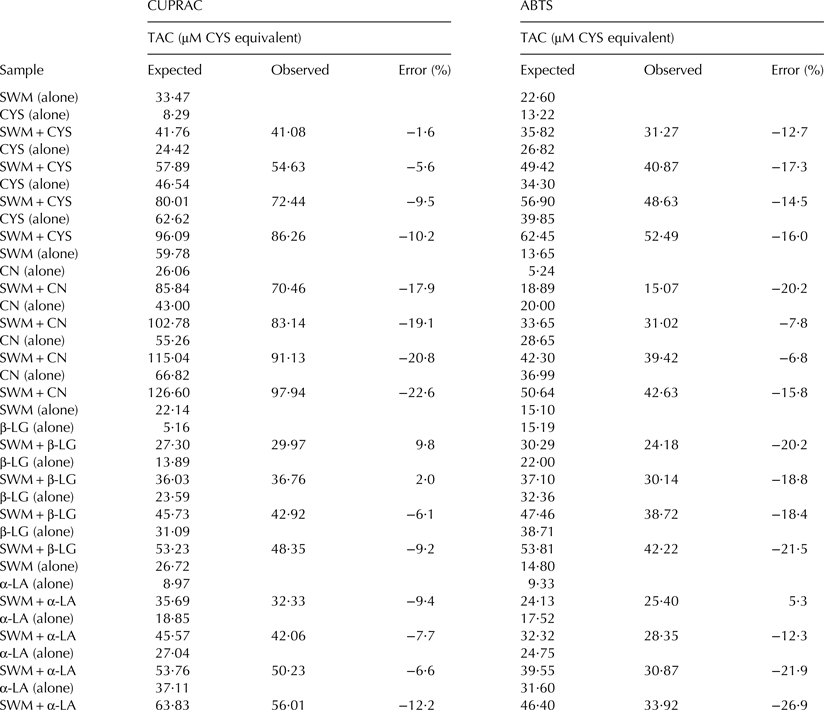
In investigating potential interactions among antioxidative milk constituents, standard addition experiments were performed to test possible deviations from Beer's law. Theoretically expected and experimentally found results for the addition of CYS, CN, β-LG and α-LA into SWM were compared with the aid of relative (percentage) error, which was defined as the ratio of the difference of μM CYS-equivalent TAC values from the expected value, found with the use of CUPRAC and ABTS methods (Table 2).
Comparison of expected and observed TAC results (as μM CYS equivalent) of CYS, CN, β-LG and α-LA addition to skim whole milk (SWM), found with the CUPRAC and ABTS methods
As can be seen from Table 2, experimental results were generally lower than theoretical results (i.e. comprised of the algebraic sum of the TAC values of milk and sample antioxidants). It is known from literature that protein folding coupled to disulphide (RSSR) bond formation is a very complicated process (Creighton, Reference Creighton1997), and folding in oxidative environments (e.g., in the presence of oxidising TAC determination reagents) may convert RSH to the corresponding RSSR compounds (Wedemeyer et al. Reference Wedemeyer, Welker, Narayan and Scheraga2000), the overall effect of which is the decrease of the observed TAC. Thus, oxidative folding resulting in RSSR bond formation, being a thermodynamically favoured process, may constitute a plausible explanation for the antagonistic interactions of added and originally existing antioxidant constituents of milk proteins, since the errors were generally negative in all assays performed (Table 2). However, in the case of a simple RSH exchange with protein RSSRs, such as CYS addition to SWM (Table 2), the TAC is not expected to show drastic changes, which was seen in CUPRAC results where a concentration-dependent small error was recorded (Table 2) as opposed to the large negative error seen in ABTS results irrespective of concentration (Table 2). In ABTS/persulphate tests, thiols exhibit trolox equivalent antioxidant capacity (TEAC) coefficients greater than 1.0 (Apak et al. Reference Apak, Güçlü, Özyürek, Karademir and Altun2005), meaning that their oxidation does not stop at the RSSR stage and probably extend further up to sulphenic acids (RSOH). ABTS, like H2O2, may oxidise thiol groups to RSOH, which is rather unstable and reactive. In the presence of a strong oxidising agent such as ABTS/persulphate, RSSR bond formation (accompanying protein folding) by the oxidant may be kinetically favoured over oxidation of cysteine to cysteine sulphinic acid (RSOOH) and over the oxidation of other amino acids in the proteins such as methionine. Such structured RSSR intermediates may bury reactive groups in a stable tertiary structure, inhibiting their rearrangement by RSH/RSSR exchange (Wedemeyer et al. Reference Wedemeyer, Welker, Narayan and Scheraga2000). Thus, RSOH rapidly forms stable intra- or inter-molecular RSSR bonds if other thiol groups are present in the vicinity (Claiborne et al. Reference Claiborne, Yeh, Mallett, Luba, Crane, Charrier and Parsonage1999), thereby decreasing the observed TAC in protein-thiol combinations of standard addition tests and causing negative deviations from additivity. Generally, it can be observed from standard addition tests that the property of TAC additivity of constituents (i.e. a general requirement of TAC measurements in conformity with Beer's law) was better in CUPRAC than in ABTS/persulphate (Table 2), possibly because the redox potential of the CUPRAC reagent is not high enough to convert thiols to RSOH and RSOOH acids, i.e. the TEAC coefficients of simple thiols in the CUPRAC test is about 0·5, corresponding to RSH-RSSR oxidation (Apak et al. Reference Apak, Güçlü, Özyürek, Karademir and Altun2005). On the other hand, the comparatively large negative deviations from additivity of TAC values observed when using both CUPRAC and ABTS methods upon CN addition to SWM (Table 2) probably point to the number and proximity of the corresponding sulphur atoms leading to RSH/RSSR exchange which is expected to affect the rate of RSSR-bond formation (Wedemeyer et al. Reference Wedemeyer, Welker, Narayan and Scheraga2000).
Standard CN calibration graphs in CUPRAC, ABTS and Ellman methods
CN is known to constitute the main antioxidative part of milk (Zulueta et al. Reference Zulueta, Maurizi, Frígola, Esteve, Coli and Burini2009). As can be seen from the linear regression equations obtained by the concentration (ppm)-dependent CYS-equivalent contents of CN for CUPRAC (Eq. 2), ABTS (Eq. 3) and Ellman's method (Eq. 4), there are linear responses to CN concentration indicating the presence of free thiol groups known to be primarily responsible for the observed TAC.
 $${\rm TAC}\,({\rm as}\,\,{\rm \mu m}\,\,{\rm CYS}) \!=\! {7\!\cdot\!39} \times {\rm 10}^{ - 2} \,{\rm C} \!+\! {21\!\cdot\!92}{\rm} (R^{\rm 2} \!=\! {0\!\cdot\!998})$$
 $${\rm TAC}\,({\rm as}\,\,{\rm \mu m}\,\,{\rm CYS}) \!=\! {5\!\cdot\!90} \times {\rm 10}^{ - 1} \,{\rm C} \!+\! {4\!\cdot\!36}{\rm} (R^{\rm 2} \!=\! {0\!\cdot\!980})$$
 $${\rm TAC}\,({\rm as}\,\,{\rm \mu m}\,\,{\rm CYS}) \!=\! {2\!\cdot\!18} \times {\rm 10}^{ - 2} \,{\rm C} \!+\! {0\!\cdot\!25} {\rm} (R^{\rm 2} \!=\! {0\!\cdot\!999})$$
Determination of TAC of milk CN and whey
The TAC of skim milk CN was calculated as 929 ± 2 μm CYS equivalent and 4676 ± 4 μm CYS equivalent with CUPRAC and ABTS methods, respectively. The TAC of whey was found to be 208 ± 3 μm CYS equivalent and 533 ± 4 μm CYS equivalent by employing CUPRAC and ABTS assays, respectively, showing the significant contribution of whey to the observed TAC of milk. The TAC values of these protein fractions found with ABTS were generally higher than those of CUPRAC possibly because of the already mentioned higher TEAC coefficients of RSHs manifested in the ABTS/persulphate test (Apak et al. Reference Apak, Güçlü, Özyürek, Karademir and Altun2005), indicating the formation of essentially irreversible higher oxidation products such as RSOHs and RSOOHs from RSH in ABTS as compared with essentially reversible oxidation products such as RSSRs formed in CUPRAC.
Determination of TAC entrapped in milk fat
For fat part of the sample, TAC was calculated as 162·1 μm CYS equivalent and for DWM it was determined as 2200 μm CYS equivalent. Percentage ratio of TAC entrapped in milk fat to that in DWM was found as 7·37% from the calculation {(162·1/2200) × 100} and the percentage ratio of TAC entrapped in milk fat to that in whole milk (i.e., milk containing fat) was calculated as (7·37/107·37) × 100 = 6·90%. Since lipids were shown to have no antioxidant capacity in preliminary tests, all TAC remaining in milk fat can be considered to derive from entrapped antioxidants in milk fat during homogenisation of milk prior to UHT sterilisation. Because of this low percentage value, TAC entrapped in fat was not taken into account for simplifying further experiments.
Determination of TAC of milk samples
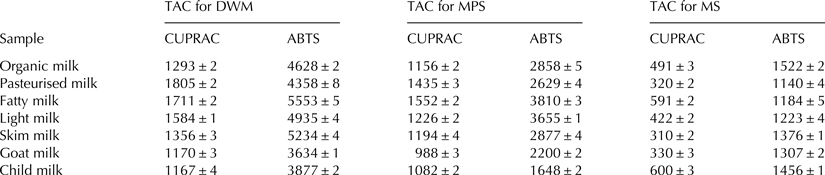
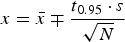
TAC of milk samples are reported in Table 3, where the mean TAC values ( $\bar x$) were calculated within 95% confidence interval for N = 5 repetitive measurements using the formula:
 $$x = \bar x \mp \displaystyle{{t_{0.95} \cdot s} \over {\sqrt N}} $$
It can be seen from Table 3 that milk proteins are responsible for a larger part of milk TAC, although their true roles in antioxidant activity/capacity determinations are often neglected (Miller, Reference Miller and Armstrong1998). The results were also compatible with those concerning CN and whey. There is more or less additivity in the TAC values of MPS and MS fractions in the CUPRAC test so as to equalise to that of DWM:
 $${\rm TAC}_{{\rm DWM}} \le {\rm TAC}_{{\rm MPS}} + {\rm TAC}_{{\rm MS}} $$
Since milk proteins were denaturated with the dissolution buffer containing 8 m urea, there was additional TAC coming from the exposition of buried thiol groups of proteins to the oxidative attack of TAC reagents, so the combined TAC of MPS and MS slightly exceeded that of DWM especially in the CUPRAC results Table 3. The highest TAC using both methods was observed in the fatty milk sample.
As noted by the authors in previous works, CUPRAC method is responsive to protein antioxidants (Çekiç et al. Reference Çekiç, Kara, Tütem, Sözgen Başkan and Apak2012), since its redox reagent, essentially cupric-neocuproine, can react with both free thiols and certain other antioxidative amino acid moieties (e.g., those of histidine, arginine, lysine, proline, methionine, and cysteine) in proteins (Çekiç et al. Reference Çekiç, Sözgen Başkan, Tütem and Apak2009). It has been demonstrated in this work that the CUPRAC method of TAC assay is suitable for investigating the antioxidative constituents and fractions of milk, including proteins, and most of the TAC results were reasonably additive.
The relationship between dilution ratios and CYS equivalent results for whole skim milk sample with respect to the ABTS method.