Introduction
Many electromagnetic applications, such as radio astronomy and UWB technologies, require wideband antennas. The tapered slot antenna (TSA), also known as the Vivaldi antenna, is a popular wideband antenna nowadays; Gibson built the Vivaldi antenna for the first time in 1979 [Reference Gibson1]. TSA has been used in various wireless communication applications, including high-bandwidth requirements such as automobile traffic, through-the-wall communication, radar imaging, and wireless communication [Reference He, Shan, Fan, Mo, Yang and Chen2–Reference Fioranelli, Salous, Ndip and Raimundo4] imaging, due to its simple structure, low cross-polarization, and highly directional patterns.
The flare's long electrical length, which is the foundation of the antenna's broadband characteristic, also limits performance at high frequency, due to phase reversals throughout its length. The phase reversal causes off-axis and aperture's end produces end-fire radiation, which is not in phase with the antenna's aperture fields. The most efficient way to deal with this problem is to decrease the flare opening size and tapering rate. Due to the phase reversal, this technique strengthens the coupling between the arms while weakening the coupling between various parts of the same arm. On the other hand, the reduced flare will reduce operating frequency. As a result, the trade-off between gain and bandwidth exists. To miniaturize Vivaldi antenna and preserve its good performance, several corrugation approaches are presented, such as rectangular slits at sun-shaped configuration [Reference Moosazadeh, Kharkovsky, Case and Samali5], exponential slot edge [Reference Oliveira, Perotoni, Kofuji and Justo6], elliptical corrugation [Reference Malakooti, Moosazadeh, Ranasinghe and Fumeaux7], comb-shaped slit [Reference Moosazadeh, Kharkovsky, Case and Samali8], sine-shaped corrugation [Reference Briqech, Robitaille, Bishyk, Abdo, Bhogal and Sebak9]; however at higher frequencies, the aforementioned antipodal Vivaldi antennas (AVAs) have minimal gain. Consequently, optimizing the high-frequency AVA design with a reasonably small footprint and good gain presents a new difficulty. At higher frequency, one of the efficient methods to increase the gain is to place a “director” into the AVA's aperture, which can focus the energy in the end-fire direction. An elliptical patch [Reference Nassar and Weller10] and complementary split-ring resonator [Reference Sivashanmugavalli and Vijayalakshmi11] are provided, but these two AVAs have their aperture directions lengthened and their overall diameters enlarged. The application of parasitic elements that serve as metallic grating lenses and for range extension, which results in gain enhancement in the low frequency, is recommended in [Reference Hong, Ahn, Jeong and Yoon12] for an antipodal Vivaldi antenna with gain enhancement without increasing the antenna size. Regular slot edges have been added to the antenna's arms, increasing gain without compromising the antenna's other properties. All of the approaches discussed above are primarily intended to increase the gain of individual elements. But as we work with the array design, things get more difficult.
To produce high realized gain, array structures that are frequently employed, there is an unavoidable issue in array design: overcoming the conflict between the sidelobe and the mutual coupling of the elements. Strong sidelobe reduces antenna radiation performance while high coupling affects bandwidth. In general, a low sidelobe is achieved by shortening the space between the components. As a result, in the case of a short distance, the coupling must be reduced. Recent studies have explored techniques to improve the Vivaldi antenna's radiation performance at high frequencies. These solutions include using dielectric lenses [Reference Teni, Zhang, Qiu and Zhang13], materials with high permittivity [Reference Bourqui, Okoniewski and Fear14], and zero index materials [Reference Sun, Chen and Qing15] in the aperture flare portions to direct energy in the ultimate end-fire direction. Metamaterial lenses [Reference Xu, Wang, Tao and Cui16] and dielectric lenses [Reference Moosazadeh and Kharkovsky17] are also used to boost gain. However, these approaches improve performance over a narrow frequency band while increasing fabrication complexity and cost. The Vivaldi antenna is commonly employed because of its large operational bandwidth; however, additional issues develop that affect the radiation quality when the frequency rises. Unwanted radiation currents traveling through flare termination portions are one of these challenges; it affects the overall radiation performance of the antenna, which can be mitigated by square or sinewave corrugating structure in the termination sections [Reference Wang and Zhang18] and avoiding sharp edges that produce wave diffraction. However, it adds also to the design's complexity.
Another cause for low performance at high frequencies is the substrate's susceptibility to thickness. Unwanted modes are activated as the electrical thickness grows. These modes caused pattern distortion and increased cross-polarization levels by modifying the phases of waves passing through the flare section. To prevent these issues, thin, low-dielectric-constant substrate materials are used. The thickness of the substrate should be smaller than 0.03λo, where λo is the wavelength at free space, according to [Reference Janaswamy and Schaubert19].
The antenna feeds its array via a substrate integrated waveguide (SIW) power splitter and microstrip to grounded co-planar waveguide (GCPW) transition [Reference Liu, Zhu, Tang, Wang and Hong20,Reference Yang, Elsherbini, Lin, Fathy, Kamel and Elhennawy21]. Its flat structure and minimal loss make it suited for application in the mm-wave range. The overall size and level of design complexity present the most significant design problems for the SIW power splitter construction. It is challenging to drill the vias and fill them with copper inside.
In the proposed structure, we have used an array with a microstrip power splitter as a feed network. Its fabrication is easy, and the splitter size is compact. Additionally, if we want to increase the gain further, we have to increase the number of elements (let us say four more elements). For that, we have to make a 1 × 8 microstrip power splitter. A power splitter using the microstrip lines (MSL) can solve the problem but has significant radiation leakage at a higher frequency range.
Further, the line width becomes very thin, which is not feasible for large power division ratios. Designing the microstrip power splitter for more power division with acceptable insertion loss and higher impedance bandwidth is challenging. To look over the above problem, we have not increased the number of elements; although, we have constructed an array of four elements only along with the patch on an individual element, which helps to improve the overall gain of the antenna without compromising the size and design complexity. This paper presents a miniaturized modified Vivaldi antenna array (1 × 4) with gain and bandwidth enhancement for the frequency band 8.5–12.5 GHz. To improve performance, an elliptical patch in between the flare aperture is designed.
Section “Single-element antenna design” describes single-element design. In section “Four-element antenna array”, the four-element array is designed using a microstrip power splitter, and the performance of the array with and without the patch is investigated. In section “Measured result and discussion”, different simulated and experimental results are reported. Our conclusion is presented in section “Conclusion”.
Single-element antenna design
A microstrip to SIW feed, a planer slot antenna, and a patch are developed in the proposed antenna structure. The antenna radiates in the patch's direction, stimulating surface waves that travel along its axis and generating end-fire radiation. On both sides of a dielectric substrate, the antenna's slots are printed. The arms spin symmetrically around the axis of the antenna aperture, extending out in opposite direction.
At low frequencies, the flare-shaped antenna is resonant, but at high frequencies, it mainly acts as a non-resonant traveling wave radiator. The low-frequency performance of the antenna is determined by the antenna width (the largest gap between the two arms), which must be half wavelength on the lower side of the frequency range. Traveling wave currents at the flare edges produce radiation at higher frequencies. As the aperture flare size increases, wave energy decouples from the structure. It produces radiation in the end-fire direction, and this can happen if the phase difference between waves traveling on both arms must equal ~2π. In solution to this issue, the antipodal structural concept was created. The antenna's top and bottom layers have an exponential tapering profile, which is defined as follows:

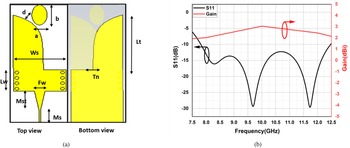
where the value of c 1 = 9.79 and c 2 = −0.949, r is the tapering rate. Figure 1 shows the proposed simulated single-element top and bottom view of the structure. MSL are widely used in microwave systems because they are lightweight, low cost and easier integration with other components. SIWs, which inherit the benefits of typical rectangular waveguides without bulky shapes, have recently sparked interest in low loss and high-power planar applications. When we connect a SIW with a 50 Ohm-microstrip feed line, there is a discontinuity in the connection. It can excite higher-order modes, and it can act as a radiating element. One solution is that a low-loss microstrip to SIW transition is employed to convert the SIW's variable impedance to the 50 Ohm impedance MSL.
Single element. (a) Top and bottom views of the proposed structure. (b) Simulated result of reflection co-efficient and gain.

The transition covers the X-band frequency range. The feed part and antenna flare structure are implemented on a substrate (RO4003c) with dielectric constant (ɛr) = 3.38, the height of the substrate is t = 0.813 mm and loss tangent (tanδ) = 0.0027. The antenna parameters are tuned and summarized in Table 1. Figure 1(a) shows the top and bottom views of the single element and impedance bandwidth and gain of the designed structure are shown in Fig. 1(b). It shows the reflection coefficient is better than 13 dB over the X-band range and the maximum gain of the single-element antenna obtained is 3.1 dBi at 10 GHz.
Optimized values of parameters in single element

Four-element antenna array
Feed network
A 1 × 4 power divider is used in the proposed array to ensure that each radiating element is excited at the same level. The power divider's input port width is set to 1.72 mm to match the 50-coaxial line; after that, a quarter-wave transformer is employed to match two 100-MSL. This 100-feed line powers the antenna. The four-way splitter, which was completely optimized with CST and operated in the frequency range of 8–12 GHz, is used. The optimized values are given in Table 2. This divider is built on the RO4003c substrate, which has a thickness of t = 0.813 mm and a loss tangent (tanδ) of 0.0027.
Parameter details of power splitter

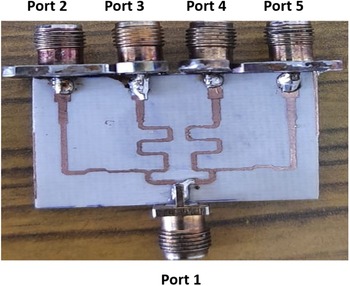
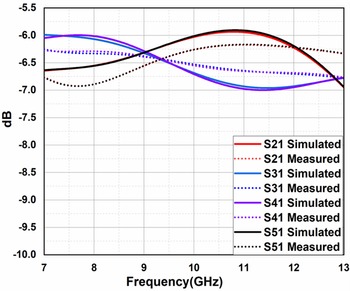
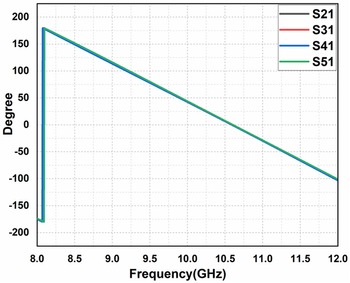
Feed network's fabricated structure is shown in Fig. 2, while Figs 3 and 4 depict the simulated and measured input reflection coefficient and insertion loss at the output ports, respectively. This feed network covers more than 40% bandwidth and it has less than ±0.9 dB amplitude imbalance. As shown in Fig. 5, power splitter has less than ±4° phase imbalance. E-field distribution is shown in Fig. 6.
Fabricated power splitter.

Simulated and measured return loss.

Insertion loss of power splitter.

Phase response of power splitter.

E-field distribution.

Performance analysis using patch
The parasitic patch is designed between the flare aperture. This parasitic patch is used to couple the field radiated from the flare aperture to focus the radiation in the end-fire direction. It maximizes the antenna's directivity and thus gain. After the analysis of different shapes of patch, the elliptical shape is recommended for best performance enhancement. Because it effectively couples the wave from the tapered aperture to create radiation, it also eliminates the need for a fragile substrate.
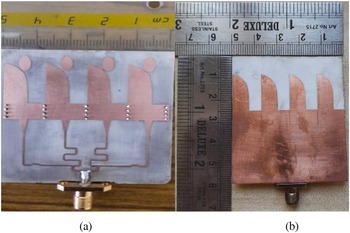
The geometrical description of the suggested structure with patch is shown in Fig. 7. The top and bottom views of the proposed structure are shown in Figs 7(a) and 7(b) respectively. Figure 8 shows the antenna array's fabricated structure. Figure 8(a) depicts the top view, whereas Fig. 8(b) depicts the bottom view.
Simulated 1 × 4 antenna array structure. (a) Top. (b) Bottom.

Fabricated antenna array structure. (a) Top. (b) Bottom.

The ellipse's minor axis (a), major axis (b), and position in the flared aperture (d) shown in Fig. 7 influence its performance; to maximize the coupling between the patch and flare aperture, these values should be optimized. A patch should be positioned close to the flare shape to increase wave coupling but not so close that the field coupling at the flare shape is affected. The major axis of the parasitic ellipse must be chosen so that the ellipse is close to its origin but it should not touch the flare aperture. The optimized value of the distance of d = 0.5 mm from the arms' margins, elliptical patch major radius of 3 mm (b), and the minor axis of 1.5 mm (a) are chosen. Table 1 shows the optimal values of the designed structure.
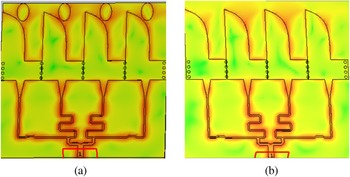
The patch structure has a high field coupling to the flared aperture, resulting in more focused radiation in the end-fire direction than the design without it. Furthermore, flare's inner edges have stronger electric field as shown in E-field distribution in Fig. 9.
E-field distribution. (a) With patch. (b) Without patch.

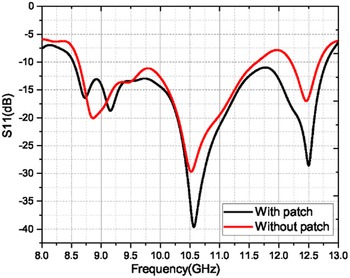
The simulated return loss (S11) with and without patch shown in Fig. 10, as seen adding the elliptical patch, affects S11, and better impedance bandwidth is obtained with patch; the bandwidth is improved by 1 GHz. The gain of the array also improved, as depicted in Fig. 11. The antenna array with the patch gain is marginally improved in the lower frequency band but significantly more in the higher frequency range.
Simulated return loss with and without patch.

Simulated gain with and without patch.

At 11 GHz, as shown in Fig. 11, the gain abruptly decreases. High mutual coupling between the array elements is the leading cause of this. As illustrated in Fig. 12, the mutual coupling is considerable at frequencies between 10.5 and 11.5 GHz, and its maximum value can approach −13.1 dB. As a result, strong coupling significantly reduces antenna gain.
Mutual coupling.

Further, the antenna array's elements are positioned in the E-plane, producing radiation with a low side-lobe level and a narrow main lobe. A 1 × 4 microstrip power splitter is used to implement the antenna array in the E-plane. A grating lobe can be produced by a large separation between elements, but a minor gap can provide a significant amount of mutual coupling. The element spacing Ws in this case is 12.6 mm, or the width of a single element. A basic grating lobe analysis is used to acquire this space, and it is

This four-element antenna array's primary beam angle is ϕ. Only the broadside direction in the E-plane, which in this instance is ϕ = 90°, needs to be taken into account. The array spacing is 12.6 mm, or 0.4 times the wavelength at 10 GHz, in order to prevent the grating lobe over the whole frequency range.
Measured result and discussion
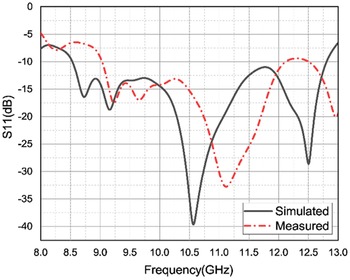
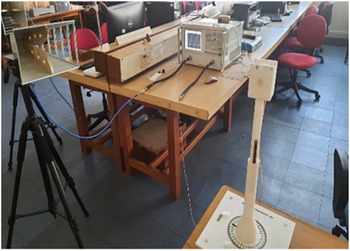
An experimental prototype of the antenna array has been fabricated and measured to verify the proposed structure. As shown in Fig. 13, it can be observed that the simulated and measured results are relatively close. Simulated impedance bandwidths for the proposed structure range from 8.5 to 12.5 GHz. The measurement setup is shown in Fig. 14.
Simulated and measured return loss.

Measurement set-up.

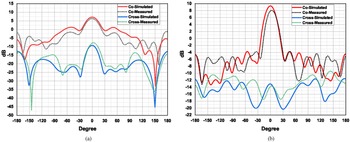
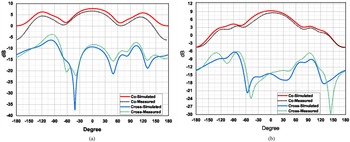
Figures 15 and 16 show the simulated and experimentally validated E-plane (ϕ = 90°) and H-plane (ϕ = 0°) radiation pattern characteristics at two distinct frequencies of 10 and 12 GHz, respectively. The pattern demonstrates the array's directional nature. The antenna contains end-fire features along the x-axis since the main beam is along the direction of the tapered slot. The cross-polarization is also measured and found it to be −13 dB at 10 GHz and approximate −20 dB at 12 GHz. The 3 dB beamwidth and side lobe level at 10 GHz are 31° and −7 dB and at 12 GHz are 27° and −13 dB, respectively. Because the antenna elements are positioned in the E-plane, the radiation pattern features a relatively thin main lobe and a low amount of side lobes. Figure 17 depicts the antenna measured gain as a function of frequency for the proposed antenna. The gain is 6.25 dBi at 8 GHz, 7.24 dBi at 10 GHz, and 9.14 dBi at 12 GHz. The figure also shows the radiation efficiency, which is above 90% across the band.
Simulated and measured E-plane radiation pattern (co and cross) at (a) 10 GHz, (b) 12 GHz.

Simulated and measured H-plane radiation pattern (co and cross) at (a) 10 GHz, (b) 12 GHz.

Measured gain and radiation efficiency.

A comparison of the designed array with previously reported works on TSA arrays is shown in Table 3. The SIW feed network is used in the feeding techniques because at millimeter-wave range, it has low insertion loss with wideband performance, and high gain is attained with this array, but the overall dimension becomes very large as shown in [Reference Kazemi, Fathy and Sadeghzadeh24,Reference Puskely and Mikulášek25,Reference Liu, Zhu, Jiang, Zhang, Tang and Hong28] and [Reference Park, Shin and Park29]. The gain of [Reference Sturdivant and Chong22,Reference Brzezina, Amaya, Petosa and Roy23] and [Reference Zhu, Liu and Wen27] is lower than the SIW-based arrays due to the MSL feed structure, which have considerable insertion loss, especially at higher frequencies. The antenna reported in [Reference Sturdivant and Chong22] works at the same frequency as the proposed antenna with lower gain. Similarly, the proposed structure is better compared to [Reference Guo and Qiang26] in miniaturization. With respect to dielectric materials, compared to [Reference Brzezina, Amaya, Petosa and Roy23] the suggested structure has a lower dielectric constant material. The proposed array shows superior bandwidth and efficiency performance while possessing a smaller footprint. The elliptical patch and the SIW between the two adjacent antennas are primarily responsible for the size reduction with improved gain.
Comparison of some related work on TSA array

ML, microstrip line; SIW, substrate integrated waveguide.
Conclusion
A 1 × 4 antenna array is designed and fabricated, and a new strategy for increasing the TSA array structure's gain and bandwidth is examined. Using an elliptical patch in between, the aperture has been verified to be an effective way to get high gain and bandwidth.
The maximum measured gain is 9.1 dBi and impedance bandwidth is 40%. The recorded radiation efficiency is greater than 90%. The overall dimension of the proposed structure is ~1.6λ × 1.8λ × 0.027λ, which is very compact.
Acknowledgements
This work was supported by BIT MESRA RANCHI, JHARKHAND.
Author contributions
All authors contributed equally to analyzing data and reaching conclusions, and in writing the paper.
Financial support
This research received no specific grant from any funding agency, commercial or not-for-profit sectors.
Conflict of interest
None.
 Chanchala Kumari received the B.Tech. degree in Electronics and Communication Engineering from Ranchi University in 2010 and the M.Tech. degree from IIT Kharagpur in 2015. She is currently pursuing the Ph.D. degree in the Department of Electronics and Communication Engineering at the BIT Mesra Ranchi, Jharkhand, India. Her current research interests include tapered slot antenna, antenna array, and SIW.
 Dr. Neela Chattoraj is presently working as an Associate Professor (Electronics and Communication Engg), B.E. from BIT Mesra, Ph.D. completed 2007, research experience in CSIR (1988–1992), Project Engineer under MHRD till 2001. Areas of research include antenna, genetic algorithm, microwave circuits, and MEMS. Completed project on MEMS in the years 2014 and 2020 (under NPMASS IISC Bangalore and SERB GOVT of India). Published paper on MEMS phase shifter, MEMS switch reconfigurable antennas, genetic algorithm, fractal antennas, dual band and multi-frequency antennas, meta surface, DRA, electromagnetic inverse scattering analysis, and UWB antennas. Dr. Neela Chattoraj published three patents.