Introduction
The continuous evolution of the European Union's (EU)Footnote 1 structures of government has been remarkable when compared with national institutions. Over the years, the European Council has been institutionalized and transformed, from informal gatherings of European leaders in the 1960s to more formal meetings from the mid-1970s to quarterly summits chaired by a permanent President since 2009. The European Parliament (EP) has likewise evolved from a nominated, consultative assembly to a directly elected co-legislator, while the European Court of Justice (ECJ) has seen its influence grow, thanks to the preliminary ruling procedure and the doctrines of direct effect (Van Gend en Loos v. Nederlandse Administratie der Belastingen, 1963) and supremacy (Flaminio Costa v. ENEL, 1964). Meanwhile, the European Central Bank (ECB) has taken over from the European Monetary Institute (and the European Monetary Cooperation Fund before that) to become a fully fledged EU institution with extensive powers over monetary policy in the Eurozone.
One development that has not occurred, however, has been the reform of the EU's so-called ‘federal blindness’. That term, coined by Ipsen (Reference Ipsen1966), describes the EU's lack of recognition of the powers, role, and activity of the levels of government beneath the member state. Though such federal blindness would today be better described as mere short-sightedness, its persistence is puzzling. Beyond path dependence and institutional apathy, one could have expected endogenous pressures to have triggered a greater departure from the status quo than that observed. Why have we not witnessed major institutional change in this area while ground-breaking evolutions have taken place in others?
This article sheds some light on the surprising persistence of the EU's original federal blindness. It is structured as follows. It starts by answering the ‘so what?’ question, outlining why one should care about the EU's federal blindness. It then maps the EU's initial federal blindness and gradual – if still limited – departure from it. The limitedness of such change is surprising because of the presupposed pressure exerted by two factors: (1) deeper EU integration and (2) widespread regionalization processes within the EU's member states. These phenomena were expected to spark demands for greater recognition and involvement of the sub-state level in EU policy-making. While some demands have been met, change has been less dramatic than expected. Whereas member states have transferred increasing power to institutions such as the EP, the ECJ, or the ECB and have allowed themselves to be outvoted by their peers through the extension of non-unanimity procedures, the sub-state level has not benefitted from such largesse at the EU level.
Prompted by the limited nature of the observed change, the article's second section questions the accuracy of the two factors assumed to exert pressure for change. While deepening integration is easy to verify, the regionalization of the EU's member states is trickier to test. Though member states tend to either devolve power to the sub-state level or preserve existing domestic distributions of power intact, measuring the aggregate level of regionalization within the EU at any point in time is less straightforward. To this end, a novel formula allowing the calculation of such an aggregate measure is proposed. Using publicly available data (Hooghe et al., Reference Hooghe, Marks and Schakel2010), the scores returned by the formula show that while the EU was at its most regionalized between 1986 and 2003 it has since dropped to a level below that of its inception in the early 1950s. This counter-intuitive finding helps to shed some light on the persistence of the EU's federal blindness.
In association with explanations derived from theories of endogenous institutional change, this research helps explain the limited shift of the EU away from federal blindness. It predicts that while the last two enlargement waves have further emphasized the paradox of the EU's federal short-sightedness, they have also meant that further institutional reform is unlikely. Since endogenous pressures for change linked to the regionalization level of the EU are unlikely to peak beyond levels reached in the 1990s and early 2000s, much will depend on how the reforms pushed through during that climactic period will be implemented. In this respect, inter-institutional relations and interstitial developments will largely affect the newly gained rights of the sub-state level and notably those embodied in the early warning mechanism and in the initiation of infringement proceedings before the ECJ.
The EU's federal blindness
The interaction between the sub-state level and the EU legislative process can be summarized under two headings. The first is paradox. The second is the persisting federal blindness of the EU political system. This section starts by outlining the nature of the sub-state paradox in the EU and maps out the EU's federal blindness and its gradual but limited departure from it. Finally, it details two sources of endogenous pressure, which one would have expected to provoke greater change than that observed.
Why should we care? The sub-state paradox in the EU
The paradox that the sub-state level represents in the EU is easy to grasp. It stems from the fact that, according the Commission, ‘about three quarters of EU legislation is implemented at local or regional level’.Footnote 2 Further, ‘the European Commission considers that, on average, somewhere between 70% and 80% of Community programmes are managed by local or regional authorities in the Member States’ (Committee on Constitutional Affairs, 2002: 24, emphasis added). However, if territorial authorities are deeply involved at one end of the EU policy process – implementation – they lack leverage at other stages of this same process and more particularly at the decision-taking phase.
This was stressed by a number of EU institutions and bodies such as the Committee of the Regions (CoR), but also the EP. The latter's Constitutional Affairs reportFootnote 3 spells out in unambiguous terms that ‘the problems of transposing Community legislation are of concern not only to central government but also to the regional authorities. However, as the European Commission is not officially aware of the latter's existence, the number of problems involving the conception, application or transposition of Community law has recently increased’ (Committee on Constitutional Affairs, 2002: 24). The detrimental impact of the EU's federal blindness has since been further highlighted by research on member state compliance with EU law. Consistent with the EP Committee's claim, a variety of studies have underlined the negative relationship between regionalism/federalism and different dimensions of transposition and implementation (Mbaye, Reference Mbaye2001; Jensen, Reference Jensen2007; König and Luetgert, Reference König and Luetgert2009; Steunenberg and Toshkov, Reference Steunenberg and Toshkov2009; Borghetto and Franchino, Reference Borghetto and Franchino2010).
These concerns are all the more understandable when one considers the increasing overlap between the competences sent upwards by member states to the supranational level and those devolved downwards by these same member states to the sub-state level (Jeffery, Reference Jeffery1997a; Bourne, Reference Bourne2003). Estimates of the overlap vary but generally range between 50% and 80% (see, e.g. Scottish Executive and CoSLA, 2002: 15). The paradox hence becomes double: not only do territorial authorities have to implement the vast majority of Community legislation and programmes in which they have hardly been involved, but their own competences are additionally encroached upon by that which member states have also devolved to the EU. Thus, regional governments have to implement decisions they have not taken themselves while the authority of the EU supersedes their ownFootnote 4 on a vast number of issues over which they are domestically and – more crucially perhaps – electorally supposed to have competence. Hence, the EU's federal blindness affects both output legitimacy (cf. compliance) and its obverse, input legitimacy (cf. lack of input by elected territorial authorities).Footnote 5
Beyond this democratic paradox and interrelated compliance problem (Scharpf, Reference Scharpf1999), the exclusion of territorial governments from the EU decision-making process is even more striking when one compares some of these territorial entities with some EU member states. Indeed, small member states such as Denmark, Finland, or Ireland have less demographic, geographic, and economic weight than some EU regions while comparison itself becomes difficult when one considers ‘micro’ states such as Luxembourg, Malta, or Cyprus. The last two EU enlargement waves have further increased the saliency of this sub-state paradox. As the 2002 EP report highlighted, the
forthcoming [2004] enlargement of the Union to include many small countries may raise political difficulties for large regions in the existing Member States. This is because it will create a situation in which entities with a few thousand inhabitants are entitled to be represented as such in the Union, each one having a minister and a right to vote in every formation of the Council, one Commissioner, a quota of Commission staff, and members of the European Parliament, as well as having its language recognised as an official language of Europe, whereas historic regions with several million inhabitants, which make a major contribution to the economic dynamism of the Union and to the funding of its budget would still be unrecognised by the European treaties (Committee on Constitutional Affairs, 2002: 24).
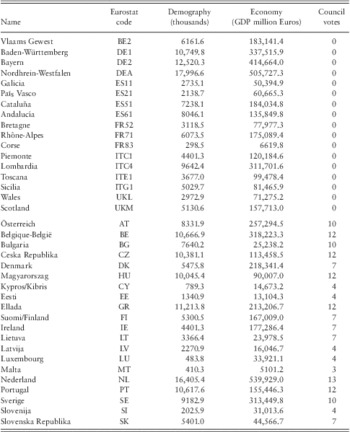
To illustrate the EP Committee on Constitutional Affair's official claim, Table 1 below lists some ‘historic regions’ and some small and micro states as well as basic data on three variables: population (Eurostat), economic weight (Gross Domestic Product – GDP, Eurostat), and the number of Council votes that each territorial entity has.
Demographic, economic, and formal weight of some ‘historic regions’, and small/micro member states

GDP = gross domestic product.
This table displays the paradox the 2002 EP report highlights: that in a political system where the demographic weight of member states is one of the main determinants of their level of representation and hence influence over outcomes (Hosli, Reference Hosli2000), historical territories, some with fully fledged governmental structures, have an institutional representation inferior to that of micro states whose demographic and economic weight often corresponds to less than 10% of theirs.
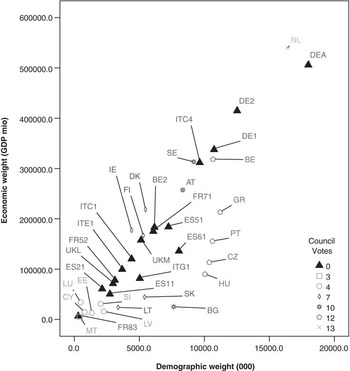
The discrepancy between these regional governments and small/micro member states is even more striking when plotted together. If the territorial authorities listed in Table 1 were to achieve full statehood within the EU, a small region such as Corsica could expect as many as three Council votes (Malta), while North Rhine-Westphalia should at the very least benefit from equal institutional power to that of the Netherlands. Similarly, Baden-Württemberg and Bavaria should logically receive about 10 Council votes, in line with countries such as Greece or the Czech Republic, despite dwarfing them economically. Likewise, Lombardy perfectly matches Sweden on both demographic and economic variables, while regions such as Sicily, Piemonte, Scotland, Flanders, Rhône-Alpes, Catalonia, or Andalusia could comfortably claim equal treatment to Denmark, Finland, Ireland, or Slovakia (Figure 1).
Demographic, economic, and formal weight of some ‘historic regions’, and small/micro member states. GDP = gross domestic product.

The involvement of territorial authorities in the implementation of over three quarters of EU legislation and programmes, and the similarly high overlap between the competences of these authorities and that of the EU not only create a democratic conundrum domestically, but also supra-nationally when one considers the striking imbalance between small state leverage on the EU policy process and that of large regional authorities. Not only do EU decisions dictate the activities of democratically elected territorial levels of government, they are also formally hermetic to any kind of authoritative input they could have. Indeed, the EU is, by design, blind to the sub-state level.
Mapping change: from Parisian blindness to Lisboan short-sightedness
This institutionalized lack of recognition of the sub-state level prompted some early observers to coin a new term to describe it: Landesblindheit. This term originates from Hans Peter Ipsen who sought to describe the Community's blindness to the status and role of the German Länder in the early days of the integration process (Ipsen, Reference Ipsen1966). It has since been expanded to describe the lack of recognition of regional governments by the EU political system. For example, when analysing a dispute between the Commission and the Land of Saxony, George describes à la Ipsen – though without referring to him – the EU's ‘structural bias whereby different sets of institutional arrangements legitimize and empower different sets of actors’. Examining the Commission and Saxony's conflict over state aid to Volkswagen, he highlights how ‘the Commission is blind to the role of the Länder in the German system of state aids. This blindness results in bitterness, because what the German actors consider to be proper behaviour is not followed by the Commission. It also leads to problems such as the German federal government being taken to the court by the Commission over an action by a Land which the federal government had neither been involved in nor approved’ (Reference George2004: 118). This sub-state blindness has been a constant throughout the integration process despite both the nature of the EU and that of its member states changing over time.
Indeed, the EU has massively deepened and widened since its creation in the 1950s but its constitutional blindness towards the sub-state level has evolved in a much less dramatic manner. Successive treaty revisions have gradually acknowledged the existence of such a level of government as well as its growing importance in various policy domains. But recognition has remained limited and formal power and influence even more so. If one were to characterize change, the shift has been from complete federal blindness since the ratification of the Treaty establishing the ECSC in Paris in 1952 to mere short-sightedness since the ratification of the Lisbon Treaty in 2009. As summarized in Box 1, a number of (uneven) steps towards such an outcome were taken in between. These concern the creation and gradual enlargement of the consultative powers of the CoR as well as the evolution of its relations with some of the EU's institutions. Others concern the involvement of some regional governments at various stages of the policy process, from participation in Council negotiations to the implementation of the partnership principle in structural funds programmes.
From Parisian blindness to Lisboan short-sightedness
1960:
9 May, the European Parliamentary Assembly (the EP's predecessor) sets up a consultative committee on regional economies.
1988:
24 June, in the wake of the Single European Act (1986), which stressed the importance of regional development for the single market, the European Commission set up the Consultative Council of Regional and Local Authorities.
June–December, reform of the Structural Funds through a series of regulations adopted by the Council establishing the ‘concentration’, ‘programming’, ‘additionality’, ‘co-financing’, and ‘partnership’ principles.
1991:
9–10 December, during the intergovernmental conference negotiations, the European Council takes the decision to establish the CoR.
1992:
7 February, the signature of the Maastricht Treaty officially establishes the CoR and its article 198c requires the Council or the Commission to consult the CoR in five policy areas: economic and social cohesion; public health; trans-European networks in the fields of transport, energy, and telecommunications; education and youth; culture.
Article 203 allows member states to include and/or be represented by regional ministers in Council negotiations. The subsidiarity principle also introduced in the Treaty does not, however, refer to the sub-state level.
1997:
2 October, the Amsterdam Treaty adds five areas where the Council or the Commission must consult the CoR: employment policy; social policy; environment; vocational training; transport. It also allows the EP to consult the CoR through article 265.
2001:
20 September, ‘Protocol of Cooperation’ signed between the Commission and the CoR.
2002:
13–4 March, during the Convention on the future of Europe, the EP uses for the first time its right (already granted in Amsterdam) to officially consult the CoR.
2003:
18 July, the Convention on the Future of Europe's draft Treaty fulfils a number of longstanding CoR demands, including a more detailed definition of the principle of subsidiarity and the right for the CoR to trigger proceedings at the ECJ on the basis of a breach of subsidiarity.
2004:
29 October, the Treaty establishing a Constitution for Europe is signed by the EU's heads of state and government in Rome. In line with the Convention, it boosts the institutional status and political role of the CoR. It is never ratified.
2005:
17 November, Cooperation agreement between the European Commission and the CoR.
2007:
13 December, the Treaty of Lisbon is signed. It contains many of the reforms included in the Convention's constitutional treaty.
5 June, Addendum to the Protocol on the Cooperation arrangements between the CoR and the Commission.
2009:
1 December, the Lisbon Treaty enters into force.
Much academic work has analysed and commented on these developments. More optimistic work focusses on the potential of these changes and the way in which they depart from the status quo ante. Others, with more scepticism (Hogenauer, Reference Hogenauer2008), specify their limits and outline a number of important caveats (for an overview see, among others, Hooghe and Marks, Reference Hooghe and Marks2001; Keating and Hooghe, Reference Keating and Hooghe2006). However, one fact is beyond doubt: the EU has gradually shifted away from complete blindness towards a greater recognition and involvement of the sub-state level through a variety of compulsory and optional measures. This shift has been uneven and irregular but unidirectional. Even if departure from federal blindness has been limited, it has nonetheless been clear and incontestable.
In many ways, the implementation of the Lisbon Treaty represents the most important step in that direction since the Maastricht Treaty established the CoR, article 203, and the subsidiarity principle. Lisbon implemented seven important changes. The first is that the treaty specifies that the Commission is obliged to consult with local and regional authorities as early as possible in the legislative process. The second is that compulsory consultation consequentially increases the weight of the CoR during the pre-legislative phase. The third is that, yet again, the policy areas in which CoR consultation is compulsory have been extended, adding civil protection, climate change, energy, and services of general interest to the list. The fourth is that the CoR's involvement has been extended beyond the issuing of an opinion on a Commission proposal. It is now also obligatory for the EP to consult the CoR. This gives the CoR an opportunity to comment on any changes made by Members of the European Parliament (MEP). The CoR now also has the right to question the Commission, the EP, and the Council if they fail to demonstrate consideration of its opinion and it can also call for a second consultation if the initial proposal is substantially modified during its passing through the other institutions. Hence, Lisbon constrains the EU's main three institutions to greater and more prolonged interaction with the CoR throughout the decision-taking process.
The fifth area of change concerns a remarkable departure from past practices in the definition of subsidiarity. The Treaty, for the first time, makes specific reference to local and regional governments – and therefore the principle of territorial self-government – in its specification of subsidiarity.Footnote 6 Beyond such detailed specification of the subsidiarity principle all the way down to its regional and local levels, the Lisbon Treaty also breaks new ground by introducing a sixth important change: the ‘early warning mechanism’.Footnote 7 Through such a mechanism, not only the CoR but also national and a number of regional parliaments have 8 weeks to check compliance with the newly defined subsidiarity principle. Such a monitoring mechanism allows legislation proposed by the Commission to be scrutinized by these actors before the legislative process can move on. This mechanism has a clear impact for the sub-state level in that, beyond the CoR itself, 7 out of 13 member state upper chambers represent regional and local authorities. Additionally, in member states where regional parliaments have legislative powers, national parliaments will consult these bodies.Footnote 8
The seventh change is perhaps the most striking. The CoR can now bring legal actions before the ECJ in two specific instances: to protect its mandatory consultative powers and to annul EU legislation which impinges upon regional and local competences and therefore violates subsidiarity. This gives the CoR some legal clout. Hence, whether it believes that it has not been correctly consulted by the Commission, the EP, or the Council, or that EU legislation breaches subsidiarity by violating regional or local competences, the CoR can now initiate infringement proceedings at the ECJ.Footnote 9 Having requested this right for 15 years, the CoR decided, just days after the new EU Treaty came into force, that it will refer EU laws which infringe the subsidiarity principle to the ECJ by a simple majority vote, thereby reducing the likelihood of internal gridlock. In this way, from Paris to Lisbon, the EU has manifestly travelled some distance away from Ipsen's original characterization.
Though one should not belittle the observed magnitude of change, one should also keep it in perspective compared with the evolution of other EU institutions and particularly the EP. While the EP originates from similarly humble beginnings, as a nominated consultative assembly, its trajectory is incomparable to that of the CoR as, despite changes implemented through the Lisbon Treaty, the CoR falls well short of the power and influence currently wielded by the EP. While the departure from the status quo is significant, the EP's yardstick highlights that it remains limited.
Endogenous pressures, transaction costs, and actor preferences: the puzzle of ‘limited’ institutional change
Despite representing a clear departure from the status quo ante, the overall limits of institutional change are surprising (Hogenauer, Reference Hogenauer2008: 554; Mandrino, Reference Mandrino2008: 533). How can the EU's ‘federal myopia’, to coin a new term, have been so persistent as to still constitute the dominant feature of the EU's legislative process? Indeed, one could have anticipated that, as ‘European’ policy gradually became ‘domestic’ policy (Jeffery, Reference Jeffery1997a: 215–218) and as more and more countries decentralized powers across territorial levels, the EU would have adapted its institutional structures to grant some formal authority to its most potent regional governments. This hope has, in the main, been disappointed. Building on institutional apathy and on the path dependence of organizational designs (Pierson, Reference Pierson2000), a double answer can be formulated to explain the persistence of this federal blindness.
The first is that the European project was initially closer to an international organization than the fully fledged polity it has now become by funnelling its components into an ‘ever closer union’. As some authors have commented, ‘remarkably, a treaty-based international organization has been transformed into a quasi-federal polity based on a set of treaties that are a constitution in all but name’ (Capoccia and Kelemen, Reference Capoccia and Kelemen2007: 365). This development suggests that territorial governments may initially have had little interest in the European project and certainly had few claims for involvement in an integration process that resembled classical regional integration and concerned only a few policy areas. Their mobilization lacking during the Community's infancy – its constitutive phase – territorial governments would have missed the train of supranational recognition for good. Subsequent opportunities in the form of treaty revisions demonstrated that, the initial train missed, it was difficult to jump on subsequent wagons. All the more so as member states lack any real incentive to share power in an area where many authors argue they have managed to successfully isolate themselves from domestic constraints (Putnam, Reference Putnam1988; Milward, Reference Milward1992; Keating and Hooghe, Reference Keating and Hooghe2006: 272) to both free their policy hands and indulge in electorally beneficial games of credit claiming and blame avoidance. In this sense, member state preferences coupled with institutional ‘stickiness’ would account for the persistence of the EU's federal blindness.
The second is that, in the early days of European integration, the sub-state level was far less developed than it is today. Germany apart, the sub-state level was mostly weak and fragmented. Belgium was still a unitary country, Italy was not yet regionalized or only very asymmetrically soFootnote 10 while Luxembourg, the Netherlands, and France were, and still are, unitary. However, since the 1950s most European states have decentralized or at least ‘deconcentrated’ some competences to the sub-state level. Belgium went all the way, becoming a federal state, Italy has gradually implemented its constitutional regionalism, Spain has generously granted café para todos in the form of successive statutes of autonomy to its various territorial communities, France has unleashed two decentralization waves culminating in the constitutional recognition of its decentralized nature (2003) while the United Kingdom has devolved vast powers to three of its four nations. Hence, one could expect that, as a result of the increasing regionalization of its member states, the EU would become more sensitive to the sub-state level despite its originally low saliency.
While both integration and regionalization levels explain the EU's original federal blindness, they also make the current limited nature of its reforms puzzling. The combined effects of deeper integration and greater regionalization should, theoretically, have triggered greater institutional change. This argument is based on both assumed actor preferences and on the logic of endogenous pressures for change. The preferences of these domestically empowered territorial governments would be for greater involvement (Marks et al., Reference Marks, Nielsen, Ray and Salk1996: 170; Hocking, Reference Hocking1997: 105) and they would exert escalating pressure for change (as a function of regionalization and EU deepening) both directly on the European scene and on their member states. Indeed, theories of endogenous institutional change stress the role played by ‘implementing/affected actors’ vis-à-vis ‘designing actors’ to account for institutional change (Héritier, Reference Héritier2007: 51). As Héritier specifies, one can shed some light on the dynamics triggering institutional change through a
structural perspective [which] relates to the types of actors involved in the rule-making: which actors are ‘designing actors’, that is formally responsible for the adoption of an institutional rule; and which actors are ‘implementing actors’ (or affected actors), that is charged with and affected by the daily application of the institutional rule? Institutional rules are the result of a process of collective choice of the designing actors, that impose their rules on the implementing actors (and affected actors) (…). A discrepancy between the designing actors of an institutional rule and its distributive implications and the implementing actors (and those affected by the rule in society at large) may constitute an important source of institutional change (2007: 9, emphasis original).
Hence, the concomitant deepening of the EU and the regionalization of its member states would create a discrepancy between designing actors (the member states) and implementing actors (territorial authorities), the latter having witnessed their policy competences increasingly encroached upon by European integration (Bourne, Reference Bourne2003, Reference Bourne2004).
Empowered territorial governments could then exert pressures for change through a variety of mechanisms, including linked-arena bargaining. Even in the absence of formal powers in one arena, a player may be able to provoke institutional change through its formal powers in another arena. This logic can be applied to the interaction between the above-mentioned implementing and designing actors in that ‘actor A, using a formal veto in one arena X, can create a leverage in another linked arena Y in which actor A has no formal vote’ (Héritier, Reference Héritier2007: 54). Such an endogenous theory of institutional change based on actor type (implementing vs. designing) and linked-arena mechanisms makes the ‘limitedness’ of the observed institutional change all the more puzzling in that some change has occurred, but it has remained limited.
One cause of lack of change despite endogenous pressures can usually be found in transaction costs. When too high, they hinder change. However, considering that change has indeed occurred – implying that the costly steps of intergovernmental conferences, treaty negotiation, and ratification have been taken – the transaction costs linked to agreement over a new or amended institutional set-up have been paid. These are proportionally greater as the outcome departs further from the status quo. However, the threshold price of engaging in institutional change (be it to tinker and tweak or to dramatically reform, terminate, or create) having been paid, transaction costs alone cannot account for the limitedness of the observed change. Changing much is more costly than changing little, but if the pressure for change is sufficiently strong, not changing enough is, in fine, more costly than changing much or preserving the status quo.
Finally, assumed actor preferences are equally unhelpful in accounting for the persistence of the EU's federal myopia. While territorial governments should have a preference for greater recognition and involvement due to their regionalization and the EU's deepening (e.g. Bursens and Deforche, Reference Bursens and Deforche2008), the member states, due to the possibility of arena-linking, might be constrained to endorse change despite contrary initial preferences (Farrell and Héritier, Reference Farrell and Héritier2007: 409). Having dispersed power at the European level in the first place and subsequently in greater measures still to the EP, the ECB, and the ECJ, it is difficult to pinpoint why more powers should not be dispersed to other actors on the EU scene, namely the CoR and territorial governments, considering that these same member states are also devolving powers to territorial governments domestically. Equally, in terms of the perceived legitimacy of the European project, EU member states and institutions would certainly not harm their democratic credentials by better including ‘grassroots’ territorial governments. Brussels rhetoric has argued that such a move would enhance the ‘quality’ of governance and lead to ‘better’ regulation, thereby improving output legitimacy and leading to overall gains in both democracy and efficiency (Scharpf, Reference Scharpf1999; European Commission, 2001).
While the initially (1) low level of integration and (2) weakness of the sub-state level across Europe go some way to providing an explanation for the original federal blindness of the EU, these two developments (deepening and regionalization) should also lead us to expect this same federal blindness to not survive long. Despite an inevitable time lag necessary for these changes to trigger an institutional response at the supranational level, it is puzzling that only limited change has occurred. As prime implementers of its policies, increasing deepening should eventually foster greater sub-state involvement in EU affairs, while the aggregate level of decentralization across the EU should be high enough for territorial governments to pressure their central governments and EU institutions for greater collective recognition at the supranational level. A reason for the lack of greater change, however, might lie in the (in)validity of the assumed monotonicity of the EU's deepening and regionalization. Since these two sources of pressure for endogenous change have not triggered the expected outcome, it is tempting to further prod and explore their empirical reality.
Sources of endogenous pressure for change
This section seeks to assess the empirical reality of two widespread assumptions about the EU polity. The first is that deepening has been, overall, unidirectional. The second is that the EU's member states, and therefore the EU as a whole, have monotonically regionalized over time. If the first assumption underlying the deepening part of the endogenous diptych is easy to verify, the second assumption is trickier to assess.
The deepening assumption
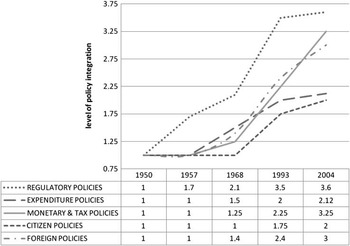
The first expected pressure for change is that the nature of the EU has evolved over time, from an ‘unidentified political object’ (Drake, Reference Drake2000: x), not dissimilar to an international organization, to one which has little in common with the ideal type. Testing for its validity is relatively straightforward: one simply needs to assess to what extent decisions are taken exclusively at the state level or at the supra-state level across policy areas and over time. If the trend toward supra-state decision taking over time and across policy areas is upwards then the deepening assumption would be substantiated. Simon Hix provides some data that, though he claims ‘uses a variety of secondary sources, and is hence not exact science’ (Hix, Reference Hix2005: 19), are precise and reliable enough to test whether deepening has indeed occurred over time and across policy areas. Figure 2 is constructed from Hix's data (Reference Hix2005: 20–21)Footnote 11 where the level of decision taking for individual policy areas is coded on a 4-point scale: 1 indicates that all policy decisions are taken at the state level, 2 that some policy decisions are taken at the EU level, 3 that policy decisions are taken at both state and EU levels, and finally 4 that most policy decisions are taken at the EU level. The temporal points correspond to various integration steps, 1950 being before any treaties, 1957 corresponding to the EEC Treaty, 1968 to the Merger Treaty, 1993 to the Maastricht Treaty, and 2004 being the last point in time after the Nice Treaty.
35 policy area scores aggregated for five policy sectors. Source: Hix (Reference Hix2005), author's calculations.

In this graph, 35 policy area scores are aggregated and averaged in five broad policy sectors. The graph confirms that the trend is deepening, in the sense that an increasing number of decisions in an increasing number of policy areas are gradually being taken at the supra-state level rather than at the state level exclusively. It also confirms that European integration is a highly differentiated process with some policy areas integrating quicker and further while others lag behind or remain stagnant. For instance, regulatory policies are clearly an area where integration has gone deeper and been quicker. Meanwhile, expenditure policies and citizen policies (with an average close to 2) remain areas where only some policy decisions are taken at the EU level. Averaging around ‘3’, foreign policies and monetary and tax policies are in an intermediate position with policy decisions taken at both the state and the central level.
The regionalization assumption
For the regionalization explanation to be operational, its level needs to have increased both over time and across countries. General impressions validate this assumption. As indicated earlier, Belgium, France, Italy, Spain, and the United Kingdom have all devolved large amounts of competences to the sub-state level while many unitary-centralized countries have decentralized or at least ‘deconcentrated’ some power to various territorial levels. To check the accuracy of this impression one needs to plot the level of sub-state autonomy across countries and over time to assess whether indeed such a trend occurs. The literature on federalism and territorial politics abounds with indicators and typologies, which have unfortunately tended to lack conceptual rigour, operational transparency, and replicability (for an overview see Tatham, Reference Tatham2008: 65–67). Though some more recent indicators are impressive in their precision and scope (Lane and Ersson, Reference Lane and Ersson1999; Arzaghi and Henderson, Reference Arzaghi and Henderson2005; Bracanti, Reference Bracanti2006), the Regional Authority Index (RAI) compiled by Hooghe et al. stands out as the most serious, encompassing and up-to-date indicator currently available (Reference Hooghe, Marks and Schakel2010).Footnote 12
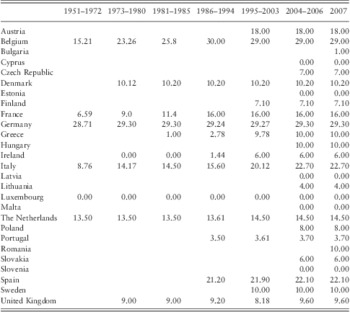
The RAI is therefore used to test the assumption that the level of regionalizationFootnote 13 has increased both over time and across countries in the EU. For this test, the country scores were averaged for each time period between each enlargement phase, so as to represent the country's average level of regional authority during each period of EU-membership stability. Obviously, only the country scores during membership are of interest. They are summarized in Table 2.
RAI member state scores averaged per time period

RAI = regional authority index.
Source: Hooghe et al. (Reference Hooghe, Marks and Schakel2010), author's calculations.
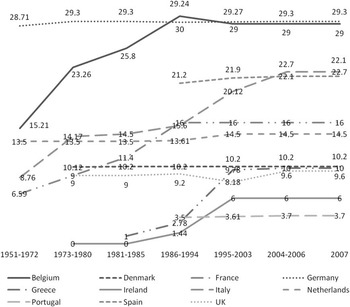
Two clear findings emerge from Table 2. The first is that many countries are time-invariant in their levels of regional authority. These time-invariant countries can be categorized in two sub-groups: those which have devolved no regional authority at all and those for which regional authority has been devolved but has not changed during the course of EU membership. Cyprus, Estonia, Latvia, Luxembourg, Malta, and Slovenia fall into this first group while Austria, Bulgaria, the Czech Republic, Finland, Hungary, Lithuania, Poland, Romania, Slovakia, and Sweden fall into the second group. The second finding is that there seems to be a trend towards greater levels of decentralization across countries with time-variant scores. For clarity's sake, these time-variant countries have been additionally represented in Figure 3. This graph illustrates that when there is variation it is towards greater territorial authority.
Non-stationary RAI member state scores.

This evidence seems to confirm the assumption that the EU has seen its member states devolve more and more powers and competences to the sub-state level. In their present form, these data are, however, a misleading indicator of the EU's aggregate level of regional authority. Indeed, it is only if time-variant countries devolve more powers to the sub-state level, all else being equal, that the assumption of the increasing regionalization of the EU holds. However, in the case of the EU the ceteris paribus clause is clearly violated.Footnote 14 The EU has evolved: its membership increased from 6 to 27 member states and these 21 new entrants include both time-variant and time-invariant countries. Hence, the trend in individual regional authority is not a reliable indicator of the EU's aggregate regionalization level over time.
To evaluate the veracity of the regionalization assumption within the EU, one needs to calculate an EU regional authority score. However, a simple addition of the country scores will not do: countries are not identical and Malta's score, for example, cannot be treated in the same way as Germany's. Country scores hence need to be weighted to reflect differences between countries within the EU. Since the purpose of the article is to explore and explain limited EU institutional change, rather than weighing country scores by population, geographical size, or GDP, I decided to weigh them by a measure of their institutional leverage within the EU political systems. Many indicators come to mind, ranging from the Banzhaf to the Shapley–Shubik power indices (Leech, Reference Leech1990, Reference Leech2002b). The validity and reliability of these indices have, however, been seriously questioned (Steunenberg et al., Reference Steunenberg, Schmidtchen and Koboldt1999: 343–346; Gelman et al., Reference Gelman, Katz and Bafumi2004). Considering their polemical nature, and that ‘the weights laid down by the Nice Treaty are approximately proportional to the voting power they represent’ (Leech, Reference Leech2002a: 459–460), it is less contentious to simply use Council voting weights as a proxy for member states’ formal power in the EU decision-taking process.
The proposed formula is a simple one. To calculate an aggregate regionalization level for the EU, RAI scores were averaged out for each country i for each time period z, as displayed in Table 2. These
 $$)(--><$>{{\overline{{{\rm{RAI}}}} }_{iz}}<$><!--$$
scores were then individually multiplied by their country's voting weight CV
i
for each time period z, hence reflecting shifts in voting weight distribution over time. For each time period z all weighted country scores were summed and divided by the total number of Council votes for the period. The formula is summarized in equation (1).
 $${\rm{EURA}}{{{\rm{I}}}_z}\, = \,\frac{{\mathop{\sum}\limits_{i\, = \,{\rm{1}}}^I {({{{\overline{{{\rm{RAI}}}} }}_{iz}}\,\times \,{\rm{C}}{{{\rm{V}}}_{iz}})} }}{{\mathop{\sum}\limits_{i\, = \,{\rm{1}}}^I {{\rm{C}}{{{\rm{V}}}_{iz}}} }}$$
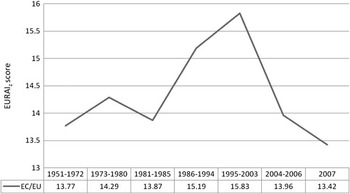
The final EURAI z score measures the EU's aggregate regional authority for each time period z taking into account the differential weight of each country consequent to successive enlargements and voting weight readjustments. These new data are represented in Figure 4.
European Union regionalization level (EURAI z ).

This graph suggests a very different trend than Figure 3 did. While Figure 3 suggested an increase in the regionalization level of the EU, over time and across countries, these data clearly demonstrate this is not the case. Indeed, the upwards trend of the time-variant countries is initially depressed and later even reversed by the inclusion – through successive enlargement waves – of time-invariant but weakly regionalized member states. The original level of regionalization of 13.77 increased to 14.29 in 1973 despite the accession of the United Kingdom, Ireland, and Denmark, but thanks to the recalculation of Council votes which gave greater weight to a federalizing Belgium, to the already-federal Germany, and to a regionalizing Italy. Hence, despite the accession of countries with a RAI score well below that of the EU average, the European polity nonetheless saw its aggregate score increase. It decreased back to its initial level, however, with the entrance of highly centralized Greece while all other voting weights remained constant. However, in 1986, while voting weights remained unchanged for old member states, the accession of highly regionalized Spain (with eight Council votes) as well as the continuing federalization of Belgium, the decentralization of France and the regionalization of Italy all contributed to raise the EU average to 15.19. This average further peaked at 15.83 in 1995 as voting rights remained unchanged for old member states while federal Austria joined the European project, Italy regionalized still further and Ireland and Greece also started to slightly raise their regional authority levels.
This upwards trend came to a sudden halt in 2004. Since then, all accession states have held RAI scores lower than the EU average and hence dragged its aggregate level of regionalization down. The EU aggregate score has plummeted to such an extent that it is now even lower than at its creation when Germany was the only federal state present. Germany is still there and federal, alongside Austria, Belgium, Italy, Spain, and relatively decentralized France and the Netherlands, but it is also surrounded by a plethora of countries, which have devolved very little power to the sub-state level. Paradoxically, if enlargement has in some ways increased the saliency of the federal myopia of the EU by granting full participation rights to small countries which are sometimes equal in size and sometimes substantively smaller than many regions, enlargement has also rendered the sub-state question far less pressing by decreasing the average level of regional authority. As a result of enlargement, the sub-state paradox is both more prominent and more marginal in the EU of today.
These findings indicate that one should reject the assumption that the level of regionalization has increased both over time and across countries in the EU. While this is true of individual member states – which have either remained time-invariant or have increased their levels of regional authority – it is not true concerning the EU understood as a weighted average of its growing number of member states. Though the EU became more regionalized from 1986 to 2003, it has become far less regionalized since 2004 and has seen its lowest level ever since 2007.
One out of two ain't enough
Though the deepening assumption was validated, the regionalization assumption has to be rejected and hence provides at least some explanation for the persistence of the EU's federal myopia. There has been no linear, unidirectional regionalization of the EU. On the contrary, it has even been decreasing since 2004, reaching its lowest level in history with the accession of Bulgaria and Romania. In this light, it is perhaps not surprising that most reforms giving territorial governments a greater say in various aspects of EU politics and policies were drafted or implemented between 1986 and 2003 – when the EURAI z was at its all-time high. The reform of the Structural Funds and the concomitant setting up of the Consultative Council of Regional and Local Authorities (1988) by the Commission, the Maastricht Treaty (CoR creation, subsidiarity principle, article 203), the Amsterdam Treaty (five new policy areas for the CoR), and the Treaty establishing a Constitution for Europe (extension of the subsidiarity principle, greater compulsory CoR consultation, ECJ infringement proceedings by the CoR) all occurred during this period. Hence, the EURAI z measure helps to better understand the timing of these institutional reforms and gives credit to theories of endogenous pressure for change. It was when the EURAI z peaked that most changes were either initiated or implemented.
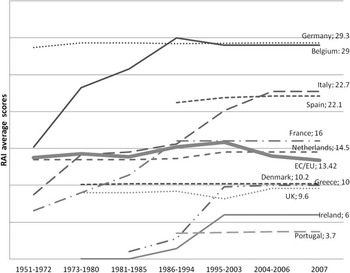
As stated earlier, however, although these reforms represent a visible point of departure from past practices and institutional set-ups, they remain, in fine, rather limited. Such limitedness can be put down to a number of factors,Footnote 15 which surely include the faltering level of aggregate regional authority in the EU. Another explanation is that, beyond its fluctuation, this aggregate score remained rather low overall. If one plots the EURAI z score alongside that of its time-variant member states, it comes across as relatively low. As Figure 5 indicates, the EU score (fat line) peaked at a level close to that of decentralized France and is currently situated between that of the Netherlands (14.5) and Denmark (10.2). If the EU, understood as a weighted average of its member states, is as regionalized as Denmark or the Netherlands, then it is maybe not that puzzling that its decision-taking procedures have remained rather federal-myopic despite various waves of regionalization throughout Europe and deepening integration. In other words, not only did pressure for change (as a function of regionalization) rise and fall, it was also less pronounced than anticipated.
RAI-variant member states and EURAI z .

It is then rather unsurprising that many of the more powerful European regions have changed strategy. Rather than trying to achieve institutional change at the EU level directly, they have shifted towards pressuring their central governments for domestic change instead. In this sense, regional governments in Germany, Austria, Belgium, the United Kingdom, but also Spain and Italy have focussed much of their effort on remedying the EU's federal myopia through domestic rather than supranational solutions (Jeffery, Reference Jeffery2007b; Michelmann, Reference Michelmann2009). Hence, as linked-arena strategies proved unsuccessful, regional actors concentrated on the arena in which they were most powerful: the domestic one. As Jeffery points out, ‘while regional governments set out 20 years ago with a transformative project designed to challenge the centrality of the member state in the EU, legislative regions have in the last few years come to endorse, even buttress the centrality of the member state’ (Jeffery, Reference Jeffery2007a: 1).
It is hardly coincidental that this shift intensified as EURAI z dipped. Faced with the difficulty of achieving formal recognition and decision-taking participation rights at the EU level, stronger regional governments have preferred to channel pressure for change towards the more malleable and less remote central government level. This change of strategy through a change of arena in which regionalization pressures are exerted is congruent with arguments put forth by theorists of endogenous institutional change. Héritier indeed indicates that ‘given a choice between different levels/arenas of decision-making, an actor, by opting out of one arena and shifting the decision to another, may improve his prospects of obtaining an institutional change according to his preferences’ (Reference Héritier2007: 30). While institutional change was hoped for directly at the EU level, it was better accomplished by a number of regional governments at the national level (Jeffery, Reference Jeffery2007a; Moore and Eppler, Reference Moore and Eppler2008; Tatham, Reference Tatham2011).Footnote 16
Conclusions
This article set out to shed some light on both the origins and the persistence of the EU's federal blindness. This blindness – identified by Ipsen in the 1960s – has been remarkably persistent over time to the extent that it has not only been denounced by territorial governments themselves but also by EU institutional players such as the EP and the Commission, which have criticized the efficiency, legitimacy, and democratic deficits it causes (European Commission, 2001; Committee on Constitutional Affairs, 2002). Two factors have been put forward as both an explanation for the original institutionalization of such blindness and a source for change over time. The first concerned the deepening process and the second the regionalization of the EU's member states. Both were assumed to be initially low and to have increased over time, thus triggering endogenous pressures for change in the form of a widening discrepancy between designing and implementing actors and the possibility of inter-arena linkages. Hence the pressures produced by the EU's deepening and regionalization would explain institutional change towards greater recognition and involvement of the sub-state level in the EU decision taking.
Though such change has taken place, culminating with proposals set out in the Treaty establishing a Constitution for Europe (2004) and finally implemented through the Lisbon Treaty (2009), it has remained surprisingly limited. To extend the metaphor, while the EU is no longer federally blind, it remains largely short-sighted: it is finally able to see below the member state level, but such a vision is still rather weak, if not myopic. The CoR has not become a fully fledged institution and is certainly not on an equal footing with the EP or the Council. Its consultative powers have been significantly extended but nonetheless remain consultative. Meanwhile, both the use and effect of its newest tool, that of bringing cases before the ECJ, very much depend on actor constellations within and strategic interactions between institutions. In this light, change has been much more limited than the deepening and regionalization pressures have led us to expect.
Exploring the empirical reality of deepening and regionalization further, this research has discovered that, contrary to expectations, the EU's aggregate regionalization score has significantly dropped since 2004 to a level that is now lower than at its inception, when it only included one federal state. This counter-intuitive finding is important, as the assumption that the EU has become more regionalized is commonly made but had never been rigorously tested before. Furthermore, it provides an explanation as to why institutional change gained most momentum between 1986 and 2003, when regionalization pressures were strongest. Also, it helps explain why many of the more powerful regional governments have pursued the complementary strategy of institutional change at the domestic level too since, even at its peak, the EU's regionalization level was not as high as imagined. Finally, these findings suggest that regionalization pressures are unlikely to provoke further institutional change. Having dipped to a historic low, they are unlikely to soon again reach a level high enough to trigger further reforms. Indeed, the possible accession of Croatia, Turkey, the Former Yugoslav Republic of Macedonia, or Iceland – which all have RAI scores well below that of the EU average – would further accentuate the current downwards trend.
If deepening and regionalization have provoked limited institutional change away from complete federal blindness towards mere myopia, further sources of change in this direction will have to come from elsewhere. Much will now depend on how the new procedures ratified through the Lisbon Treaty are utilized and more particularly the early warning mechanism and ECJ infringement proceedings.Footnote 17 In this sense, strategic interactions between the EU's institutions and the CoR as well as interstitial developments (Farrell and Héritier, Reference Farrell and Héritier2007) are likely to be the main source of future institutional change away from the EU's federal short-sightedness.
Acknowledgements
The author would like to thank Michael Keating, Charlie Jeffery, Chris Hanretty, Hussein Kassim, Adrienne Héritier, Yvette Peters, Jarle Trondal, Aurélien Raccah, Marta Arretche, the editors, and the three anonymous reviewers for their advice on various aspects of a preliminary version of this paper. The author would also like to acknowledge financial support from the Lavoisier programme (French Ministry of Foreign Affairs) and the SPS Department (European University Institute). Usual disclaimers apply. Any remaining errors are the author's.