


INTRODUCTION
The work performed by public sector employees—which ranges from infrastructure investments (Rogger Reference Rogger2018), to providing public services (Toral Reference Toral2023), to the basic administration and registration of the population (Rasul, Rogger, and Williams Reference Rasul, Rogger and Williams2021)—is critical to basic government functions. Thus, the dynamics of public sector hiring affect the quantity and quality of public services delivered. Who staffs the bureaucracy also matters for descriptive and representative reasons (Kingsley Reference Kingsley1944; Krislov Reference Krislov2012). Understanding who is hired to fill state positions is therefore a first-order policy question that has important governance implications. What biases, if any, are present in public sector hiring? And to the extent that bias exists, what explains it?
Due to the individualized benefits of a public sector job (Finan, Olken, and Pande Reference Finan, Olken and Pande2017), past work highlights political elites’ incentives to distribute positions to preferred recipients such as brokers and clients. Most of this research examines how politicians influence the distribution of government jobs as a form of patronage (Brierley Reference Brierley2021; Geddes Reference Geddes1994; Grindle Reference Grindle2012). However, the literature on patronage generally overlooks the role of the high-ranking bureaucrats who actually oversee and implement the hiring process. These “bureaucratic managers” also have their own incentives to bias public sector hiring (Johnson-Kanu Reference Johnson-Kanu2021; Meyer-Sahling, Schuster, and Mikkelsen Reference Meyer-Sahling, Schuster and Mikkelsen2018; Riano Reference Riano2022), some (but not all) of which may align with those of political elites. We consider the efforts of bureaucratic managers to bias hiring to be bureaucratic favoritism, which we broadly define as the practice of managers granting special favors to help preferred individuals over others.
It can be difficult to empirically distinguish between a hiring bias originating from politicians versus managers. Political patronage hiring may be observationally equivalent to bureaucratic favoritism in hiring if politicians and bureaucratic managers share similar observable preferences. That is, what studies measure as patronage (or bureaucratic favoritism) may actually be the result of a different process and be driven by a different actor altogether. To the extent that research has not empirically validated each process in tandem with the other, claims about the extent of political patronage in the public sector may be overstated relative to—and at the expense of—bureaucratic favoritism.
In this article, we begin from the premise that politicians and bureaucratic managers may have different preferences regarding public sector hiring and different abilities to implement those preferences. We model the hiring process to fill public sector positions as an allocation problem between politicians and managers. We expect bias in favor of both politician preferences and managerial preferences when each actor has some power—stemming from either formal authority or informal leverage—over the hiring process. Our theoretical model thus incorporates both actors’ relative leverage over, and preferences regarding, the types of positions available in the local public sector. We predict that hiring bias manifests in different concentrations and in different parts of the public sector based on each actor’s relative preferences and relative power over the other. In particular, we expect the relatively stronger actor to be able to hire their preferred individuals to their preferred type of positions as well as some of their less preferred positions; the relatively weaker actor, in turn, hires their preferred individuals into the remaining positions.
We study these dynamics across local governments, also known as local authorities (roughly equivalent to a U.S. county), in Kenya—a country with highly ethnicized politics. Local governments in Kenya have long been considered “employment bureaus” (Owolabi Reference Owolabi2011) in which limited revenues are used to hire personnel rather than invest in local public goods or development projects (Menon, Mutero, and Macharia Reference Menon, Mutero and Macharia2008). Each local authority is governed by both politicians elected to the local council and bureaucrats appointed by the central government. The most important of these bureaucrats, and the most integral individual within the locality as a whole, is the “clerk”—a highly trained bureaucratic manager who is formally managed by the Ministry of Local Government to serve as the locality’s chief executive. Local councils and clerks have some degree of leverage over each other: clerks have significant formal authority as they officially oversee the entire hiring process and are largely considered the most important decision-maker in the locality, but local councils have informal weight with the Ministry of Local Government to request a clerk’s transfer if they are displeased with the clerk’s performance.
We examine the interplay between political patronage and bureaucratic favoritism in hiring by analyzing payroll data on the universe of local bureaucrats—from clerks to menial staff, nearly 170,000 person-years in total—in all Kenyan local authorities from 2004 until 2013. We create a panel dataset at the local authority level with this information, which we combine with local-level election results and data on ethnic identity given the high salience of ethnicity in Kenyan politics. The ethnicity of the clerk and of the council majority proxy for their incentives to hire workers from different ethnic groups.
Clerks are not randomly assigned across localities. Local politicians vastly prefer the Ministry of Local Government to assign them a co-ethnic clerk, precisely so as to align hiring incentives, and thus exacerbating the observational equivalence problem discussed above. We use a fixed-effects design that exploits within-local government variation in the clerk’s ethnicity relative to that of the council majority to distinguish the hiring of co-ethnics of the council versus co-ethnics of the clerk as patronage versus bureaucratic favoritism, respectively. Importantly, for our research design, we can identify the revealed preference of the council majority in the absence of a clerk because 37.4% of locality-years are transitioning between clerks, leaving the clerk position temporarily vacant.
We find evidence of both political patronage and bureaucratic favoritism in the distribution of public sector positions, which highlights the problem of studying patronage on its own without simultaneously considering the often overlooked incentives and power of the bureaucratic managers who also control critical elements of the hiring process. To begin, we observe clear evidence of patronage. Ethnic groups that are co-ethnic with the council majority receive about four new hires for every one new hire among groups that are non-co-ethnic with the council majority. There is also clear evidence of bureaucratic favoritism as clerks are similarly able to hire their own co-ethnics: groups co-ethnic with the clerk receive seven new hires for every one new hire among other groups. These findings are robust to a battery of fixed effects. We also find that there is no statistically significant increase in hiring of a clerk’s co-ethnics in periods prior to the clerk’s assignment. The absence of these “leading” effects suggests it is clerk assignment—rather than another omitted factor driving both clerk assignment and co-ethnic hiring, such as over-time changes in local politicians’ power—that causes observed shifts in hiring patterns.
We then examine how patronage and bureaucratic favoritism interact when local politicians and bureaucratic managers have conflicting preferences. Sub-sample analyses reveal that patronage and bureaucratic favoritism are concentrated in different ranks of local governments, suggesting that the allocation problem is resolved through the distribution of different types of jobs to the different actors. In the absence of a clerk, local councils exhibit high levels of co-ethnic patronage hiring across high- and low-level positions. The presence of a non-co-ethnic clerk barely affects councils’ ability to make patronage hires among low-level positions, but it eliminates their ability to make patronage hires to high-level, professional positions. In turn, we find that clerks who are non-co-ethnic with the local council are still able to make co-ethnic hires, mostly concentrated among high-level positions.
We expect our general theory, about the co-existence of patronage and bureaucratic favoritism in contexts where both politicians and managers must coordinate hiring, to hold across numerous contexts. Our model illustrates how the positions over which politicians versus managers focus their favoritism should vary based on institutional context. For instance, in cases where public service jobs wield actual control over the purse and in which local politicians are relatively strong, the model predicts that politicians will focus their patronage hiring on professional positions that allow them to fill party coffers instead of employing foot soldiers (Brierley Reference Brierley2021; Sigman Reference Sigman2022).
The article makes three main contributions. First, while many comparative studies on bureaucracy have focused on frontline service providers (Brierley et al. Reference Brierley, Lowande, Potter and Toral2023; Pepinsky, Pierskalla, and Sacks Reference Pepinsky, Pierskalla and Sacks2017), we join a growing body of work that takes the behavior and incentives of mid-level bureaucratic managers seriously. The management practices these mid-level bureaucrats pursue clearly have direct implications for public service delivery (Rasul and Rogger Reference Rasul and Rogger2018; Rasul, Rogger, and Williams Reference Rasul, Rogger and Williams2021). This article suggests that the preferences and characteristics of these managers matter for who else staffs public agencies, and thus potentially the nature of service delivery more generally.
Second, the article has implications for debates on civil service reform. Much of this rich literature assumes that a political party or politician can easily stack local bureaucracies with supporters when they come to power (e.g., Grindle Reference Grindle2012; Oliveros Reference Oliveros2021; Pierskalla and Sacks Reference Pierskalla and Sacks2020; Sigman Reference Sigman2022). Indeed, research on civil service reform has made important strides in enumerating the incentives that politicians face to stymie such reform (Cruz and Keefer Reference Cruz and Keefer2015; Geddes Reference Geddes1994; Huber and Ting Reference Huber and Ting2021; Schuster Reference Schuster2016). However, by demonstrating that the preferences of bureaucratic managers also drive bias in public sector hiring, and that their preferences sometimes have a greater impact on public hiring than those of local politicians, our findings suggest that effective civil service reform must address the incentives of both politicians and bureaucratic managers.
Third, we advance the lengthy literature on public sector patronage. Most work in this field treats bias in public sector hiring as a function of politician preferences (Colonnelli, Prem, and Teso Reference Colonnelli, Prem and Teso2020; Oliveros Reference Oliveros2021). However, our framework implies that previous estimates of patronage may be exaggerated if the incentives of politicians and bureaucratic managers are aligned. When politicians and managers share the same preferences, there is no allocation problem to resolve and some combination of both patronage and bureaucratic favoritism drives any ensuing hiring bias in these contexts. Prior research in this area that has attributed all of that bias to patronage has likely overstated the phenomenon and understated the extent to which bureaucratic management contributes to public sector bloat.
BIAS IN PUBLIC SECTOR HIRING: PATRONAGE OR BUREAUCRATIC FAVORITISM?
We consider the role of two distinct actors—politicians and bureaucratic managers—that each has some formal or informal influence over who gets hired in the public sector. Following a long literature in political science, we define patronage as politicians’ distribution of public sector jobs to political brokers, party workers, or other supporters. Prior research has documented the large electoral benefits for politicians of engaging in patronage hiring (Calvo and Murillo Reference Calvo and Murillo2004; Folke, Hirano, and Snyder Reference Folke, Hirano and Snyder2011). This has been shown to occur through numerous mechanisms. For instance, politicians can make appointments with an eye toward mobilizing voters in upcoming elections (Kitschelt and Wilkinson Reference Kitschelt and Wilkinson2007), distribute public sector positions in such a manner as to entrap recipients in clientelistic relationships in which recipients are beholden to using the authority of their position for their patron (Cornell and Grimes Reference Cornell and Grimes2022; Larreguy, Montiel, and Querubin Reference Larreguy, Montiel and Querubin2017; Mares and Young Reference Mares and Young2019; Oliveros Reference Oliveros2021; Robinson and Verdier Reference Robinson and Verdier2013), or distribute jobs to party brokers or foot soldiers (Bowles, Larreguy, and Liu Reference Bowles, Larreguy and Liu2020; Sigman Reference Sigman2022).
Previous studies have examined which institutional contexts allow politicians to hire more or fewer supporters. For example, patronage may rise or fall according to the electoral calendar as politicians feel pressured to hire supporters before an election or soon afterwards (Pierskalla and Sacks Reference Pierskalla and Sacks2020; Toral Reference ToralForthcoming). Or politicians may feel compelled to provide patronage positions depending on the level of political competition they face in their constituency (Driscoll Reference Driscoll2018; Grzymała-Busse Reference Grzymała-Busse2007; Hassan and Sheely Reference Hassan and Sheely2017; O’Dwyer Reference O’Dwyer2006). Patronage may also depend on the extent to which a political can claim credit for pushing through hires (Gulzar and Pasquale Reference Gulzar and Pasquale2017). These studies focus explicitly on the incentives of politicians and their immediate institutional contexts while downplaying the constraints that other (non-political) actors may impose based on their own incentives and power to bias public sector hiring.
Much of this research therefore overlooks bureaucratic favoritism, a separate and distinct type of bias in public sector hiring in which public sector managers grant preference when conferring a position or job.Footnote 1 Higher-level bureaucratic managersFootnote 2 generally oversee the hiring of lower-level officials. Bureaucratic favoritism, importantly, is conducted by unelected officials, thus distinguishing it from patronage by elected politicians. Further, unlike patronage, bureaucratic favoritism does not necessarily follow an electoral logic; it is instead based on managers’ varying incentives.
Past research has posited numerous reasons as to why managers may wish to hire individuals with whom they are socially connected. Perhaps most obviously, they may feel stronger social obligations toward individuals within their jurisdiction with whom they have personal ties (Hassan Reference Hassan2020; Johnson-Kanu Reference Johnson-Kanu2021; Pepinsky, Pierskalla, and Sacks Reference Pepinsky, Pierskalla and Sacks2017). Further, and similar to politicians, bureaucratic managers may prefer to hire in-group members because of an easier ability to extract rents or kick-backs from them (Brassiolo et al. Reference Brassiolo, Estrada, Fajardo and Martinez-Correa2021; Pellegrino and Zingales Reference Pellegrino and Zingales2017; Riano Reference Riano2022). Moreover, prior studies in organizational economics highlight how social connections shape agents’ interactions within organizations (Ashraf and Bandiera Reference Ashraf and Bandiera2018). That is, bureaucratic managers may prefer hiring those with whom they have a personal history or a shared identity because it is more productive to do so. Especially in contexts where teamwork or coordination is necessary, discrimination against out-group co-workers may decrease productivity (Hjort Reference Hjort2014).
FAVORITISM IN THE PUBLIC SECTOR AS AN ALLOCATION PROBLEM
We build on these two distinct literatures and highlight that public sector hiring, particularly at the local level, often requires agreement between local politicians and bureaucratic managers (Martin and Raffler Reference Martin and Raffler2021). We follow Brierley (Reference Brierley2021) in distinguishing between higher-level professional jobs and lower-level menial ones in local bureaucracies, though our model could just as easily have incorporated positions across two different agencies or sectors of the public sector instead. Our main intuition is that local hiring in the public sector is best construed as an allocation problem in which local politicians and bureaucratic managers have to agree on how to divide a given set of new hires subject to a budget constraint. In this way, our theoretical framework highlights each actor’s hiring preferences and ability to carry out those preferences.
We formalize our logic in the Supplementary Material and describe the main elements and intuition of the model here. We consider two distinct actors, a bureaucratic manager and a politician, who must agree on how to fill a number of higher-level professional positions,
 $ {N}^H $
, and lower-level menial jobs,
 $ {N}^L. $
The eventual allocation of public sector positions is subject to a budget constraint in which
 $ {N}_p^H+{N}_b^H\le {N}^H $
and
 $ {N}_p^L+{N}_b^L\le {N}^L $
.
Both actors want to allocate each type of position to individuals of their choice. Both would benefit from distributing higher-level positions as they pay well and ensure a degree of control over local resources or policy decisions. In turn, professional bureaucrats might be pressured to concentrate local public goods in a particular area, to siphon off development funds for their patron, or to provide kickbacks for their position or cuts of government contracts that the professional bureaucrat approves. Lower-level positions are also attractive for distribution. Namely, the low education requirements of menial jobs mean that they can go to almost anyone. And although these positions pay less than professional ones, they might be politically valuable, and their salaries may be more meaningful individually or in the aggregate. We expect the institutional context to determine whether a bureaucratic manager prefers distributing higher-level professional positions over lower-level menial ones relatively more than the politician.
Formally, the preferences of bureaucratic manager b and politician p and are, respectively, given by
 $$ \begin{array}{rl}{u}_b\left({N}_b^H,{N}_b^L\right)={N}_b^H+{\beta}_b{N}_b^L& \end{array} $$
and
 $$ \begin{array}{rl}{u}_p\left({N}_p^H,{N}_p^L\right)={N}_p^H+{\beta}_p{N}_p^L& \end{array} $$
such that
 $ {\beta}_b $
and
 $ {\beta}_p $
denote relative preferences for lower-level menial jobs. Where
 $ {\beta}_b,{\beta}_p<1 $
, the actor cares relatively more about distributing higher-level professional jobs than menial positions.
In assessing the allocation of positions, we consider each actor’s potential power to push for their hiring preferences. Managers and politicians often both have some formal institutional authority or informal leverage in the hiring process. For instance, a local politician may control and allocate funds for new hires, while the manager may ultimately oversee actual recruitment procedures. In other contexts, political alignment with national elites may informally give one actor more leeway in terms of hiring.
Since managers are often formally in charge of hiring, we model the bureaucratic manager as the actor that proposes an allocation of jobs to the politician, who then needs to agree or reject the proposed allocation. We then formally specify the relative institutional authority or informal leverage that the politician has over the bureaucrat in forcing a better allocation for himself as
 $ \underset{\_}{u_p} $
such that
 $$ \begin{array}{rll}{N}_p^H+{\beta}_p{N}_p^L& \ge & \underset{\_}{u_p}\end{array} $$
which means that the manager should propose an allocation that provides sufficient utility
 $ \underset{\_}{u_p} $
for the politician to agree. The smaller
 $ \underset{\_}{u_p} $
, the lower the relative leverage the politician has over the bureaucratic manager.
Our model therefore treats the bias in the public sector as dependent on the two factors described previously—(1) the benefits of different types of public sector jobs to the local politician and bureaucratic manager (
 $ {\beta}_b $
and
 $ {\beta}_p $
), and (2) each actor’s potential sources of institutional authority or informal leverage that each actor has over the other (
 $ \underset{\_}{u_p} $
). We solve the optimal allocation problem of the bureaucratic manager, who maximizes her utility subject to the constraint captured by Equation 3 (Supplementary Material). Recall that this equation captures the manager’s need to provide an allocation that is acceptable to the politician, given the latter’s leverage over the former. Doing so leads to four scenarios in equilibrium, which are dependent on the relative values of
 $ {\beta}_b $
and
 $ {\beta}_p $
on the one hand and
 $ \underset{\_}{u_p} $
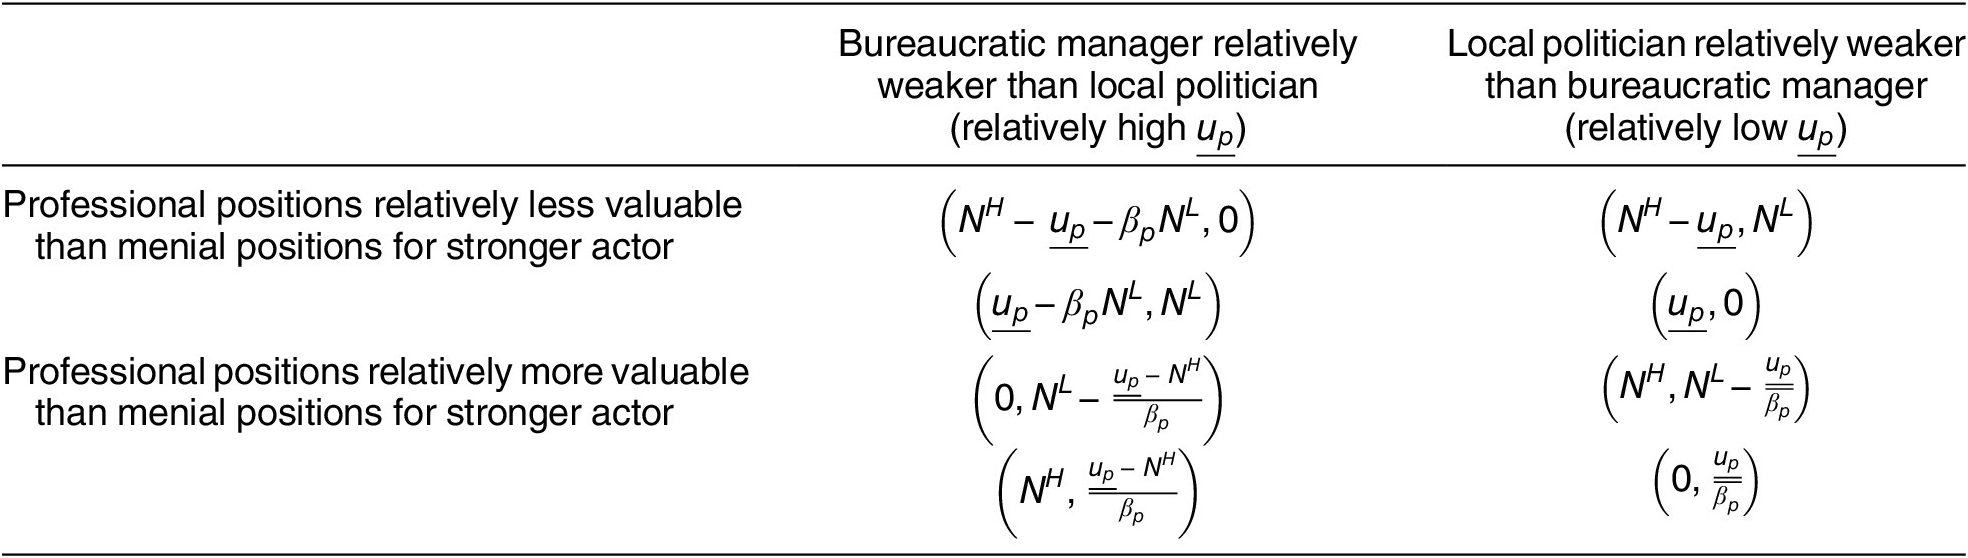
on the other. We specify these four equilibria in Table 1.
Elites’ Relative Power Over and Benefits from Public Sector Hiring

Note: This table depicts possible combinations of relative strength and the potential benefits of different types of jobs to the stronger actor. These combinations produce four general types of contexts predicted by the model. Each cell displays the payoffs for the bureaucratic manager (the first set of parentheses) and the politician (the second set). Within each set of parentheses, the first payoff represents the number of high-level professional positions and the second payoff represents the number of low-level menial positions. Note the table only shows instances in which the incentives of the manager and politician are not aligned.
Following the theoretical contours outlined previously, the columns of Table 1 differentiate between contexts in which the bureaucratic manager is relatively weaker or relatively stronger than the local politician (i.e.,
 $ \underset{\_}{u_p} $
is relatively low or high, respectively). We also differentiate between contexts in which higher-level appointees are relatively more versus less valuable to the stronger actor. Formally, this means that
 $ {\beta}_b<{\beta}_p $
in the bottom-right and top-left quadrants, and
 $ {\beta}_b>{\beta}_p $
in the top-right and bottom-left quadrants.Footnote
3
The combination of these factors produces four general institutional contexts and enables us to make predictions about the level of political patronage relative to bureaucratic favoritism that we should expect in each. Table 1 lists the payoffs for each actor in each scenario (the bureaucratic manager’s payoff is listed first and the local politician’s payoff second). Contexts in the top-left quadrant are those in which the local politician is relatively stronger than the bureaucratic manager and prefers low-level menial positions to high-level professional ones more than the bureaucratic manager. This box is most representative of contexts in which clientelism is pervasive. Here, we should expect a politician to focus his efforts relatively more on distributing menial positions rather than professional ones—like in Brierley (Reference Brierley2021)—and to be successful in doing so. One interesting result from the model is that the stronger actor is not satisfied with amassing all of the jobs in the relatively more valuable position. They require some of the relatively less valued positions as well. In this quadrant, the politician requires all of the menial hires as well as some professional hires to satisfy
 $ \underset{\_}{u_p} $
.
In the top-right quadrant, the bureaucratic manager is relatively stronger and considers menial positions to be more valuable than the local politician. This box is also representative of clientelistic contexts, but ones in which managers have politicized incentives on behalf of political elites other than local politicians. For instance, this may be representative of opposition strongholds in dominant-party systems in which particular managers are instructed to build the ruling party’s strength against the local opposition. Unlike in the first quadrant, we should observe favoritism among hires for menial jobs to be more aligned with the manager’s hiring preferences as opposed to the politician’s.
In the bottom-left and bottom-right quadrants, clientelism is less pervasive, or at least not the main impetus behind public sector hiring within a particular agency. In such environments, professional bureaucrats control a considerable amount of resources; thus the stronger actor deems them more valuable than an army of menial foot soldiers by the relatively stronger actor. For example, these dynamics are likely to occur if local professional bureaucrats have extensive discretion over the placement of local public goods or procurement contracts. The local politician is relatively stronger in the bottom-left quadrant, whereas the bureaucratic manager is relatively stronger in the bottom-right quadrant. As we describe below, the bottom-right quadrant most accurately fits Kenyan local authorities. In these contexts, we should expect relatively more valuable professional positions to be distributed to the manager’s preferred individuals. Moreover, paralleling the model results from the other quadrants, we expect the manager to allocate all of the professional positions to herself and extract some menial positions as well.
BACKGROUND ON THE KENYAN CASE
We apply our theory to Kenyan local authorities from 2004 to 2013, the country’s primary channel of decentralized government during this time.Footnote 4 This section illustrates that Kenya’s institutional context places it squarely in the bottom-right quadrant of Table 1. Below, we first provide information about local authorities, including the formal hiring processes. Next, we discuss each actor’s relative authority and leverage over the other. We then describe the hiring incentives of the relevant politicians and bureaucratic managers.Footnote 5
Kenyan Local Authorities
At independence, Kenya’s local authorities were conceived as engines of local development that would serve as a check on central government power. However, the country’s first president effectively neutered their authority in his quest to centralize power. Local authorities have since largely become sites of local extraction.Footnote 6
Each locality’s budget is mostly comprised of disbursements from the Ministry of Local Government. These budgets are meant to be used to fulfill local-level governance duties: the building and maintenance of new capital expenditures and development projects. In practice, however, the majority of funds are spent on payrolls. During our study period, councils spent an average of 56% to 63% of their annual revenues on personnel: some spent more than 90% in certain years. Local authorities are largely perceived as vehicles for local employment (Mboga Reference Mboga2009; Muia Reference Muia2008; Owolabi Reference Owolabi2011).Footnote 7
The hiring decisions of each local authority are shaped by non-elected (appointed) and elected officers. The most important appointed official in each locality is the clerk. These bureaucratic managers serve as the “chief executive” (Owolabi Reference Owolabi2011) and must sign off on all expenditure decisions within the local authority, including hiring for all other positions. Clerks are part of the Ministry of Local Government. Though they serve locally, they are recruited, hired, and managed by the central government in Nairobi. They can be deployed to nearly any local authority in the country and frequently rotate between councils. Each locality also has a council comprised of between 4 and 26 individual electoral wards (the average for our period of study is 11). Each ward elects a councilor through partisan first-past-the-post elections held concurrently with national elections. Local councilors wield significant formal and informal power, and seek to shape local decisions to benefit those living in their particular ward (Odhiambo, Mitullah, and Akivaga Reference Odhiambo, Mitullah and Akivaga2005; Sheely Reference Sheely2015).
Every bureaucratic position in a locality, from clerks to menial staff, has a corresponding salary group ranging from 1 (highest ranking) to 20 (lowest ranking). The ladder is standardized for different positions across local authorities and other state agencies, and the scales are adjusted for each locality’s cost of living. Within local authorities, clerks occupy the highest-ranking position (salary groups 2–4).
Public sector positions of different ranks are formally managed differently. The authority to hire public sector positions at salary groups 10–20 has been formally delegated to each local authority. Members of the local bureaucracy and especially the clerk jointly determine what and how many of these lower-level, menial positions are needed within their local authority.
The central government, and particularly the Public Service Commission (PSC), is formally in charge of managing highly skilled bureaucrats whose job groups fall between 5 and 9, such as engineers, land surveyors, and public health officers. The PSC runs national recruitment drives for these positions, such as through the country’s largest newspapers and across universities, and conducts placement exams and interviews to hire a new batch of recruits. Once a professional bureaucrat has been hired by the PSC, they go into a pool of available bureaucrats. However, these bureaucrats do not receive their full salary and benefits until they are actually deployed to a post. Thus, professional bureaucrats have a strong incentive to be sent to a locality, where they can also enjoy the formal compensation and associated benefits (graft) of their position. Deployments are based on local demand; the clerk is the lead person in this process and the primary point of contact between the ministry and the locality.
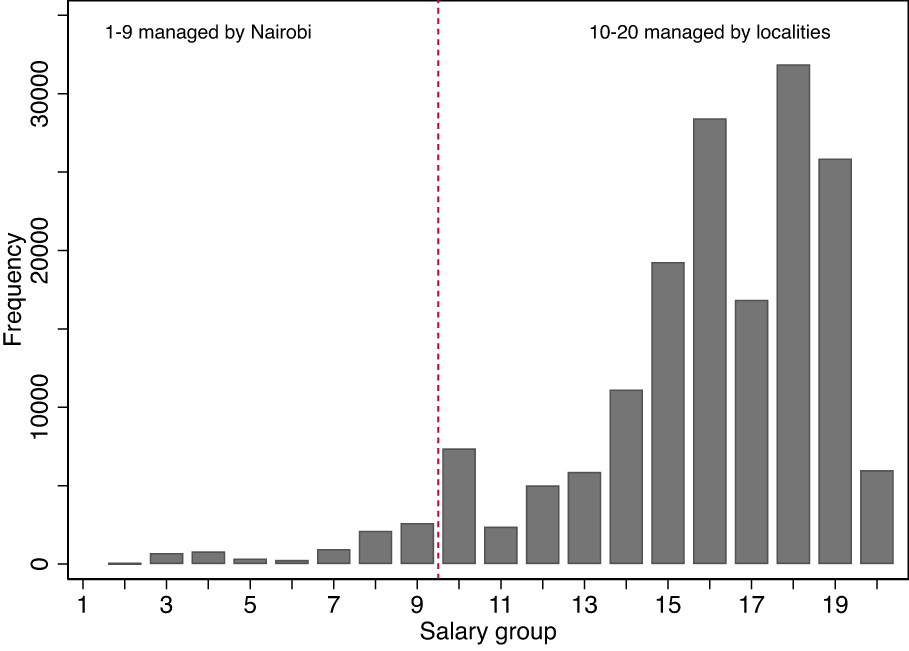
Figure 1 displays the distribution of salary groups across all local authorities and years within our sample. It illustrates that the vast majority of positions (95.0%) within each local authority are menial (salary groups 10–20) and have fairly low education and experience requirements.Footnote 8 Many such positions are often specific to the geography and environment of the specific locality (e.g., local authorities that abut wildlife preserves tend to have game officers), but others are fairly ubiquitous across localities (e.g., market attendants, drivers, and guards).
Distribution of Salary Groups Across Local Authorities, 2004–13
Note: This figure plots the number of bureaucrats working at different salary groups across all local authority-years. The dotted line separates salary groups formally managed by the central government in Nairobi from those managed by local councils.

The median salary differential across salary groups in our sample is large and it is substantially more expensive to employ professional positions than menial ones. For instance, the median annual salary for a bureaucrat in salary group 7 is about 385,000 Kenyan shillings (around $3,350 in 2010), compared to 120,000 KSH (around $1,050) in salary group 17. Thus, it is substantially cheaper to maneuver the council’s limited budget to hire menial positions than professional ones.Footnote 9
Clerks’ and Politicians’ Leverage Over Each Other
Clerks are the single most important person in each local authority. They are the chief administrator and have formal executive authority over locality decisions, including those pertaining to personnel. According to Muia (Reference Muia2008, 149) even the “chairman of the councils are more or less ceremonial with no powers over the central government appointed executive clerks.” With regards to menial hiring, they oversee the decision to advertise for a new position (including through their involvement to budget for the position) and oversee the actual hiring process.
Although the PSC formally hires and fixes the pool of professional bureaucrats, clerks play an important role in the de facto hiring of high-ranking bureaucrats within a locality. Given clerks’ official position within the Ministry of Local Government, they have a direct line to Nairobi that they can use to petition the center to hire particular professional positions. For instance, the clerk may increase efforts to ensure the deployment of a professional bureaucrat by drawing up additional reports about the necessity of the position and making continuous requests until a deployment has been made. The clerk is thus both the main petitioner to the Ministry of Local Government in the deployment of a specific professional position to the locality and the main point of contact in the assignment of the specific professional position that is to be deployed. The clerk sometimes even requests individual professional bureaucrats by name.Footnote 10
Yet local councilors still exercise some informal weight on clerks even if the latter formally oversee the hiring process. This authority is derived from the council’s ability to request a clerk’s transfer. The Ministry of Local Government assigns clerks across local authorities based on a mix of formal regulations and informal political appeals. The ministry explicitly prohibits clerks from serving in their home locality to prevent the negative repercussions of bureaucratic embeddedness (Hassan Reference Hassan2020). Aside from this formal policy on clerk assignments, officials in the Ministry of Local Government consider the requests of local councilors: since councilors are tied to a geographic constituency while clerks are mobile by design, poor relations between the clerk and the council often leads to conflict and the clerk’s eventual transfer (Muia Reference Muia2008).Footnote 11 As explained in one case study, a clerk “who [does] not pander to the whims of the politicians, cannot survive for long in a local authority” (Odhiambo, Mitullah, and Akivaga Reference Odhiambo, Mitullah and Akivaga2005, 114). Similar to the context described in Brierley (Reference Brierley2020), clerks interviewed for this study reiterated that those who are considered too “strict” with the appropriation of funds requested by the council are those who are most likely to be transferred. This is even in spite of the fact that the Ministry of Local Government demands financial discipline from clerks.Footnote 12
While a number of personal factors might affect the relationship between the clerk and local councilors,Footnote 13 numerous officials in the Ministry of Local Government confirmed that councilors strongly prefer co-ethnic clerks.Footnote 14 The country’s largest ethnic groups are well represented among clerks and represent the ethnic majority in multiple local authorities. Indeed, Kenya’s largest five ethnic groups comprise about two-thirds of the population,Footnote 15 represent the majority in 74% of localities, and constitute more than 69% of clerk-years in our data. A clerk can therefore quite easily serve in a local authority away from home and yet in which her ethnic group is in the majority.
When a clerk is co-ethnic with the council, local politicians can better informally pressure them to increase co-ethnic hiring. For instance, the Director for Local Authorities from 2008 to 2013, and a former clerk himself, claimed that a clerk who is co-ethnic with local politicians has a hard time pulling rank. Elites in the area make complaints such as “how can our son rule us?” if the clerk refuses appeals for more hires.Footnote 16 One clerk explained that she was not taken as seriously in local authorities where her ethnic group was in the council majority because they expected that she could be cajoled.Footnote 17 Another clerk explicitly said that his hardest clerkship was in a locality in which his co-ethnics were the dominant group precisely because of the social pressure placed on him by councilors and their constituents to increase local employment through the public sector.Footnote 18 However, other clerks were explicit about the benefits of being in a co-ethnic local authority for biased hiring and graft more generally: one clerk described being in a co-ethnic council as similar to being in a “family organization” in which all are willing to scratch each other’s backs for all manner of operations.Footnote 19
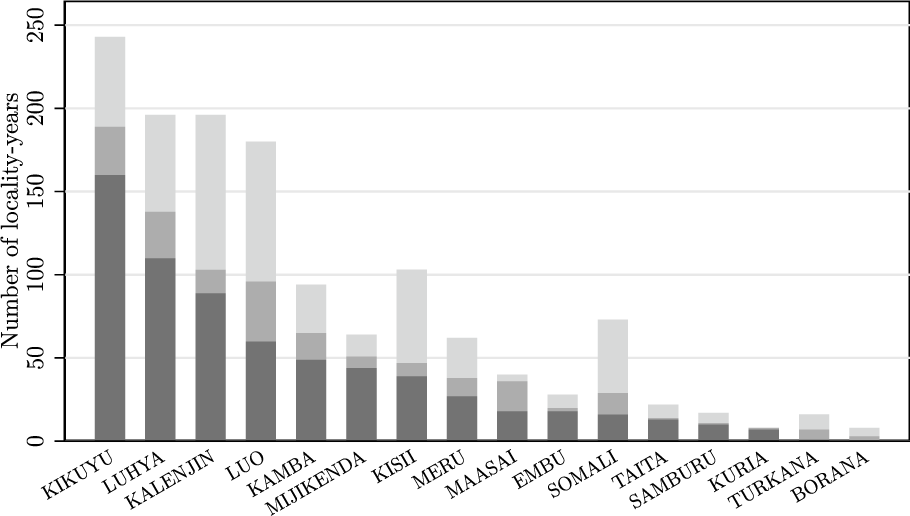
The summary statistics from our data on clerk postings are in line with the interview evidence. Figure 2 illustrates the three possible clerk assignments relative to the ethnic group in the council majority. Nearly half (48.4%) of local authority-years within our sample (see below in data) have a clerk who is co-ethnic with the council majority—substantially more than the 14.2% of local authority-years in which the clerk is a non-co-ethnic of the majority. We reject the null hypothesis that ethnic groups in the council majority are equally likely to have a co-ethnic clerk as other ethnic groups (see Supplementary Materials).Footnote 20 Clerks are also rotated between local authorities often and are frequently called back to Nairobi for training or workshops. As such, a local authority may be transitioning between clerks and might not have a clerk every single year (37.4% of local authority-years in our data). Together, these summary statistics strongly point to the very real ability of local councilors to lobby the Ministry of Local Government for a co-ethnic clerk.
Clerk Assignment by Ethnic Group in the Council Majority
Note: This figure plots the number of local authority-years in which each group on the x-axis holds the majority on the local council. The bars are shaded by clerk status with respect to the council majority: locality-years with no clerk are light gray, locality-years with a non-co-ethnic clerk are medium gray, and locality-years with a co-ethnic clerk are dark gray. The groups on the x-axis are ordered from left to right according to the number of locality-years with co-ethnic clerks.

Hiring Preferences of Politicians (Councilors) and Bureaucratic Managers (Clerks)
Ethnicity is the most salient political cleavage in Kenya (Elischer Reference Elischer2013; Horowitz Reference Horowitz2019). Kenyan local authorities display ethnic dominance, but not outright homogeneity: 89% of Kenyan local authorities have a clear ethnic majority in the population, but the average size of the largest group is only 75%. Thus, there is sufficient local-level diversity that most local authorities have members of many ethnic groups, including the country’s largest.
Elected councilors’ incentives within their local authority are clear: they want to employ co-ethnic constituents in public sector positions. Citizens largely perceive local authorities as avenues for menial employment as opposed to channels for development,Footnote 21 and council members are evaluated based on their ability to provide local residents with jobs. Local councilors thus see the benefit of distributing numerous lower-level positions that are recruited locally. Politicians also have incentives to hire co-ethnics in high-ranking professional positions in hopes that they will engage in graft on their behalf. For instance, one clerk explained how councilors constantly requested that their preferred individuals be hired as revenue collectors.Footnote 22
Clerk preferences are more complex. They have conflicting incentives to both limit and accommodate politicians’ patronage hiring and to engage in favoritism hiring of their own. On the one hand, clerks have some incentives to accommodate politicians’ patronage requests. As we describe above, clerks are more likely to be transferred—a taxing, and bothersome ordeal for civil servants—if they resist the council’s will. Even if a clerk is not transferred for standing up to the council’s demands, local politicians can make the work of strict clerks unpleasant. For example, one clerk described how the local council would lock him out of important meetings while another recounted an incident in which a councilor threw a chair at him.Footnote 23
On the other hand, clerks also juggle their proclivity to hire their co-ethnics—especially to professional positions. Their incentives to recruit their co-ethnics for these jobs are multi-faceted. First, clerks prefer to work with co-ethnic bureaucrats with whom they are more likely to have a rapport. Clerks cannot serve in their home locality, but they feel some sense of comfort when working with other top bureaucrats, who tend to work in the locality’s central office with them, and who have a better sense of their culture and background.Footnote 24
Second, and more insidiously, a clerk’s co-ethnicity with other professional bureaucrats could facilitate kick-backs. Kick-backs of all types are rampant within local authorities and, in many cases, involve the clerk colluding with other professional bureaucrats on issues from procurement to land grabs. Annual reports published by the country’s anti-corruption agency list individual cases of corruption and include many instances of clerks and professional bureaucrats in the locality collaborating for graft. The 2007–08 report recounts a case in which the clerk, working with two other professional bureaucrats within the local authority, engaged in improper procurement procedures.Footnote 25 The 2011–12 report describes another “willful failure to comply with the law relating to procurement” by a clerk and a procurement manager.Footnote 26 The report also discusses an on-going investigation of a clerk and another professional bureaucrat in which they cannot account for more than 20 million KSH (around $270,000).Footnote 27 In fact, one of the case studies that the anti-corruption committee describes of common corruption within Kenya involves a fictionalized example in which a town clerk “orders” a bureaucrat involved with procurement to help the clerk’s preferred vendor. While this type of collusion could occur among any professional bureaucrats, it was perceived as more likely to occur among the clerk’s co-ethnics.Footnote 28
Third, these incentives are compounded by the law of numbers. Although clerks are the most powerful person in a locality, politicians’ leverage over them limits the total amount of bias they can exercise; with up to 26 political councilors to please in order to avoid the council’s ire, clerks have a limited ability to distribute a large number of menial jobs. As one clerk explained, “if there are 20–30 new [hires], you as clerk make sure that …two are your own picks.”Footnote 29 With the ability to affect only a minority of new hires, clerks have an incentive to focus on professional positions.
DATA AND DESCRIPTIVES
This section describes the administrative data on Kenyan local authorities that we use to examine our theory. We then provide basic descriptive statistics on important variables and illustrate the presence of both patronage and bureaucratic favoritism in local authority hiring.
Data
We analyze annual payroll information across Kenyan local authorities from 2004 to 2013.Footnote 30 These data contain the name, position, and salary group of every local public sector employee, including centrally-appointed clerks. We scraped and merged these payroll records to create a single dataset with the universe of bureaucrats working in local authorities during the study period. In this format, the data thus allow us to observe the year in which a local authority hired each individual bureaucrat. The payroll information does not include employee ethnicity. We therefore rely on the strong association between last names and particular ethnic groups in Kenya to manually back out the ethnicity of each bureaucrat. We employed a team of Kenyan research assistants to manually code the ethnicity of each individual bureaucrat.
We merge this payroll information with election and demographic data for each local authority. The election data are from the 2002 and 2007 elections. We use the same coding strategy described above to manually code the ethnicity of councilor names and determine the ethnic composition of each council. We determine the population and ethnic composition of local authorities using a local-level 2.5% sample of the 1989 census, the most recent census before 2004 that contains sub-national ethnicity data.Footnote 31 We then collapse the merged data to the ethnic group-locality-year level, yielding 24,588 observations in the period from 2005 to 2012.Footnote 32
The average local authority has 108.9 public servants on its payroll and hires about 8.9 new individuals each year. Of these new hires, each year approximately 1.3 are in salary groups 1–9 and 7.6 are in groups 10–20. We measure favoritism in the bureaucracy as the percentage of new hires from a particular ethnic group in a local authority in a given year. We code individual bureaucrats as new hires in the first year that their name appears in a given local authority’s payroll data. We then calculate the dependent variable
 $ Hirin{g}_{ijt} $
as the percent of bureaucrats hired in local authority i and year t who belong to ethnic group j.
Descriptive Statistics
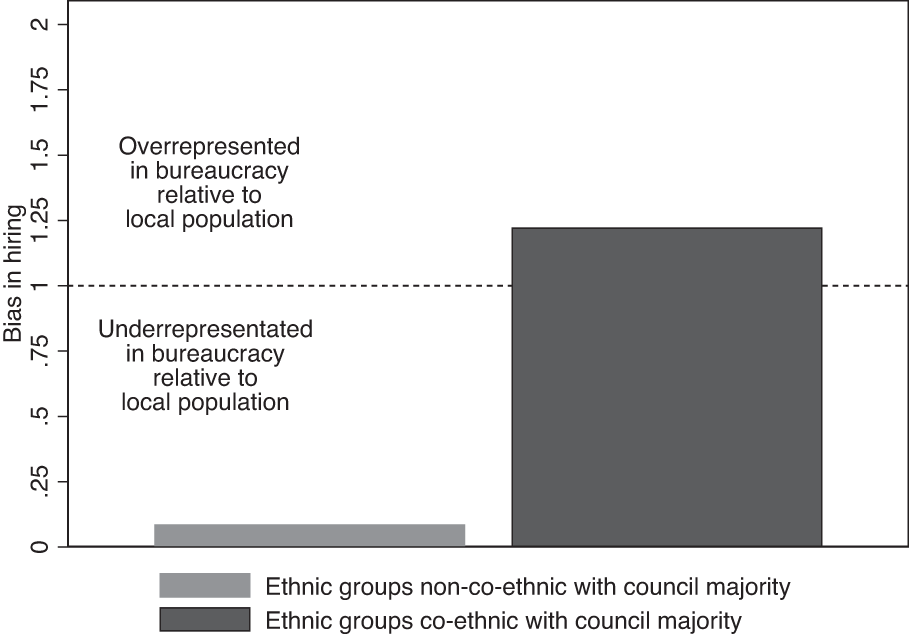
Figures 3 and 4 show descriptive evidence of patronage and bureaucratic favoritism, respectively, in the hiring of local bureaucrats from all salary groups. Both figures show the bias or premium that an ethnic group enjoys in the bureaucracy relative to its share of the locality’s population. Formally, we define the ethnic bias in hiring for ethnic group j in local authority i and year t as
 $$ Bias\hskip0.3em in\hskip0.3em hirin{g}_{ijt}=\frac{\%\hskip0.3em of\hskip0.3em new\hskip0.3em hires\hskip0.3em in\hskip0.3em local\hskip0.3em authority\hskip0.3em i\hskip0.3em and\hskip0.3em year\hskip0.3em t\hskip0.3em from\hskip0.3em ethnic\hskip0.3em group\hskip0.3em j}{Percent\hskip0.3em of\hskip0.3em total\hskip0.3em population\hskip0.3em in\hskip0.3em local\hskip0.3em authority\hskip0.3em i\hskip0.3em from\hskip0.3em ethnic\hskip0.3em group\hskip0.3em j}. $$
Hiring Bias Suggestive of Patronage
Note: This figure plots the average bias in hiring for ethnic groups not co-ethnic with the council majority (medium gray) and ethnic groups co-ethnic with the majority (dark gray). A hiring bias greater than 1 suggests that the group is overrepresented in the local authority bureaucracy relative to the local population, while a bias less than 1 suggests the group is underrepresented.

Hiring Bias Suggestive of Bureaucratic Favoritism
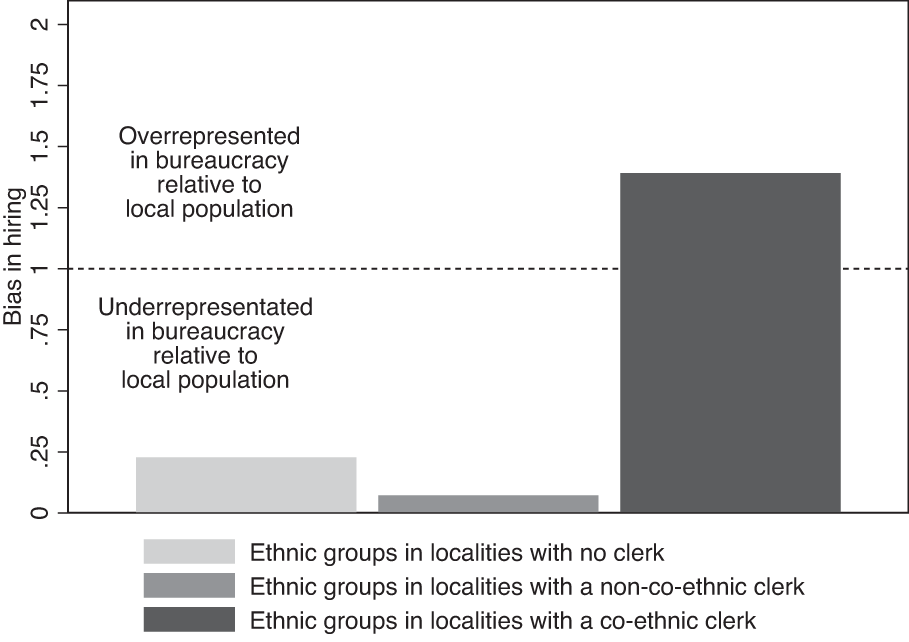
Note: This figure plots the average bias in hiring for ethnic groups in localities with no clerk (light gray), ethnic groups in localities with a non-co-ethnic clerk (medium gray), and ethnic groups in localities with a co-ethnic clerk (dark gray). As in Figure 3, a hiring bias greater than 1 suggests that the group is overrepresented in the local authority bureaucracy relative to the local population, while a bias less than 1 suggests the group is underrepresented.

If there is no ethnic bias, the percent of new hires belonging to a particular ethnic group weighted by their share in the population will be 1. The more an ethnic group is over-represented in new hires relative to the group’s representation in the locality’s population, the larger the premium will be. If some groups are over-represented in the bureaucracy, then others will be under-represented and have values less than 1.
Figure 3 shows the premium disaggregated by whether an ethnic group holds the majority of seats in a local authority council. Each bar represents the bias statistic averaged over all ethnic group-locality-year combinations, separated by whether or not the ethnic group holds the local council majority in that year. Ethnic groups with a council majority enjoy a hiring premium of 1.31 (compared to 0.32 for ethnic groups without a majority). Since the premium is above 1 for groups with the majority, the figure suggests patronage hiring because ethnic majorities distort local hiring in favor of their co-ethnics.
Figure 4 similarly shows the premium disaggregated by the presence and ethnicity of a clerk. Like groups with a council majority, groups co-ethnic with a clerk enjoy a large ethnic premium in hiring. The premium for groups in localities with no clerk or groups with a non-co-ethnic clerk is 0.228 and 0.073, respectively. For ethnic groups with a co-ethnic clerk, the premium jumps to 1.39. While Figure 3 is suggestive of patronage, Figure 4 is indicative of bureaucratic favoritism and the critical importance of the clerk in understanding bias in hiring among Kenya’s local authorities.
ESTIMATION AND RESULTS
Estimation
We more rigorously test the implications of Figures 3 and 4 using a fixed effects design. We estimate a two-way fixed effects OLS regression at the ethnic group-locality-year level as follows:
 $$ Hirin{g}_{ijt}={\displaystyle \begin{array}{l}{\beta}_0+{\beta}_1Majorit{y}_{ijt}+{\beta}_2Clerk\hskip0.3em presenc{e}_{it}\\ {}+\hskip2px {\beta}_3\left(Majorit{y}_{ijt}\times Clerk\hskip0.3em presenc{e}_{it}\right)\\ {}+\hskip1em {\beta}_4Clerk\hskip0.3em ethnicit{y}_{ijt}\\ {}+\hskip2px {\beta}_5\left(Majorit{y}_{ijt}\times Clerk\hskip0.3em ethnicit{y}_{ijt}\right)\\ {}+\hskip2px {\mathbf{X}}_{ijt}\gamma +{\alpha}_{ij}+{\delta}_t,\end{array}} $$
where i indexes local authorities, t indexes years, and j indexes ethnic groups. We relate the outcome variable
 $ Hirin{g}_{ijt} $
, which is the annual share of hires that belong to ethnic group j in a local authority (i.e., the number of hires that belong to ethnic group j over the total number of hires in a local authority-year
 $ i-t $
),Footnote
33 to three principal independent variables. First, we define
 $ Majorit{y}_{ijt} $
as an indicator equal to 1 if ethnic group j holds a majority of council seats in local authority i and year t. The coefficient
 $ {\beta}_1 $
therefore represents—all else equal—the difference between the average value of the dependent variable for ethnic groups in the majority and ethnic groups not in the majority when the locality-year has no clerk. Positive and significant values on this coefficient would confirm previous findings that local politicians favor their supporters with patronage. Note the omitted category of
 $ {\beta}_0 $
in Equation 5 is ethnic groups not in the majority for locality-years when there is no clerk.
Second,
 $ Clerk\hskip0.3em presenc{e}_{it} $
is an indicator that equals 1 if local authority i is assigned a clerk of any ethnicity in year t. The coefficient
 $ {\beta}_2 $
captures the difference between the average value of the dependent value for locality-years with a non-co-ethnic clerk and no ethnic majority on the council and the omitted category. Since 96.5% of locality-years have a council majority, the coefficient on
 $ {\beta}_2 $
is of little substantive interest. Third,
 $ Clerk\hskip0.3em ethnicit{y}_{ijt} $
is an indicator that is equal to 1 if local authority i is assigned a clerk of ethnicity j in year t. The coefficient
 $ {\beta}_4 $
, therefore, represents the difference between the average value of the dependent variable for groups co-ethnic with the clerk and groups not co-ethnic with the clerk when ethnic group j is not in the majority. Positive and significant values of
 $ {\beta}_4 $
would confirm our prediction that clerks are able to pursue favoritism in hiring.
We also introduce two interactions to model how the effect of the local majority changes based on whether local authority i in year t has a clerk and whether that clerk is co-ethnic with the majority. The coefficient
 $ {\beta}_3 $
on the interaction
 $ Majorit{y}_{ijt}\times Clerk\hskip0.3em presenc{e}_{it} $
represents the effect of a non-co-ethnic clerk’s presence relative to no clerk for the group in the council majority. Negative and significant values on this coefficient would indicate that non-co-ethnic clerks diminish the majority’s ability to bias hiring. Similarly, the coefficient
 $ {\beta}_5 $
on the interaction
 $ Majorit{y}_{ijt}\times Clerk\hskip0.3em ethnicit{y}_{ijt} $
represents the effect of a co-ethnic clerk’s presence relative to a non-co-ethnic clerk on hiring for the group in the council majority.
Finally,
 $ {\alpha}_{ij} $
represents ethnic group-local authority fixed effects and
 $ {\delta}_t $
represents year fixed effects. In alternative specifications we substitute
 $ {\delta}_t $
for ethnic group-year fixed effects
 $ {\delta}_{jt} $
and local authority-year fixed effects
 $ {\psi}_{it} $
. These two sets of fixed effects allow us to control for a large number of possible confounders. First, the ethnic group-local authority fixed effects
 $ {\alpha}_{ij} $
control for any time-invariant characteristics unique to a particular ethnic group in a given locality. Second, the ethnic group-year fixed effects
 $ {\delta}_{jt} $
account for annual shocks that affect every ethnic group, but independently of their locality. Third, local authority-year fixed effects
 $ {\psi}_{it} $
account for annual shocks that are specific to the locality, but independently of ethnic groups. Taken together, the granularity of the fixed effects in Equation 5 enables us to rule out alternative explanations based on variables invariant across year- or ethnic group-locality pairs. Given these fixed effects, Equation 5 relies on one important identification assumption: the absence of time-varying confounders. This assumption also entails the absence of reverse causality. In other words, we assume the values of any dependent variables from prior periods should not affect the values of independent variables in the current period. As mentioned in the next section, we directly test for the presence of these confounders in Table H.1 in the Supplementary Material.
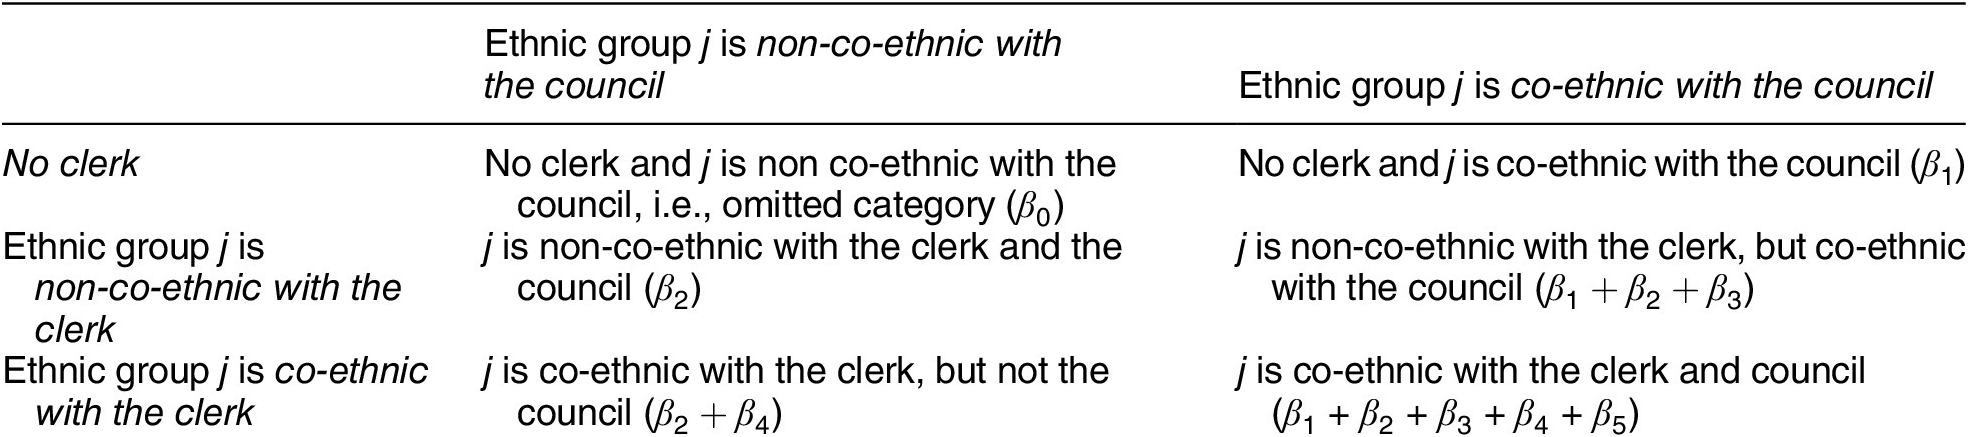
For ease of interpretation, we are primarily interested in particular linear combinations of the coefficients rather than their base values. We focus on the six possible relationships between a given ethnic group j, the council majority, and the clerk. First, locality-years may or may not have a clerk. For locality-years with a clerk, a given ethnic group j may be co-ethnic with only the clerk, co-ethnic with only the council, co-ethnic with neither the clerk nor the council, or co-ethnic with both the clerk and the council. Table 2 presents the six different relationships and how the coefficients in Equation 5 map onto those categories. Each of the linear combinations represents the difference between the average value of the dependent variable for that category and the average value of the dependent variable for the omitted category
 $ {\beta}_0 $
(which represents ethnic groups that are not in the majority for locality-years with no clerk).
Relationships Between Ethnic Group j, the Clerk, and the Council

Patronage and Bureaucratic Favoritism in Hiring
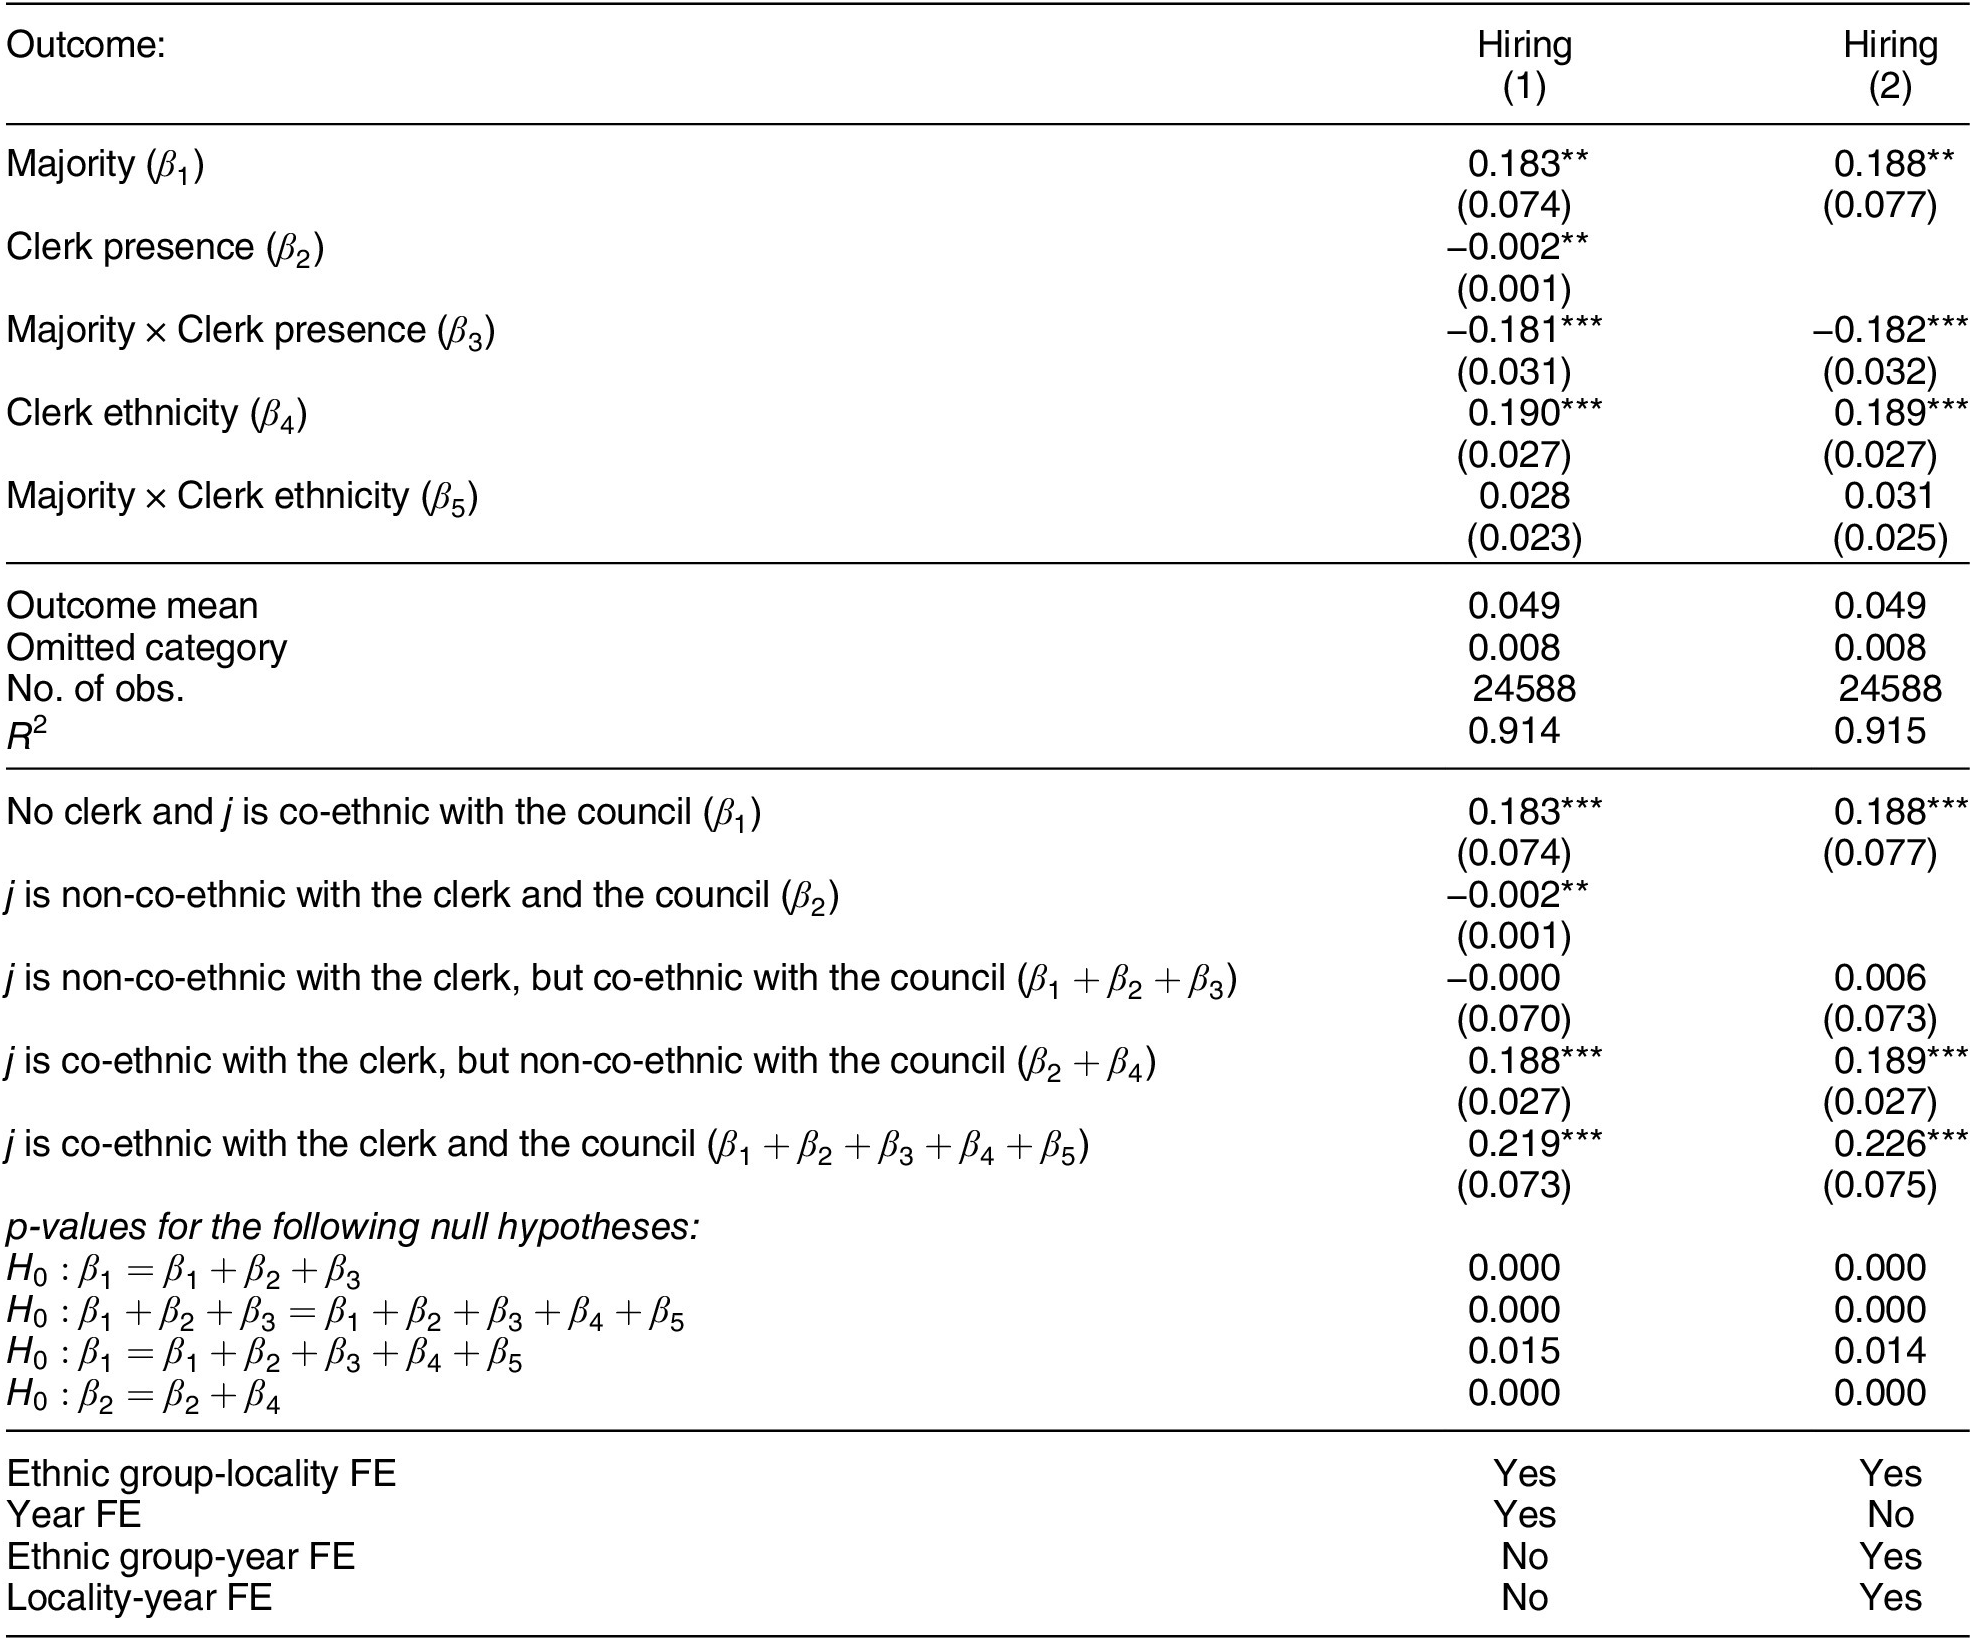
Table 3 presents the main results that disentangle hiring bias due to political patronage and bias due to bureaucratic favoritism.Footnote
34 The first column has ethnic group-locality and year fixed effects, while the second column has the more stringent ethnic group-year and locality-year fixed effects. As expected, the
 $ {\beta}_1 $
coefficient on
 $ Majorit{y}_{ijt} $
is positive and statistically significant across both specifications. This confirms that the ethnic group in the council majority can pursue patronage hiring in the absence of a clerk. However, the
 $ {\beta}_4 $
coefficient on
 $ Clerk\hskip0.3em ethnicit{y}_{ijt} $
is also consistently positive and significant. This suggests that clerks also engage in favoritism and bring their own bias to the hiring process.
Patronage and Bureaucratic Favoritism in Hiring

Note: Standard errors in parentheses. *
 $ p<0.10 $
, **
 $ p<0.05 $
, ***
 $ p<0.01. $
The third panel of Table 3 presents the linear combinations from Table 2 and their standard errors. First, ethnic groups in the majority enjoy a statistically significant hiring premium when there is no clerk. New hires from the majority ethnic group increase by 18.3 percentage points (
 $ {\beta}_1 $
) relative to other groups. Without a clerk, we can think of this first category as representing the “revealed preference” of the council majority for patronage.
Second, ethnic groups that are not co-ethnic with the clerk or the council receive no real change in hiring relative to the omitted category (
 $ {\beta}_2 $
). These values are either zero or very small. Third, ethnic groups that are co-ethnic with the clerk but not with the council majority receive a boost roughly similar to those that are co-ethnic with the council majority (
 $ {\beta}_2+{\beta}_4 $
). When an ethnic group has a co-ethnic clerk but not a co-ethnic council, new hires from that group increase by 18.8 percentage points. This finding suggests that clerks engage in favoritism that is separate from the council’s patronage.
Fourth, ethnic groups that are co-ethnic with both the clerk and the council enjoy a large hiring premium (
 $ {\beta}_1+{\beta}_2+{\beta}_3+{\beta}_4+{\beta}_5 $
): their hiring increases by 21.9 percentage points. This makes sense because, in these contexts, the preferences of the clerk and the council are aligned. We note, however, that this linear combination cannot disentangle the incentives of the clerk from the council—muddying the picture as to how much each actor biases hiring.
On the other hand, the final category reveals what happens when the preferences are not aligned and thus allows this article to empirically separate the incentives of the two main actors. Ethnic groups that are co-ethnic with the council but not the clerk do not experience an increase in hiring that is statistically different than 0 (
 $ {\beta}_1+{\beta}_2+{\beta}_3 $
). In other words, the assignment of a non-co-ethnic clerk dampens the premium that an ethnic group co-ethnic with the council enjoys when there is no clerk (
 $ {\beta}_1 $
) (
 $ p<0.01 $
) or when there is a co-ethnic clerk (
 $ {\beta}_1+{\beta}_2+{\beta}_3+{\beta}_4+{\beta}_5 $
) (
 $ p<0.01 $
).
Overall, these results document how bureaucratic managers affect patronage. Consistent with past studies from the parallel literatures on patronage and bureaucratic favoritism, we identify an ethnic premium for new hires who are co-ethnic with either the local council majority or the clerk. Moreover, Table 3 suggests that these two effects interact: while clerks who are co-ethnic with the council majority do not further bolster the hiring of co-ethnics, the presence of a clerk who is not co-ethnic with the council majority effectively neuters the bias in hiring. Perhaps most importantly, the third and fourth linear combinations of Table 3 document how hiring changes when the incentives of the two main hiring actors are not aligned. The differences between each of these linear combinations highlight the importance of studying the incentives and relative leverage of both bureaucratic managers and politicians.
The most direct threat to causal inference in Table 3 is that of reverse causality, which would violate the assumption that there are no time-varying confounders. For example, the current specification assumes that the arrival of a clerk who is non-co-ethnic with the council majority in a locality that previously had no clerk causes the estimated negative effect on the interaction
 $ Majorit{y}_{ijt}\times Clerk\hskip0.3em presenc{e}_{it} $
(
 $ {\beta}_3 $
). In the presence of reverse causality, the effect could instead be driven by local authorities without a clerk being assigned a non-co-ethnic clerk after they start reducing their political patronage and start hiring more co-ethnics of the future clerk. Testing for reverse causality in this context is equivalent to testing for the presence of leads for
 $ Clerk\hskip0.3em presenc{e}_{it} $
and
 $ Clerk\hskip0.3em ethnicit{y}_{ijt} $
and their interactions with
 $ Majorit{y}_{ijt}. $
Table H.1 in the Supplementary Material presents the results of Equation 5 after including 1- and 2-year leads for these two variables and their interactions with
 $ Majorit{y}_{ijt} $
. All of the coefficients on the leading variables in Tables H.1 in the Supplementary Material are small and statistically insignificant. Reassuringly, the coefficients of interest from Table 3 remain significant and maintain the same direction as in Table 3.Footnote
35
Allocations across Positions
The previous section demonstrates the hiring bias of politicians versus the local clerk by capitalizing on cases in which their incentives diverge. Here, we conduct sub-sample analyses to determine how a clerk and local council solve the allocation problem when their incentives are misaligned.
When a local public bureaucracy is comprised of two different types of jobs that the two actors value differently, our model suggests that the relatively stronger actor will receive an allocation that includes more of their preferred type of position. The prediction for our specific empirical case is that clerks will favor individuals from their in-group for professional positions as well as some menial positions, while allocating other menial jobs to politicians.
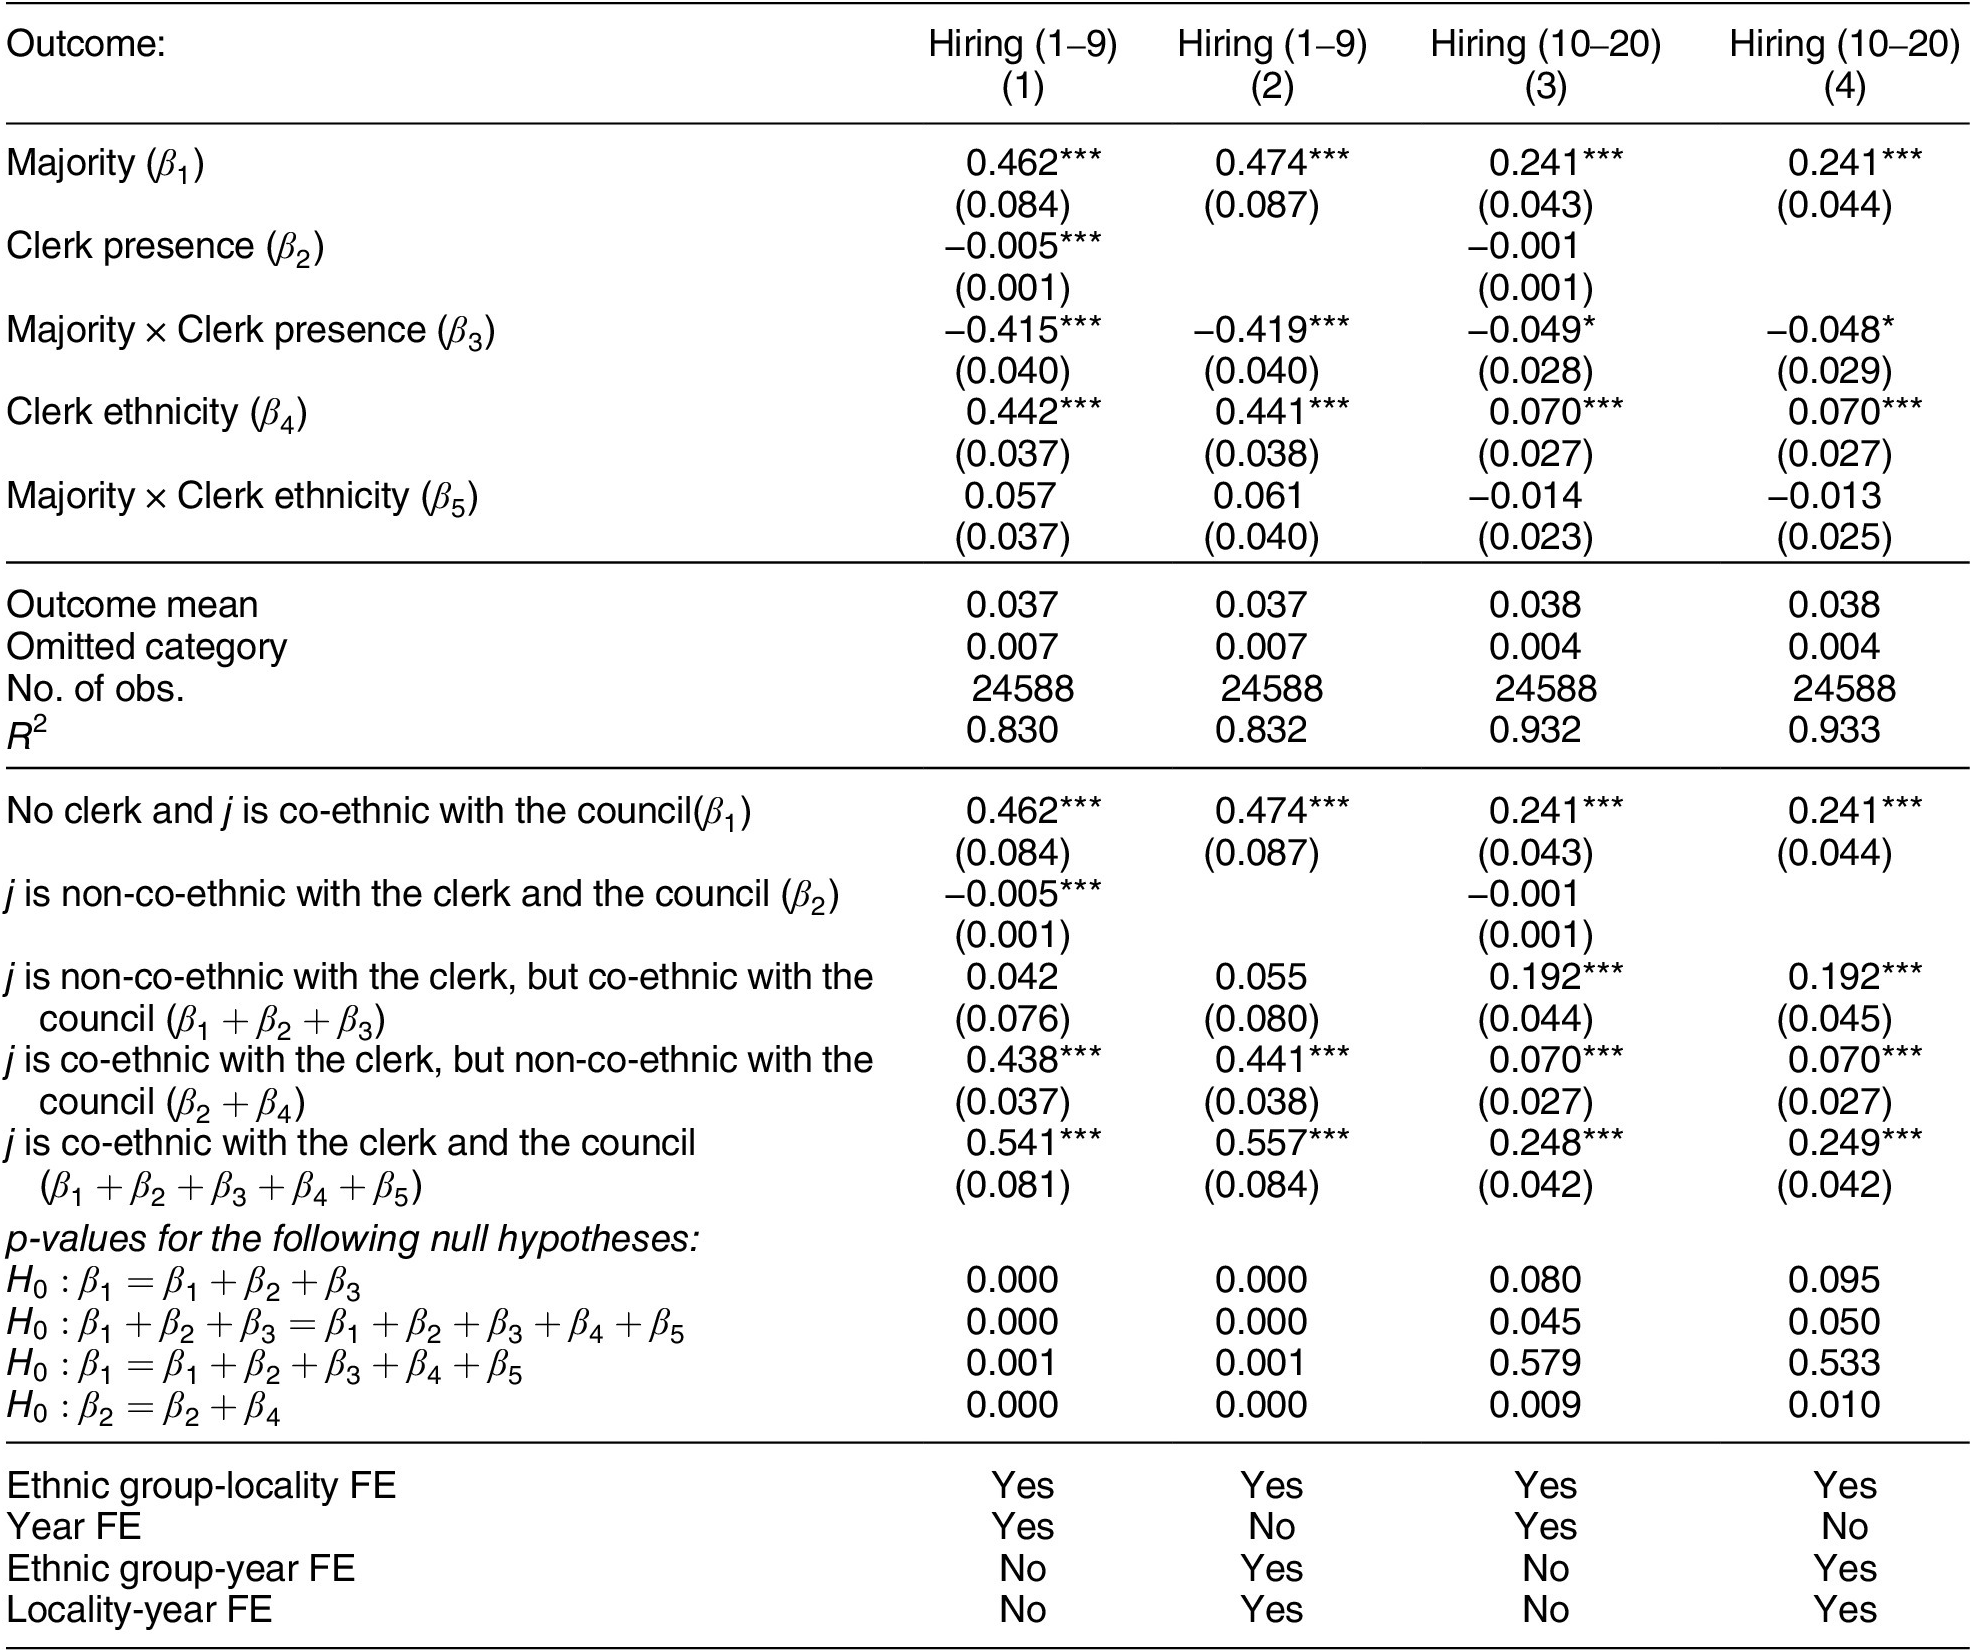
Table 4 confirms this prediction. The first two columns present the results only for professional bureaucrats, that is, those in salary groups 1–9. The coefficients
 $ {\beta}_4 $
on
 $ Majorit{y}_{ijt} $
and
 $ Clerk\hskip0.3em ethnicit{y}_{ijt} $
are again positive and statistically significant. The
 $ {\beta}_3 $
coefficient on the interaction
 $ Majority\hskip0.3em \times \hskip0.3em Clerk\hskip0.3em presenc{e}_{ijt} $
is also negative and statistically significant, similar to Table 3. The third and fourth columns of Table 4 present the results only for menial bureaucrats (salary groups 10–20). The
 $ {\beta}_1 $
and
 $ {\beta}_4 $
coefficients on
 $ Majorit{y}_{ijt} $
and
 $ Clerk\hskip0.3em ethnicit{y}_{ijt} $
are once again positive and significant. However, unlike in Table 3, the
 $ {\beta}_3 $
coefficient on
 $ Majority\times Clerk\hskip0.3em presenc{e}_{ijt} $
is no longer significant.
Hiring by Salary Groups

Note: Standard errors in parentheses. *
 $ p<0.10 $
, **
 $ p<0.05 $
, ***
 $ p<0.01. $
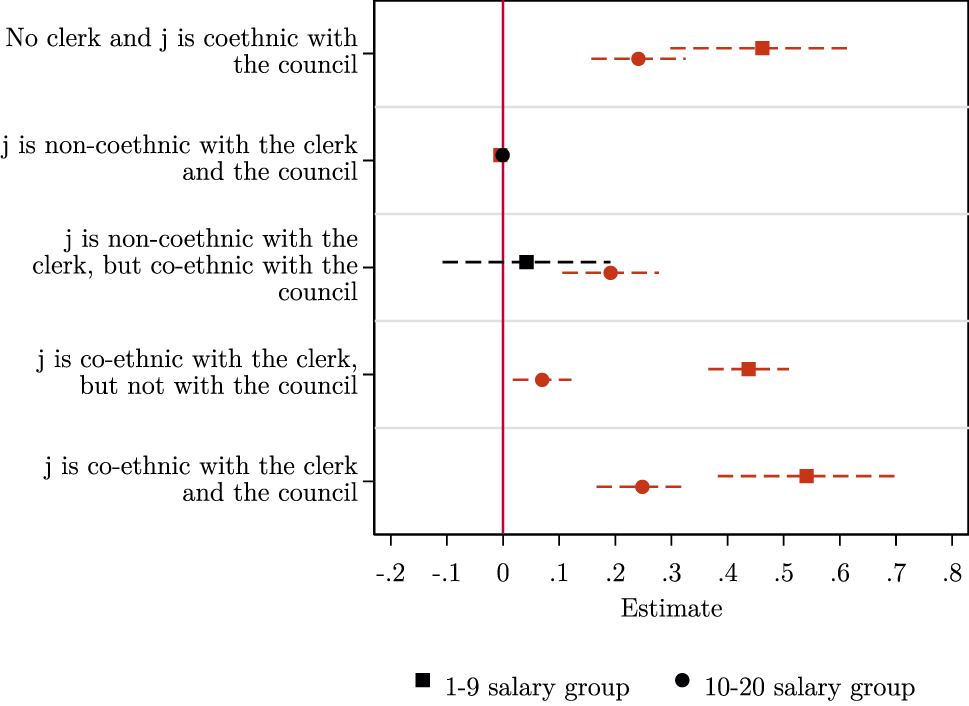
For ease of interpretation, Figure 5 plots the linear combinations shown in the first and third columns of the third panel from Table 4. The square points represent linear combinations from column 1 of Table 4 (concerning professional bureaucrats) and the circular points denote combinations from column 3 of Table 4 (concerning menial jobs). The bars represent 95% confidence intervals, so the points and bars in red indicate statistical significance at the 95% confidence level.
Linear Combinations from Table 4, Columns 1 and 3
Note: The bars represent 95% confidence intervals and the red coefficients depict statistically significant point estimates.

Figure 5 highlights that groups co-ethnic with the council enjoy a hiring premium in the absence of a clerk for both the 1–9 and 10–20 salary groups (
 $ {\beta}_1 $
). The same is true for groups that are co-ethnic with the clerk but not the council (
 $ {\beta}_2+{\beta}_4 $
) and those co-ethnic with both the clerk and the council (
 $ {\beta}_1+{\beta}_2+{\beta}_3+{\beta}_4+{\beta}_5 $
). The hiring premium is larger for the 1–9 salary groups for all three of these cases, suggesting that clerks and the council both place higher importance on placing in-group members in professional positions. Unsurprisingly, groups that are not co-ethnic with either the clerk or the council receive little or no hiring premium (
 $ {\beta}_2 $
). When there is a non-co-ethnic clerk and the incentives of the clerk and the council majority do not align, the clerk removes the local majority’s ethnic premium with respect to hiring (
 $ {\beta}_1+{\beta}_2+{\beta}_3 $
). Importantly, this is only true for professional bureaucrats.
Overall, these results document how managers and politicians solve the allocation problem by hiring in-group members to different levels of the salary scale. This is especially important because it helps resolve the tension that arises when these two actors are from different ethnic groups and thus have divergent preferences.
Alternative Explanations
In this section, we probe alternative interpretations of the results. First, in the context of Kenyan local authorities, the conceptual distinction between patronage and bureaucratic favoritism would be lost if clerks are themselves agents of political actors. Above we show that bureaucratic managers with preferences that are distinct from those of the council majority do not implement the patronage inclinations of local politicians and, in fact, hinder their attempts at patronage. Here, we consider the possibility that clerks who hire their co-ethnics are not pursuing their own interests but are instead implementing the wishes of national-level politicians such as local Members of Parliament (MPs). Indeed, past research on Kenya has shown that MPs and other national-level elites can exert influence over important bureaucrats to ensure they implement the national-level politicians’ interests (Hassan and Sheely Reference Hassan and Sheely2017). Following this alternative, clerks’ influence over hiring may therefore be a mechanism that the Ministry of Local Government wields to politically bolster favored MPs.
We explore whether clerks are indeed political agents of national-level politicians by examining additional interactions with the ethnicity of the relevant member of parliament. MP elections were held in 2002 and 2007. Local authorities are not necessarily congruent with or nested within constituencies, so most sit within two to four parliamentary constituencies. However, while 53% of localities overlap with multiple MP constituencies, there are no local authorities with multiple overlapping constituencies in which the elected MPs belong to different ethnic groups. We, therefore, define
 $ MP\hskip0.3em ethnicit{y}_{ijt} $
as an indicator equal to 1 if local authority i has an MP (or MPs in the case of overlapping constituencies) of ethnic group j in year t.
We modify Equation 5 to include the ethnicity of the relevant MP as well as the complete set of interactions with other variables. If clerks are indeed pawns of national politics, the same dynamics observed between the clerk and the council majority should be driven by the MP’s ethnicity. Most importantly, the coefficient on
 $ Clerk\hskip0.3em ethnicit{y}_{ij}\times MP\hskip0.3em ethnicit{y}_{ijt} $
—which represents the effect of a clerk who is co-ethnic with the relevant MP but not the council majority—should be positive and statistically significant. Table G.5 in the Supplementary Material reports the results from the specification, and the results reassuringly indicate that MP ethnicity does not affect hiring at the locality-level. The coefficients for the base term and each of the interactions are not significant, while the primary coefficients of interest from Table 3 retain their statistical significance and direction. These results therefore ease concerns that the clerks are pawns of national-level political elites.
Second, we address the concern that our findings regarding local elites’ leverage are driven by particularly politically relevant or well-connected ethnic groups. Past work on Kenya suggests that presidents’ co-ethnics enjoy more goods and services than other groups (Burgess et al. Reference Burgess, Jedwab, Miguel and Morjaria2015; Kramon and Posner Reference Kramon and Posner2016), so we investigate whether localities that are co-ethnic with the president experience different hiring outcomes by interacting our main explanatory variables with an indicator for localities whose politicians are majority Kikuyu. In addition, since the Ministry of Local Government oversees local authorities, we re-run this analysis with an indicator for localities whose politicians are aligned with the minister of local government (majority Luhya until 2008, majority Luo afterward). We run a similar specification as those for the first alternative argument after replacing MP ethnicity with either that of the president or minister of local government, and list the results in Tables G.3 and G.4 in the Supplementary Material, respectively. The coefficients for both new base terms and their interactions are not significant. Further, the main coefficients of interest from Table 3 retain their statistical significance. Taken together, our results do not appear to be driven by particularly well-connected ethnic groups.
A third alternative interpretation of the results in Table 4 is that local councils have more political weight than clerks and simply prefer hiring their in-group members to low-level positions rather than more professional ones (e.g., as in Brierley Reference Brierley2021). If true, the Kenyan context would fit in the top left cell of Table 1. We assess the feasibility of such an interpretation by studying heterogeneity in clerk tenure. The mean tenure for a clerk at any given local authority is only 1.8 years, indicating that they frequently rotate across jurisdictions and between Nairobi and local governments.
To test this third alternative, we focus on whether clerks are serving in their first year at a given local authority (32% of all ethnic group-locality-year observations have a clerk who is serving in their first year of service). We assume that clerks are relatively more independent from the council in their first year and can therefore more easily pull rank. If our interpretation of the results is correct, we should observe that clerks are more likely to realize their preferences in the first year.
We again modify Equation 5 to include an indicator
 $ Cler{k}^{\prime }s\hskip0.3em first\hskip0.3em yea{r}_{it} $
as well as the complete set of interactions with other variables. We re-run Equation 5 for the complete range of salary groups, only for professional positions in salary groups 1–9, and only for menial positions in salary groups 10–20. The results of these specifications are shown in Tables G.6–G.8 in the Supplementary Material. Overall, these results reinforce the interpretation that clerks are the more powerful actor. In Table G.6 in the Supplementary Material, the coefficient on
 $ Majorit{y}_{ijt}\times Cler{k}^{\prime }s\hskip0.3em first\hskip0.3em yea{r}_{ijt} $
is negative and significant, while the coefficient on
 $ Clerk\hskip0.3em ethnicit{y}_{ijt}\times Cler{k}^{\prime }s\hskip0.3em first\hskip0.3em yea{r}_{ijt} $
is positive and significant. This indicates that first-year clerks are better able to stifle politicians’ efforts to hire from their in-group, and can more easily favor their own co-ethnics. Splitting by salary groups, Tables G.7 and G.8 in the Supplementary Material indicate that these effects are entirely driven by hiring for professional positions. The coefficients on the
 $ Cler{k}^{\prime }s\hskip0.3em first\hskip0.3em yea{r}_{ijt} $
indicator are either much smaller or not significant for menial positions. In other words, clerks are more capable of executing their preferences when they are strongest in their first year in a local authority.
CONCLUSION
Public sector jobs confer individualized benefits to recipients. Past studies have found ample evidence that local elites have strong incentives to distribute these positions to their preferred individuals as private goods (Geddes Reference Geddes1994; Grindle Reference Grindle2012; Meyer-Sahling, Schuster, and Mikkelsen Reference Meyer-Sahling, Schuster and Mikkelsen2018). However, such research tends to separately examine the roles of elected politicians in distributing positions as political patronage and appointed bureaucratic managers in doling out jobs through bureaucratic favoritism or nepotism. These approaches can thus only provide a partial picture of hiring dynamics and risk overstating the role of either form of biased hiring at the expense of the other.
We combine these two approaches to build a theoretical model that considers local public sector hiring as an allocation problem between bureaucratic managers and politicians. Since managers tend to oversee the recruitment and hiring process, we model their ability to maximize their hiring preferences given the formal or informal leverage they hold vis-à-vis local politicians, as well as their relative preference over different types of positions. Our model predicts that hiring will reflect both political patronage and bureaucratic favoritism but that the level of each is a factor of the specific institutional environment: when the hiring preferences of these actors differ, the relatively stronger actor is able to bias hiring in the type of position it prefers more than the relatively weaker actor is able to.
We examine the model’s empirical implications by investigating who gets hired using a micro-level analysis of Kenyan payroll data. We use nearly a decade of individual-level administrative records across the country’s 175 local authorities to construct a dataset of almost 170,000 person-years. The results document clear evidence of both patronage and bureaucratic favoritism since both the local council majority and the clerk are able to hire their co-ethnics. As the theory predicts, when the two actors have conflicting preferences, these new hires are concentrated in different parts of the local bureaucracy. Local council majorities engage in co-ethnic patronage hiring in both professional and menial positions when there is no clerk, and the assignment of a co-ethnic clerk does not significantly change these dynamics. In contrast, the assignment of a clerk who is not co-ethnic with the local council majority eliminates the majority’s ability to hire their own co-ethnics to high-level positions. In these cases, the local council majority concentrates co-ethnic hires in low-level positions, while the clerk focuses on hiring members of her own in-group for professional positions.
These results have important implications for public policy and public administration. While many policymakers seek to implement public sector reforms that reign in politicians—sometimes by empowering appointed bureaucrats who are portrayed as impartial—our findings suggest that future reforms must also temper appointed officials’ ability to hire their preferred individuals into government. Addressing favoritism in public sector hiring requires considering the incentives of both politicians and appointed officials, not just one actor or the other. Simply put, bureaucratic incentives matter and cannot be assumed to always follow the rational-legal Weberian ideal. The incentives and capacities of unelected officials can have profound consequences on politics, and must be considered by future research on clientelism.
This article explores how bureaucratic managers shape patronage. However, our results stop short of discussing how biased hiring (by either politicians or managers) affects actual service delivery. It is unclear whether in-groupness among civil servants or between civil servants and politicians increases or decreases corruption. Moreover, even if in-groupness does in fact grease the wheels for individual instances of graft, co-ethnicity may simultaneously generate other efficiency gains—perhaps through easier communication channels, higher levels of inter-agency trust, or stronger bureaucratic motivation to serve politicians’ constituents—that offset or surmount any losses from corruption. We call on future work to evaluate the conditions under which bias in public sector hiring affects corruption, and more broadly, its overall impact on service delivery.
SUPPLEMENTARY MATERIAL
To view supplementary material for this article, please visit https://doi.org/10.1017/S0003055423001338.
DATA AVAILABILITY STATEMENT
Research documentation and data that support the findings of this study are openly available at the American Political Science Review Dataverse: https://doi.org/10.7910/DVN/MLZ39X.
ACKNOWLEDGMENTS
We thank Guy Grossman, Evgeniia Mitrokhina, Evgenia Olimpieva, and Noah Nathan as well as seminar participants at Harvard University, ITAM, the University of Chicago, University of Copenhagen, and the University of Wisconsin–Madison for helpful comments. We thank Daniel Posner for providing us with raw data and Teresa Lezcano Cadwallader and Tavneet Suri for assisting with the coordination of research assistants in Kenya. We also thank Khalid Hassan, Timothy Jones, Kirill Kalinin, Thomas O’Mealia, Manasi Rao, Michael Thompson-Brusstar, and Nicole Wu for research assistance. Larreguy gratefully acknowledges funding from the French Agence Nationale de la Recherche under the Investissement d’Avenir program ANR-17-EURE-0010.
CONFLICT OF INTEREST
The authors declare no ethical issues or conflicts of interests in this research.
ETHICAL STANDARDS
The authors affirm that this article adheres to the APSA’s Principles and Guidance on Human Subject Research.






Comments
No Comments have been published for this article.