Introduction
Whereas early efforts to uncover differences in cortical volume in patients with bipolar disorder (BD) did not reveal overall abnormalities (Pearlson et al. Reference Pearlson, Barta, Powers, Menon, Richards, Aylward, Federman, Chase, Petty and Tien1997), a recent study documented regional abnormalities in gray matter in several regions of the prefrontal cortex (PFC) (Lopez-Larson et al. Reference Lopez-Larson, DelBello, Zimmerman, Schwiers and Strakowski2002). Postmortem histopathologic studies have indicated reduced cell density in the dorsolateral PFC (DLPFC) (Rajkowska et al. Reference Rajkowska, Halaris and Selemon2001). Magnetic resonance spectroscopy (MRS) studies using 1H-MRS have reported findings of deceased N-acetyl aspartate, considered a marker of neuronal integrity, in the PFC of BD patients (Sassi et al. Reference Sassi, Stanley, Axelson, Brambilla, Nicoletti, Keshavan, Ramos, Ryan, Birmaher and Soares2005). Furthermore, there is increasing evidence that mitochondrial dysfunction is important for the pathophysiology of BD (Kato et al. Reference Kato, Takahashi, Shioiri and Inubushi1993; Kato & Kato, Reference Kato and Kato2000; Konradi et al. Reference Konradi, Eaton, MacDonald, Walsh, Benes and Heckers2004; Sun et al. Reference Sun, Wang, Tseng and Young2006). It is known that mitochondrial dysfunction increases anaerobic energy production and lactate production, and a recent study reported increased levels of gray-matter lactate in patients with BD (Dager et al. Reference Dager, Friedman, Parow, Demopulos, Stoll, Lyoo, Dunner and Renshaw2004). Collectively, these findings suggest subtle cytoarchitectural or neurophysiological abnormalities in the PFC of patients with BD.
Studies that employed functional magnetic resonance imaging (fMRI) reported abnormal PFC activity in patients with BD using various cognitive tasks, including verbal fluency (VF) (Curtis et al. Reference Curtis, Dixon, Morris, Bullmore, Brammer, Williams, Sharma, Murray and McGuire2001), the Stroop task (Blumberg et al. Reference Blumberg, Leung, Skudlarski, Lacadie, Fredericks, Harris, Charney, Gore, Krystal and Peterson2003), working memory (WM) (Adler et al. Reference Adler, Holland, Schmithorst, Tuchfarber and Strakowski2004; Monks et al. Reference Monks, Thompson, Bullmore, Suckling, Brammer, Williams, Simmons, Giles, Lloyd, Harrison, Seal, Murray, Ferrier, Young and Curtis2004) and the continuous performance test (Strakowski et al. Reference Strakowski, Adler, Holland, Mills and DelBello2004). Whereas one study reported a trait abnormality of blunted activation in the left ventral PFC in BD patients (Blumberg et al. Reference Blumberg, Leung, Skudlarski, Lacadie, Fredericks, Harris, Charney, Gore, Krystal and Peterson2003), several fMRI studies reported increased frontal signals during cognitive activation in euthymic (Adler et al. Reference Adler, Holland, Schmithorst, Tuchfarber and Strakowski2004; Strakowski et al. Reference Strakowski, Adler, Holland, Mills and DelBello2004) and manic BD patients (Blumberg et al. Reference Blumberg, Leung, Skudlarski, Lacadie, Fredericks, Harris, Charney, Gore, Krystal and Peterson2003), although one study observed reductions in bilateral frontal activation and increased activations with the left precentral, right medial frontal and left supramarginal gyri in BD patients during a two-back WM task (Monks et al. Reference Monks, Thompson, Bullmore, Suckling, Brammer, Williams, Simmons, Giles, Lloyd, Harrison, Seal, Murray, Ferrier, Young and Curtis2004). Results of these studies generally suggested abnormal regional cerebral blood flow (rCBF) control in response to cognitive demands in BD. However, the findings were contradictory between studies in terms of hyper-/hypo-frontality, with a lack of the manipulation of cognitive demand, which makes it difficult to compare results.
A most recently developed non-invasive method of studying cerebral activation, transcranial near-infrared spectroscopy (NIRS) (Jobsis, Reference Jobsis1977), utilizes optical technology to monitor cerebral oxygenation and hemodynamics (Jobsis, Reference Jobsis1977). Continuous-wave NIRS systems utilizing differential spectroscopy can measure relative but quantitative changes in oxygenated hemoglobin (HbO2) and deoxygenated hemoglobin (HbR) from baseline. This methodology has been used to assess PFC function in healthy adult subjects (Villringer et al. Reference Villringer, Planck, Hock, Schleinkofer and Dirnagl1993; Fallgatter & Strik, Reference Fallgatter and Strik1998; Toichi et al. Reference Toichi, Findling, Kubota, Calabrese, Wiznitzer, McNamara and Yamamoto2004; Kubota et al. Reference Kubota, Toichi, Shimizu, Mason, Findling, Yamamoto and Calabrese2006) and has been successfully utilized to demonstrate bilateral reduced frontal activation during a VF task in depressed patients (Herrmann et al. Reference Herrmann, Ehlis and Fallgatter2004), patients with schizophrenia (Kubota et al. Reference Kubota, Toichi, Shimizu, Mason, Coconcea, Findling, Yamamoto and Calabrese2005) and also in euthymic (Matsuo et al. Reference Matsuo, Kato and Kato2002) and depressed (Kameyama et al. Reference Kameyama, Fukuda, Yamagishi, Sato, Uehara, Ito, Suto and Mikuni2006) patients with BD. Furthermore, a recent fMRI/NIRS combination study observed functional asymmetry of prefrontal activation during a WM task in patients with schizophrenia (Lee et al. Reference Lee, Folley, Gore and Park2008). The concordance of fMRI and NIRS data supports NIRS as a useful functional neuroimaging method for psychiatric research.
Recent advances in NIRS technology have enabled absolute measurement of tissue oxygen saturation using a spatially resolved spectroscopy (SRS) system. In the present study, we used a two-channel SRS system (NIRO-300; Hamamatsu Photonics, Japan), which can measure the tissue oxygenation index (TOI), represented by the ratio of HbO2 concentration to total hemoglobin (HbT) concentration [i.e. HbO2 concentration+deoxygenated hemoglobin (HbR) concentration] in cerebral tissue. TOI has been used to monitor cortical oxygenation during neurosurgical intervention (Al-Rawi & Kirkpatrick, Reference Al-Rawi and Kirkpatrick2006). NIRO-300 enables the assessment of TOI every 2 s continuously for more than 1 h in an ordinary experimental room setting well tolerated by psychiatric patients; however, no study has investigated TOI changes during cognitive task performance in patients with BD.
The aim of the present NIRS study was to investigate PFC hemodynamics in adult patients with BD using a cognitive test battery, including a simple attention task as well as verbal- and non-verbal higher cognitive tasks. Previously, we have reported a specific pattern of PFC oxygenation in healthy subjects during the attention task. The observed oxygenation patterns were distinct from those typically observed during higher cognitive tasks, such as VF, suggestive of more excessive prefrontal oxygen consumption during attentional processing (Toichi et al. Reference Toichi, Findling, Kubota, Calabrese, Wiznitzer, McNamara and Yamamoto2004). Based on this and a previous NIRS study reporting hypofrontality during VF in BD patients (Matsuo et al. Reference Matsuo, Watanabe, Onodera, Kato and Kato2004), we hypothesized that task-specific abnormal cortical oxygenation in the PFC of patients with BD might be detected by NIRS when contrasting attention versus higher cognitive tasks.
Methods
Subjects
Subjects were recruited from the Mood Disorder Program, Department of Psychiatry, Case Western Reserve University/University Hospitals Case Medical Center from April 2002 through March 2003. The inclusion criteria for patients with BD were the following: (1) patients aged 18–65 years (inclusive) who met DSM-IV criteria for bipolar I disorder, which was confirmed by the Structured Clinical Interview for DSM-IV-TR Axis I Disorders, Research Version, Patient Edition (First et al. Reference First, Spitzer, Gibbon and Williams2002) and assessment by a physician; (2) patients who were strongly right-handed as assessed by the Edinburgh Handedness Inventory (Oldfield, Reference Oldfield1971). The exclusion criteria were: (1) patients with neurological disorders or brain injury; (2) patients who may have a general medical condition or neurological condition that may be considered the etiology of patients' mood disorder; (3) patients who had a history within the past 6 months of substance abuse/dependence.
Inclusion criteria for comparison subjects were: (1) aged 18–65 years (inclusive); (2) subjects who did not have a history of psychiatric illness as assessed by the Mini-International Neuropsychiatric Interview (Sheehan et al. Reference Sheehan, Lecrubier, Sheehan, Amorim, Janavs, Weiller, Hergueta, Baker and Dunbar1998); (3) subjects who were strongly right-handed as assessed by the Edinburgh Handedness Inventory. The University Hospitals of Cleveland Institutional Review Board for Human Investigation approved the protocol of this study.
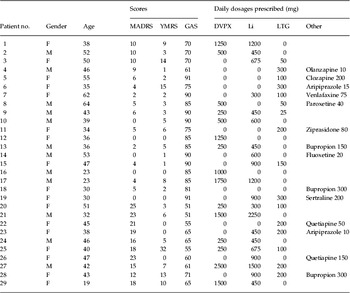
Twenty-nine patients with BD (17 male, 12 female) and 27 healthy comparison subjects (15 male, 12 female) participated. All study participants provided written informed consent after the procedures had been fully described. The mood states and global functioning of the patients with BD were assessed by the Montgomery–Asberg Depression Rating Scale (MADRS; Montgomery & Asberg, Reference Montgomery and Asberg1979), the Young Mania Rating Scale (Young, Reference Wechsler1978) and the Global Assessment Scale (Endicott et al. Reference Endicott, Spitzer, Fleiss and Cohen1976). Clinical data of the BD patients are given in Table 1. The mean age of onset illness was 21.5 years (range 15–33 years) and the mean duration of illness was 18.8 years (range 2–42 years). Five of our patients with BD have a history of hospitalization, seven experienced psychotic episodes, 12 were rapid cyclers and 12 showed mixed state. The bipolar and comparison groups were matched for age [41.3 years (s.d.=11.0) years and 39.8 years (s.d.=14.1 years), respectively], for verbal abilities as assessed by the Wechsler Adult Intelligence Scale – Revised (Wechsler, Reference Wechsler1981) [45.2 (s.d.=11.0) and 46.2 (s.d.=8.7), respectively] and for years of education [15.4 (s.d.=2.0) and 15.1 (s.d.=1.3), respectively; all t values <0.369, all p values >0.093). There was no difference in the gender ratio between groups (χ2, p=0.285).
Demographic and clinical characteristics of subjects in the bipolar group

F, Female; M, male; MADRS, Montgomery–Asberg Depression Rating Scale; YMRS, Young Mania Rating Scale; GAS, Global Assessment Scale; DVPX, divalproex sodium; Li, lithium carbonate; LTG, lamotorigine.
Cognitive tasks
Verbal tasks
Verbal tasks consisted of category and letter fluency tasks (CF and LF, respectively). Subjects were asked to generate as many words as possible that belonged to a given semantic category (‘vehicles’, ‘furniture’, ‘vegetables’, ‘metals’, ‘insects’ and ‘carpenter's tools’ each for 15 s), or that began with a given letter (F, A, S, P, G, and R, each for 15 s). The baseline task was pronouncing the ‘da’ sound every 1 s (30 s), using a signal (an asterisk) that appeared on a computer display. The word fluency tasks have been known to activate the DLPFC (Curtis et al. Reference Curtis, Bullmore, Brammer, Wright, Williams, Morris, Sharma, Murray and McGuire1998; Audenaert et al. Reference Audenaert, Brans, Van Laere, Lahorte, Versijpt, van Heeringen and Dierckx2000).
Non-verbal visual tasks
In Set A and Set B of Raven's Colored Progressive Matrices (Raven, Reference Raven1962) (RCPM-A and RCPM-B, respectively), subjects were shown a figural pattern with a missing part, and then asked to select (by pointing) one of six alternatives that best completed the pattern. The items in Set A, which require only figural reasoning, are less difficult than the items in Set B that also require analytical (logical) reasoning. The order of the three sets was counterbalanced among subjects, and tasks were conducted at a self-paced rate. During the baseline task for RCPM, subjects had to choose between one of six figural patterns that was identical to the original pattern shown (30 s). The task was conducted using a booklet, and consisted of five items. In all subjects, RCPM was preceded by the baseline task. Short breaks (between the sets of RCPM or between the baseline task and RCPM) were given to subjects upon request. It has been confirmed that RCPM leads to activation of the DLPFC (Esposito et al. Reference Esposito, Kirkby, Van Horn, Ellmore and Berman1999).
Attention task
In the letter cancellation test (LCT), a typical task of attention, subjects were asked to cross out all the E's and C's in rows of letters in 60 s. In the baseline task, which preceded the LCT, subjects were instructed to cross out all the letters in rows of letters (a total of 30 letters) at a rate of one letter per s according to a digital sound. The baseline and main tasks were conducted successively without breaks.
Measurements
Hemodynamic changes in the PFC were measured by a two-channel NIRS system (NIRO 300; Hamamatsu Photonics, Shizuoka, Japan). A pair of optodes (a light emitter and a detector) was bilaterally attached to the forehead of a subject. A light detector was placed at the position of Fp1 and Fp2 according to the international 10–20 electrode system. A light emitter was placed 4 cm lateral to the corresponding emitter on the line that linked Fp1 to F7 or Fp2 to F8. The optode positioning procedure is detailed elsewhere (Toichi et al. Reference Toichi, Findling, Kubota, Calabrese, Wiznitzer, McNamara and Yamamoto2004).
Changes in HbO2 concentration, HbR concentration and the TOI were measured using four different wavelengths (775, 810, 870 and 904 nm) of near infrared light (Cope & Delpy, Reference Cope and Delpy1988). The cerebral tissue examined by NIRS is supposed to be a banana-shaped region between the two optodes (Gratton et al. Reference Gratton, Maier, Fabinai, Mantulin and Gratton1994). By assuming the differential pathlength factor to be 6.0 (van der Zee et al. Reference van der Zee, Cope, Arridge, Essenpreis, Potter, Edwards, Wyatt, McCormick, Roth, Reynolds and Delpy1992; Duncan et al. Reference Duncan, Meek, Clemence, Elwell, Tyszczuk, Cope and Delpy1995), the measure of change in HbO2 concentration and HbR concentration is considered to be expressed in μmol/l. On the other hand, TOI was measured by SRS, an NIRS method using the multi-distance approach that does not need the above-mentioned assumption of DPF (Matcher et al. Reference Matcher, Elwell, Cooper, Cope and Delpy1995). The sampling frequency for measurements was every 2 s. Measurements took 30–40 min. All subjects were in a sitting position throughout all measurements.
Data analyses
In each subject, the average changes in HbO2 concentration and HbR concentration from the baseline were calculated for active task conditions (the first 10 s under each condition were excluded) for the word fluency tasks and the LCT. For RCPM, the average changes from the baseline during the performance of the last three correctly answered items in Set A and those of Set B was calculated (approximately 20 s each). The average TOI was calculated for baseline and task conditions. The TOI baseline value was computed by averaging the values of TOI during the period before each task for each subject (i.e. mean of the baseline before LF, CF, LCT and RCPMs).
Statistical analyses were performed using the SPSS software (version 11.0; SPSS Inc., Chicago, IL, USA). Unpaired t tests were used to compare performance in cognitive tasks between groups. Data were analysed using a group (bipolar, comparison)×hemisphere (left, right)×condition repeated-measures analysis of variance (ANOVA), using simple effects contrasts to compare the change in activation versus baseline for each subsequent task (LF, CF, RCPM-A, RCPM-B, LCT). Fisher's least significant difference test was used for post hoc comparisons.
Results
Performance in cognitive tasks
The number of generated words for LF and CF was 33.2 (s.d.=8.4) and 32.8 (s.d.=7.3) in the bipolar group, and 36.9 (s.d.=9.3) and 36.5 (s.d.=7.4) in the comparison group, respectively. There were no differences in the performance of LF and CF between bipolar and comparison groups (t=1.54, df=54, p=0.129, for LF; t=1.92, df=54, p=0.061, for CF). Performance for RCPM-A (full score 12) and RCPM-B (full score 12) was 10.6 (s.d.=0.9) and 10.1 (s.d.=1.8) in the bipolar group, and 11.3 (s.d.=1.1) and 11.0 (s.d.=1.0) in the comparison group. The number of correct cancellations, commission errors and omission errors in the LCT was 49.3 (s.d.=10.9), 0.34 (s.d.=1.7) and 1.9 (s.d.=1.9) in the bipolar group, and 59.1 (s.d.=12.4), 0.0 (s.d.=0.0) and 1.3 (s.d.=1.6) in the comparison group. There were significant differences between the groups in the performance of RCPM-A (t=2.42, df=54, p=0.019, two-tailed), RCPM-B (t=2.30, df=54, p=0.025, two-tailed) and correct cancellation of the LCT (t=3.14, df=54, p=0.003, two-tailed).
Tissue hemoglobin saturation during rest and tasks
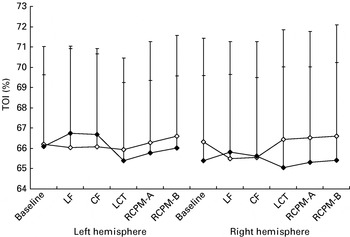
Group×task×hemisphere ANOVA on TOI yielded no significant main effect of group [F(1, 53)=0.081, p=0.777], task [F(1, 54)=0.494, p=0.781] or hemisphere [F(1, 54)=0.143, p=0.707]. There was a significant group×task interaction (F(5, 270)=2.528, p=0.029], with no two-way interaction [F(5, 270)=0.186, p=0.968]. This indicated that the BD group and control group showed different patterns of TOI level change across the different cognitive tasks. There was also a task×hemisphere interaction [F(5, 270)=3.009, p=0.012], suggesting that left dominant activation was more prominent in verbal tasks. Post hoc simple effects comparisons on TOI revealed no significant main effect. This is because variations in the TOI value between individuals are relatively large compared with task-related effects (Fig. 1).
Tissue hemoglobin saturation under baseline and task conditions for left and right hemispheres in patients with bipolar disorder (–•–) and normal controls (–◆–). LF, Letter fluency task; CF, category fluency task; LCT, letter cancellation test; RCPM-A, Set A of Raven's Colored Progressive Matrices; RCPM-B, Set B of Raven's Colored Progressive Matrices. Values are means, with standard deviations represented by vertical bars. Note that relatively large between-subject differences of tissue oxygenation index (TOI) are found in the baseline condition, which partly explained apparently large between-subjects differences in TOI increases.

In order to further investigate task-related abnormal hemodynamic responses in BD, a group×task×hemisphere ANOVA on the increase of TOI from the baseline (ΔTOI) was performed, which yielded no significant main effect of group [F(1, 54)=0.559, p=0.458], task [F(1, 54)=0.508, p=0.730] or hemisphere [F(1, 54)=0.768, p=0.385]. There was a significant group×task interaction [F(4, 216)=2.595, p=0.037], with no two-way interaction [F(4, 216)=0.157, p=0.960]. Post hoc simple effects comparison on ΔTOI revealed that the BD group showed a significantly smaller increase for LF (p=0.004) and CF (p=0.016) than the comparison group, with no significant difference for the LCT (p=0.191), RCPM-A (p=0.334) or RCPM-B (p=0.275). There was also a significant task×hemisphere interaction [F(4, 216)=3.114, p=0.016]. Post hoc simple effects comparison revealed that participants, regardless of the diagnostic group, showed significantly increased left hemispheric activation in LF (p=0.048) and a trend of left dominant activation in CF (p=0.053) compared with the LCT. Together, these results indicate that the BD group showed lower levels of TOI, especially during verbal tasks (LF and CF), although their performance was not impaired.
In order to investigate the possible effect of mood states on the TOI level, additional analysis using a subgroup×task×hemisphere ANOVA was conducted to compare the two bipolar subgroups, i.e. the bipolar subgroup with modest but distinct depressive symptoms (n=19; MADRS, mean=19, range 12–25) and without depressive symptoms (n=10; MADRS, mean=4, range 0–10). There was no main effect for subgroup [F(1, 27)=1.04, p=0.317]. Subgroup also did not significantly interact with task [F(5, 135)=0.31, p=0.909], but there was a significant subgroup×hemisphere interaction [F(1, 27)=6.30, p=0.018), with no three-way interaction. This is because the depressive subgroup, relative to the euthymic subgroup, showed a significantly higher TOI in the left hemisphere during baseline (p=0.050) as well as the LCT (p=0.049) and RCPM-B (p=0.045).
Changes in hemoglobin concentration due to cognitive activation
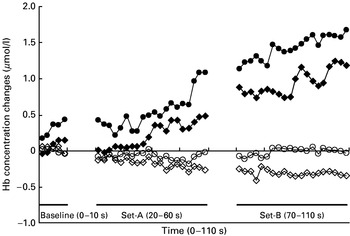
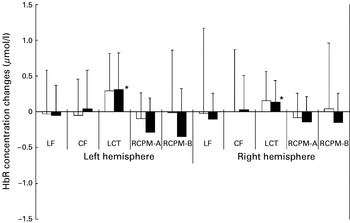
In most subjects, HbO2 concentration increased with a concurrent decrease in HbR concentration during activation in LF, CF, RCPM-A and RCPM-B, as shown in Fig. 2. In the attention task (LCT), on the other hand, both HbO2 concentration and HbR concentration increased. This finding is reported in our previous study that compared hemodynamic changes due to attention versus higher cognitive processing (Toichi et al. Reference Toichi, Findling, Kubota, Calabrese, Wiznitzer, McNamara and Yamamoto2004).
Trajectories of mean oxygenated hemoglobin (HbO2) and deoxygenated hemoglobin (HbR) concentration changes in patients with bipolar disorder (BD) and normal controls for the left hemisphere. A bar above ‘Baseline’, ‘Set A’ and ‘Set B’ indicates the period during which the patient was performing the baseline task and Set A and Set B of Raven's Colored Progressive Matrices. –•–, HbO2 concentration change for BD patients; –◆–, HbO2 concentration change for normal controls; –○–, HbR concentration change for BD patients; –•–, HbR concentration change for normal controls.

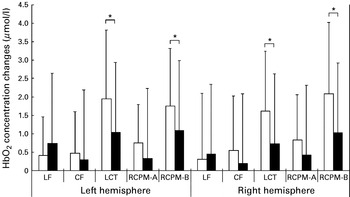
A group×hemisphere×task ANOVA on HbO2 concentration revealed a significant main effect of task [F(4, 216)=12.296, p<0.001], but the main effect of hemisphere [F(1, 54)=0.513, p=0.477] was not significant. There was a non-significant trend of group effect [F(1, 54)=3.051, p=0.086], suggestive of relatively prominent HbO2 concentration increase in the BP group. There was significant group×task interaction [F(4, 216)=2.508, p=0.043), with no significant group×hemisphere [F(1, 54)=0.700, p=0.407), task×hemisphere interaction [F(4, 216)=1.770, p=0.136] or two-way interactions [F(4, 216)=0.363, p=0.835]. This again indicated that PFC oxygenation levels were different between the groups in a task-dependent manner (Fig. 3). Post hoc simple effects comparison revealed that BD patients showed a more prominent increase of HbO2 concentration compared with healthy controls in the LCT (p=0.001) and in RCPM-B (p=0.002), but not in LF (p=0.408), CF (p=0.332) and RCPM-A (p=0.129). These results indicate more prominent cortical oxygenation in the bipolar group, especially in the attention-demanding task (LCT) and the non-verbal higher cognitive task (RCPM-B), although their performance was compromised (Figs 3 and 4).
Changes from baseline in oxygenated hemoglobin (HbO2) concentration due to cognitive tasks in patients with bipolar disorders (□) and normal controls (■). Values are means, with standard deviations represented by vertical bars. LF, Letter fluency task; CF, category fluency task; LCT, letter cancellation test; RCPM-A, Set A of Raven's Colored Progressive Matrices; RCPM-B, Set B of Raven's Colored Progressive Matrices. * Post hoc analyses following a group×task×hemisphere analysis of variance on HbO2 concentration revealed that the bipolar disorder group showed a greater increase in HbO2 concentration in the LCT and in RCPM-B, relative to controls (p<0.005).

Changes from baseline in deoxygenated hemoglobin (HbR) concentration due to cognitive tasks in patients with bipolar disorders (□) and normal controls (■). Values are means, with standard deviations represented by vertical bars. LF, Letter fluency task; CF, category fluency task; LCT, letter cancellation test; RCPM-A, Set A of Raven's Colored Progressive Matrices; RCPM-B, Set B of Raven's Colored Progressive Matrices. * Post hoc analysis following a group×task×hemisphere analysis of variance on HbR concentration revealed that both groups showed a greater increase in HbR concentration in the LCT compared with the other tasks (p<0.005). Note that the graph indicates net increases of Hb concentration from a baseline value (ΔHb concentration) and not changes in the absolute value of Hb concentration in the scanned region. ΔHb concentration showed modest increases by cognitive activation when compared with apparently large between-subjects differences of Hb concentration.

A group×hemisphere×task ANOVA on HbR concentration revealed a significant main effect of task [F(4, 216)=6.819, p<0.001], but the main effect of hemisphere [F(1, 54)=0.028, p=0.868] and group [F(1, 54)=0.069, p=0.794) was not significant. There were no significant interactions. Post hoc analysis indicated that subjects, regardless of the diagnostic group, showed a significantly increased HbR concentration in the LCT compared with an HbR concentration increase in LF (p<0.001), CF (p=0.001), RCPM-A (p<0.001) and RCPM-B (p<0.001) (Fig. 4).
Discussion
To our knowledge, these data represent the first efforts to elucidate task-specific abnormal PFC oxygenation in patients with BD by using two hemodynamic parameters, TOI and HbO2, and multiple-task paradigms. No other imaging studies on BD have investigated prefrontal oxygenation across various cognitive task conditions, and the present finding of TOI, which was examined for the first time in BD patients, as well as that of HbO2 concentration, commonly indicated task-specific abnormality of PFC activation in subjects with BD.
During verbal processing requiring executive/WM components (LF and CF), comparison subjects showed clear cortical oxygenation, as indicated in TOI increase, with relatively moderate TOI increase during the simple attention task (LCT) or figural processing (RCPMs), which was in accordance with our previous finding (Toichi et al. Reference Toichi, Findling, Kubota, Calabrese, Wiznitzer, McNamara and Yamamoto2004). On the other hand, the BD group showed relatively attenuated TOI increase during verbal processing, although performance was not significantly impaired. It has been demonstrated that TOI, corresponding to the ratio of HbO2 concentration to HbT concentration in cerebral tissue, is affected by changes in arterial blood supply. For example, a reduction in rCBF led to a decrease in HbO2 concentration with an increase in HbR concentration, resulting in a decrease in TOI (Kuroda et al. Reference Kuroda, Houkin, Abe, Hoshi and Tamura1996; Krakow et al. Reference Krakow, Ries, Daffertshofer and Hennerici2000). That the result of atypical patterns of TOI changed across task conditions between groups suggested that rCBF control in the PFC of BD might be abnormally related to different cognitive demands.
The changes of HbO2 concentration also showed a task-specific atypical response in the BD group. During the LCT and RCPM-B, BD patients showed a greater HbO2 concentration increase when compared with healthy subjects. This is largely in line with a previous NIRS study reporting attenuated prefrontal activity during VF in BD (Kameyama et al. Reference Kameyama, Fukuda, Yamagishi, Sato, Uehara, Ito, Suto and Mikuni2006). The observed abnormal hyperoxygenation in the BD patients during visual/attentional processing was not attributable to the performance level difference, since the BD group showed relatively lower performance in the LCT and RCPM-B. Rather, it suggested that visual/attentional processing might induce a relatively higher level of oxygenation in the PFC of BD. The observed HbO2 concentration change pattern was largely in line with the TOI change discussed above, although it should be noted that the result of HbO2 concentration change could not be discussed as directly relating to the TOI value, since the HbO2 concentration value measured here changed from an arbitrary baseline, while TOI was expressed as an absolute value (percentage of HbO2 concentration to HbT concentration). It can be safely argued that the changes in both indices indicated a discrepancy in the function of the PFC between verbal versus non-verbal (figural/attentional) tasks in BD.
A previous NIRS study on healthy subjects reported that PFC hemodynamics showed two distinct patterns of HbO2 concentration and HbR concentration changes that reflected higher cognitive processing versus attention, respectively. Whereas the typical pattern for higher cognitive tasks is HbO2 concentration increase concomitant with HbR concentration decrease, attention tasks typically induced an increase of HbO2 concentration as well as a slight increase of HbR concentration (Fallgatter & Strik, Reference Fallgatter and Strik1997; Toichi et al. Reference Toichi, Findling, Kubota, Calabrese, Wiznitzer, McNamara and Yamamoto2004). This pattern was also confirmed in the present study, suggesting that the utilization of oxygen in the PFC during attentional tasks seemed to be enhanced in healthy subjects as well as in BD patients.
As we hypothesized, in terms of PFC oxygenation, BD subjects showed an opposite tendency when contrasting higher verbal tasks with attentional/visual tasks. Compared with in healthy subjects, the BD group showed modest oxygenation in higher verbal tasks and prominent oxygenation in relatively simple visual/attentional tasks. Although the neurophysiological background of this tendency is not clear, one hypothesis is that possible subcortical pathophysiology might underlie the paradoxical PFC oxygenation pattern in BD. A previous study investigating hemodynamic changes in the PFC due to electrical stimulation of the deep brain reported an increase of both HbO2 concentration and HbR concentration during high-frequency stimulation of the thalamus (Sakatani et al. Reference Sakatani, Katayama, Yamamoto and Suzuki1999). Similar overexcitement of the subcortical attention system in BD might induce the prominent HbO2 concentration increase concomitant with HbR concentration increase. Another hypothesis is that there might be abnormality of more widespread neural circuitries involving the PFC as well as other cortical regions in BD. For example, VFs are known to activate the PFC as well as temporal structures in healthy subjects (Mummery et al. Reference Mummery, Patterson, Hodges and Wise1996), and it is possible that our subjects with BD might recruit neural circuitries involving prefrontal and temporal lobes differently when compared with healthy subjects. This possibility needs to be further explored by using a multi-channel NIRS system covering the fronto-temporal cortical areas. Finally, there is a possibility that the possible oxygen metabolism pathophysiology in BD might be directly related to atypical PFC oxygenation. Recent studies suggested the tendency of anaerobic energy production or a shift from oxidative phosphorylation toward glycolysis in the PFC of BD patients (Dager et al. Reference Dager, Friedman, Parow, Demopulos, Stoll, Lyoo, Dunner and Renshaw2004), which might partly explain the relatively modest PFC oxygenation during VF in BD.
The TOI level in the left DLPFC was higher than that in the right DLPFC in both groups, which was observed in the resting condition as well as task conditions. This tendency was more prominent in VF, suggesting that verbal processing induced left-dominant activation. Interestingly, additional analysis of TOI revealed that BD patients with moderate depressive symptoms showed a significantly higher TOI level in the left PFC under resting conditions as well as the LCT and RCPM-B. The result implied that depressive symptoms might be related to increased rCBF in the left PFC.
There are some limitations of this study. One is associated with the technique of NIRS, as the spatial resolution of NIRS is limited and the exact localization of the optodes on the brain surface was not conducted using MRI. Hemodynamic changes in other cortical areas need to be examined by a multi-channel NIRS approach; however, it should be noted that TOI measurement was made possible only by the present two-channel system and, to our knowledge, other multi-channel NIRS systems commercially available at present cannot assess the TOI level. Another limitation is the possible influence of medication on the results of this study. Recent studies reported decreased activation during verbal tasks in lithium-treated euthymic BD patients (Silverstone et al. Reference Silverstone, Bell, Willson, Dave and Wilman2005) or lithium- and sodium valproate-treated healthy subjects (Bell et al. Reference Bell, Willson, Wilman, Dave and Silverstone2005). Finally, a longitudinal study with a repeated-measures design in a different mood state is needed in order to determine whether the left-hemisphere activation revealed by TOI is a trait maker.
Acknowledgements
This work was conducted as part of the Mood Disorders Program, Department of Psychiatry, Case Western Reserve University/University Hospitals Case Medical Center (Ohio, USA). This work was supported by NIMH P20 MH-66054. Y.K. is supported by a research fellowship of the Uehara Memorial Foundation (Japan).
Declaration of Interest
None.