1 Introduction
Stop length distinctions are usually characterized by differences in the length of stop closure: geminates have longer and singletons have shorter closure durations. Although durational differences in stop closure may be robust under certain conditions, there is considerable cross-linguistic variation in the phonetic realization of stop length distinctions (Ham Reference Ham2001).
For a variety of languages, researchers have reported that the consonant length distinction is accompanied by multiple acoustic correlates such as duration of other segments or non-durational features of the surrounding vowels (Lisker Reference Lisker1958; Abramson Reference Abramson1987; Ham Reference Ham2001; Idemaru Reference Idemaru2005; Payne Reference Payne2005, Reference Payne2006). Further work has investigated whether some of these acoustic correlates are involved in the perception of the length distinction (Abramson Reference Abramson1992, Ofuka, Mori & Kiritani Reference Ofuka, Mori and Kiritani2005, Kawahara Reference Kawahara2006b). Acoustic correlates (covariants) of the stop length distinction may play an important role in the perceptual distinction of the contrasting sounds. It has been well documented that variation in speech rate has extensive influence on durational features of speech sounds, with slower rates lengthening the segment and faster rates shortening it. One crucial consequence of this variation is that important durational values, such as typical singleton and geminate closure durations and the boundary location between them, also change. This may result in an overlap between contrasting length categories in terms of stop closure duration (Fujisaki Reference Fujisaki, Lindblom and Öhman1979, Hirata & Whiton Reference Hirata and Whiton2005).
Previous research offers evidence that linguistic contrasts may be correlated with several acoustic characteristics. For example, research on the voicing contrast in English stops has presented convincing evidence that there can be numerous acoustic correlates to a phonological contrast and has demonstrated that listeners use a number of these features to make perceptual judgments about voicing (Lisker Reference Lisker1957, Reference Lisker1986; see Diehl, Kluender, Walsh & Parker Reference Diehl, Kluender, Walsh, Parker, Hoffman and Palermo1991 for review). Also, Port & Dalby (Reference Port and Dalby1982) and Boucher (Reference Boucher2002) have shown that there is a robust effect of consonant-to-preceding-vowel duration ratio for distinguishing the voicing contrast in English stops, both in production and in perception. These studies indicate that, even in the presence of a robust effect of a given (primary) cue, there may be other important acoustic correlates that signal the phonological categorization.
The issue here relates to the theoretical discussion regarding redundancy of information in the speech signal. Working within the framework described as the general auditory and learning approach, Diehl et al. (Reference Diehl, Kluender, Walsh, Parker, Hoffman and Palermo1991) proposed that there are two aspects in sound systems of languages that make them robust signaling devices even with numerous sources of variability: maximal acoustic/perceptual distance between contrasts and redundancy of information. Researchers have hypothesized that acoustic features that covary with a phonetic category distinction may be used together to enhance the perceived distinctiveness of the distinction.
Careful acoustic studies can determine which features covary with a given phonological distinction and the relative strength of covariation of these features can be investigated. Thus, acoustic studies can reveal what is in the signal that physically distinguishes two categories. Perceptual studies can then be conducted to investigate whether the covarying features in fact have functional roles in perception. Given the situation that closure duration may not always be a robust and reliable cue across different speaking rates, it is important to further investigate stop length categorization by exploring acoustic covariants that may function as secondary cues to reinforce the category distinction in less than perfect signal conditions. The current study carries out such an acoustic investigation: identifying and evaluating the categorization strength of multiple features covarying with the length distinction for stops (singleton vs. geminate) in Japanese. Previous studies, as discussed below, have found various factors to be strongly associated with the length distinction in Japanese, but no studies have considered a wide range of factors in a unified way. The goal of the current study is to consider a range of durational and non-durational covariants to the Japanese length distinction. Some of the potential covariants have been investigated in previous work on Japanese and others have not. Thus, the present study involves replication of earlier work with regard to some factors and provides new findings with regard to others. A novel contribution of the current study is to examine the strength of each potential covariant in a discriminant analysis in order to gain further understanding of the acoustic characteristics that define the length contrast in Japanese stops.
1.1 Durational covariants
Maddieson (Reference Maddieson and Fromkin1985) reports that there is a general tendency for languages with consonant length distinctions such that long consonants are preceded by short vowels and short consonants by long vowels. According to Maddieson, this tendency is observed in Kannada, Tamil, Telugu, Hausa, Italian, Icelandic, Norwegian, Finnish, Hungarian, Arabic, Shilha, Amharic, Galla, Dogri, Bengali, Sinhalese, and Rembarrnga. However, other researchers have pointed out that some languages, including some of those listed by Maddieson, do not have this inverse durational relationship between the consonant and the preceding vowel (e.g. Turkish, Bengali, Arabic and Japanese, mentioned in Pickett, Blumstein & Burton Reference Pickett, Blumstein and Burton1999).
A number of studies have noted different durational covariations for the stop length contrast in Japanese. In an examination of the production of nonce words, Homma (Reference Homma1981) found that vowels were slightly shorter after geminate stops. However, statistical verification of the difference was not conducted. Han (Reference Han1994) examined the production of lexical words and also found that vowels were shorter after geminate stops, and in addition, she documented that the segments before geminate stops were slightly longer. Although Han did not find statistical differences in these comparisons, she found the same trend for all ten speakers sampled. Campbell (Reference Campbell1999) confirmed Homma's and Han's findings and provided statistical verification. His analysis, which was based on a large set of data including lexical words with various stop types and multiple vowel contexts, showed that the vowel preceding a geminate had a longer duration than the vowel preceding a singleton. The vowel following a geminate showed a shorter duration than the vowel following a singleton. A more recent study, Kawahara (Reference Kawahara2006a), showed similar results.
The converging evidence, emerging from large data sets (Campbell Reference Campbell1999) as well as more controlled data sets (Homma Reference Homma1981, Han Reference Han1994, Kawahara Reference Kawahara2006a), is that a vowel is relatively longer before a geminate and relatively shorter after a geminate in Japanese. This is the opposite of the pattern found by Maddieson (Reference Maddieson and Fromkin1985), who reported pre-geminate vowel shortening for many other languages. Vowel shortening seems to occur in Japanese in relation to geminate production. However, it has been found in the post-geminate position instead of pre-geminate position. These data suggest that there are cross-linguistic differences with regard to durational correlations involving consonantal length contrasts. This point will be treated in the discussion section. Regardless of the direction or the position, the presence of systematic covariation of features associated with the singleton vs. geminate stops in Japanese gives rise to a possibility that these features carry a functional load in defining the two stop length categories.
1.2 Non-durational covariants
In this study, intensity, fundamental frequency (F0), and voice quality of the vowels surrounding the stop consonant were considered as potential covariants of the stop length contrast. Previous studies pertaining to the use of these features in length contrasts are reviewed in this section. Of these potential correlates of stop length distinctions, only F0 has been investigated for Japanese (Kawahara Reference Kawahara2006a).
First, considering intensity, Abramson (Reference Abramson1987, Reference Abramson1992) reported that amplitude covaried with singleton vs. geminate contrast in word initial position in Pattani Malay, a language spoken in southern Thailand. He found that amplitude was greater in post-geminate syllables than in post-singleton syllables. Abramson (Reference Abramson1992) then demonstrated that the amplitude of the post-stop syllable played a role in the listener's perception of the contrast in Pattani Malay. Lahiri & Hankamer (Reference Lahiri and Hankamer1988) and Hankamer, Lahiri & Koreman (Reference Hankamer, Lahiri and Koreman1989) investigated secondary cues for the singleton vs. geminate stop contrast in Bengali and Turkish. The researchers found that the target syllable in Bengali showed higher intensity levels in words with a geminate than in words with a singleton. Turkish did not show any non-durational correlates.
Second, considering F0, previous research has suggested that this acoustic property may covary with the Japanese length distinction. Japanese is categorized as a pitch accent language, in which the height of a syllable's fundamental frequency characterizes the prosodic structure of the language.Footnote 1 Kawahara (Reference Kawahara2006a) found that fundamental frequency (F0) was reliably differentiated on the following vowel, depending on the preceding stop length. F0 was lower after geminates than after singletons. (Note that his words were all produced with a high–low (HL) pitch contour.)
The third non-durational feature that might be related to the singleton vs. geminate distinction is voice quality. We use the term ‘voice quality’ here to refer to different laryngeal configurations associated with singleton and geminate production. The difference between geminate and singleton stop sounds is often associated with such impressionistic descriptions as ‘tenseness’ and ‘harshness’ of geminates (Catford Reference Catford1977, Hankamer et al. Reference Hankamer, Lahiri and Koreman1989), a description similar to the fortis vs. lenis distinction. The fortis vs. lenis distinction is diachronically linked to the consonant length distinction in that fortition has been considered as a source for the evolution of gemination, and vice versa (Swadesh Reference Swadesh1947, Blevins Reference Blevins2004). Closely related to this point, Payne (Reference Payne2006) proposed that gemination in Italian be considered as a fortitional process. This proposal was based on the finding that gemination in Italian involved greater contact of articulators and the use of different regions of articulators. This suggests that realization of longer duration in production of geminates involves fortition (i.e., strengthening) in addition to simple durational lengthening. Payne's findings suggested that there might be similar articulatory differences between singletons and geminates in Japanese, and if so, the acoustic consequences of such differences would be of interest to the current study.
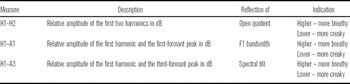
The difference in sound quality in fortis vs. lenis distinctions is often associated with a difference in voice quality of the following vowel: tense or hard (i.e., fortis) sounds involve relatively more creaky voicing. Several acoustic measures have been proposed and utilized as correlates of varying degrees of glottal adduction, which in turn characterizes quality of voice: creaky voice (greatest adduction), breathy voice (least adduction), and normal or modal voice (somewhere in-between) (Hanson Reference Hanson1997, Hanson, Stevens, Kuo, Chen & Slifka Reference Hanson, Stevens, Kuo, Chen and Slifka2001). The types of measures and characteristics that each measure reflects are listed in table 1.
Three measures of voice quality.

It is possible that in the case of the singleton vs. geminate contrast, the vowels in proximity to geminate consonants are produced with the vocal folds pressed tightly together (in the entire articulation phase or just the part adjacent to the geminate), while the vocal folds are relatively relaxed in the environment of a singleton. If this is the case, we would predict differences in the above three measures in the following directions: H1–H2, H1–A1, and H1–A3 values all smaller for geminates than for singletons because of greater constriction in the laryngeal area and a resulting smaller degree of glottal opening during the production of geminates.
The studies reviewed in this section suggest the presence of language-specific, non-durational variations in the realization of the singleton vs. geminate contrast. While languages may share the same primary cue, closure duration, to distinguish singleton and geminate, there may be language-specific, non-durational features that covary as a function of the contrast. Furthermore, as Payne (Reference Payne2006) argued, when there are non-durational features clearly covarying with the production of the singleton vs. geminate distinction, phonological length distinctions may not be defined by durational differences alone.
1.3 The current study
Previous studies have found various factors strongly associated with the stop length distinction in Japanese. Those that have already been identified as acoustic covariants of the contrast are duration of the vowel preceding and following the stop consonant (Homma Reference Homma1981, Han Reference Han1994, Campbell Reference Campbell1999, Kawahara Reference Kawahara2006a) as well as fundamental frequency (Kawahara Reference Kawahara2006a). Studies conducted on other languages suggest the possibility that singleton vs. geminate stop contrast may correlate with intensity (Abramson Reference Abramson1987, Reference Abramson1992; Lahiri & Hankamer Reference Lahiri and Hankamer1988; Hankamer et al. Reference Hankamer, Lahiri and Koreman1989) and voice quality (Payne Reference Payne2006). No studies have considered the role of intensity and voice quality in the Japanese stop length contrast. In addition, no previous studies have considered all these factors in a unified way. This study examined segmental durations, intensity, fundamental frequency, and measures of voice quality to investigate whether those factors covaried with the singleton vs. geminate stop contrast. Furthermore, this study examined the categorization strength of each factor. Even when a feature covaries with a phonological contrast, the feature may not categorize the target contrast with high accuracy because of weak correlation between the two factors. Thus, it is important to compare and evaluate covarying factors with regard to their categorization strength in order to further understand the role each factor plays in defining the contrast.
2 Methodology
Previous acoustic studies employing different methods including large data sets (Campbell Reference Campbell1999, Hirata & Whiton Reference Hirata and Whiton2005) as well as more controlled data sets (Homma Reference Homma1981, Han Reference Han1994, Kawahara Reference Kawahara2006a) have provided similar results in terms of durational measurements. Therefore, this study employed a controlled method in order to examine the contrast in more detail, including both durational and non-durational features. Control of vowel quality is important for spectral amplitude measures, which are greatly affected by the transfer function of the vocal tract (Fant Reference Fant1960).
2.1 Speakers
Six native speakers of Japanese, three male and three female, served as participants. All were living in the U.S. at the time of the recording but their length of stay in the U.S. was less than eight months. Their ages at the time of recording were between 19 and 27. All participants except one were from Tokyo or surrounding areas, and thus were speakers of standard Japanese. The other speaker was originally from Hokkaido, a northern island of Japan, but was a resident of Tokyo for three years prior to coming to the U.S. Most dialects of Japanese are considered to be mora-based, and there are no durational characteristics of the Hokkaido variety that are known to differ from the Tokyo dialect. The accentual aspects of the Hokkaido varieties also have been categorized in broad definition as the Tokyo Type (Hirayama Reference Hirayama1957, Nakajo Reference Nakajo1989). Two Japanese speakers from Tokyo, graduate students of linguistics, listened to the recording of the speaker, and reported that he sounded like a Tokyo variety speaker. Thus, his data were included in the analysis.
2.2 Speech material
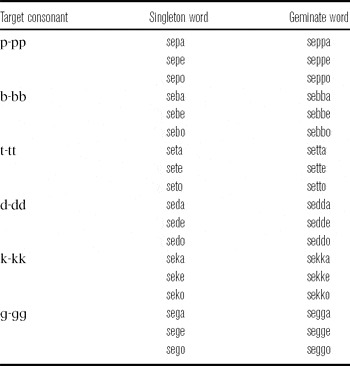
Materials in this study consisted of 18 minimal pairs (36 words) as shown in table 2. In each pair, one word contained a single stop and the other a geminate stop in the word-medial position. All words were produced with the HL (high–low) pitch pattern. The test words included the entire stop series in the Japanese sound inventory in the target position, and the vowel context following the target included the three non-high vowels, [e], [a], and [o], from the five Japanese vowels. High vowels were not included because they are likely to be devoiced after a voiceless stop. Although it may be ideal to vary the vowel contexts in both preceding and following positions, only that of the following position was varied. This was to create a manageable number of test words. Five randomized lists of these 36 test words were created.
Test words.

It should be noted that voiced geminates are not allowed in the native vocabulary of Japanese; however, they appear in loanwords from foreign languages (Beckman Reference Beckman1982, Vance Reference Vance1987, Kawahara Reference Kawahara2006a). Use of voiced geminates in these loanwords has introduced a voicing contrast in Japanese geminates. Kawahara provides such (near-)minimal pairs as webbu ‘web’ and wippu ‘whipped (cream)’ as well as kiddo ‘kid’ and kitto ‘kit’. Of interest to this study is Kawahara's acoustic analysis of duration of voicing during the stop closure, duration of the preceding vowel, duration of closure, and fundamental frequency in words with voiceless and voiced singleton and geminate stops. Of these four measures, only the duration of the preceding vowel showed a significant interaction between voicing and length (singleton vs. geminate). Vowel duration was longer before a geminate than before a singleton, both when the consonant was voiced and when it was voiceless. The interaction was simply due to a difference in the magnitude of effect. The effect was larger when the consonant was voiced. This indicates that, although there is a lexical frequency imbalance between voiced and voiceless geminates, patterns of behavior we observe for voiceless singleton vs. geminate stops are also observed in their voiced counterparts.
Of the 36 words used as stimuli in the study, the six shown in (1) are lexical words in Japanese when produced in the HL pitch pattern. The others are nonce words.
(1) seppa (noun, ‘a thin metal’)
setta (verb, past form of ‘hasten’)
sette (verb, gerund form of ‘hasten’)
seto (noun, name of a city, type of porcelain)
setto (noun, loan word meaning ‘set’)
sekka (noun, ‘turning red’)
sega (noun, name of a game company)
It was not a desirable situation that both lexical and nonce words were mixed together and that the numbers were not balanced between the two types. However, in order to test all the stop sounds in multiple vowel contexts, the inclusion of some lexical words was unavoidable. Previous research found trends of durational covariations either using mixed lists of real and nonce words (Homma Reference Homma1981, Kawahara Reference Kawahara2006a) or lexical words alone (Han Reference Han1994, Campbell Reference Campbell1999). Those results together suggest that the effects, if any, would be present regardless of the lexical status of the word. Also, effects of lexical status have been found primarily in the process of perception rather than production (Pitt & Samuel Reference Pitt and Samuel1993, Walley & Flege Reference Walley and Flege1999).
Furthermore, these test words were presented to the speakers in Japanese hiragana orthography.Footnote 2 Some of the words, the loan words (setto and sega), are strongly associated with the katakana orthography because katakana is the orthographic choice designated for transcribing loan words. In order at least to avoid the direct and automatic mapping between the words' orthography and their meaning, hiragana was chosen to write the test words and carrier phrase. The other Japanese words are normally written in kanji (seppa, sekka, and seto), or in a combination of kanji and hiragana (sette). Even for sette, in which a combination of kanji and hiragana is used, the meaningful part of the word is written in kanji and an inflectional morpheme for its gerundive form is written in hiragana. It was assumed that by writing out these words in hiragana, a neutral choice in these cases, speakers were forced to phonologically decode the word before making the sound-meaning association, if, indeed, such an association was made at all.
The test words were embedded in the same carrier phrase used in Hirata & Whiton (Reference Hirata and Whiton2005), which is given in (2).
(2)


The carrier phrase was written in the Japanese hiragana orthography to be consistent with the orthographic choice for writing the test words.
2.3 Procedure
The data examined in this study were a subset of the total data collected during the recording session. Participants read the sentences from the five randomized lists of 36 test words in each of three speaking rate conditions: normal, slow and fast, in that order. Since the primary concern of this study was to discover the properties distinguishing the singleton and geminate categories in general, and not to identify the effect of changing speech rate, only the tokens produced at the normal rate were included in the analysis. The normal rate was described to the participants as a relaxed and comfortable tempo. Participants were given an opportunity to practice producing some test words prior to recording. All the utterances were recorded in a sound booth, using a flash digital recorder (Maranz PMD670) and a head-mounted microphone. The recording was done at a sampling rate of 22.05 kHz and 16-bit quantization.
The first author, who is a native speaker of Japanese, listened to the recorded sound data for any production errors. Speakers made some mistakes in producing the specified target words. The total number of mistakes produced in the normal speaking rate condition was 8. Types of mistakes included a geminate word instead of singleton word and vice versa, a wrong vowel before or after the target consonant, a wrong consonant, and a combination of two or more of these mistakes. After these tokens were eliminated from the data set, the remaining 1,072 tokens produced at the normal rate were analyzed for this study.
2.4 Measurements
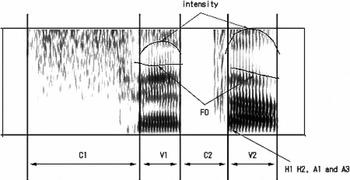
Acoustic measurements were made by the first author after being trained by the second author for the durations of [s] (C1), [e] (V1), stop consonant (C2) and the following vowel (V2) of the test words,Footnote 3 for the intensity of the vowels, fundamental frequency of the vowels, as well as three indices of voice quality. The measures were made using waveform and spectrographic displays on Scicon PCquirer acoustic analysis software. Figure 1 is a sample spectrogram illustrating the specific locations where measurements were made for one of the test words, [seta]. Segmentation procedures followed those outlined in prior studies (Peterson & Lehiste Reference Peterson and Lehiste1960, Klatt Reference Klatt1976, Lahiri & Hankamer Reference Lahiri and Hankamer1988, Hankamer et al. Reference Hankamer, Lahiri and Koreman1989, Ham Reference Ham2001).
A spectrogram of [seta], illustrating where each acoustic value was measured.

The vowel duration (V1 and V2) was measured from the onset to the offset of the visible energy of second formant (F2). Onset of periodicity in the waveform and voicing energy in the F2 in a time-locked spectrogram were referred to in order to determine the onset of the vowel. The duration of the stops (C2), which is defined as the length of closure and voice onset time (VOT), was measured from the offset of F2 energy in the preceding vowel to the onset of F2 energy in the following vowel.
Intensity was measured at the peak of both the first and second vowels of the target word using the intensity function of PCquirer. The intensity was calculated as the average root mean square (RMS) over a 30 ms window with a step size of 10 ms. The intensity measurements were normalized by subtracting the peak intensity value of V2 from the peak intensity value of V1. The derived value is the intensity of V1 relative to that of V2.
Fundamental frequency (F0) was measured at the temporal midpoint of the preceding and following vowels using the pitch function of PCquirer. There were 52 instances (5% of 1,072 tokens) in which PCquirer could not extract the F0 information. In those cases, arithmetic calculations of the fundamental frequency (f = 1/t, where f is frequency and t is the duration of the glottal cycle) were used. Similar to the treatment of intensity values, F0 values were normalized by taking difference measures. The F0 measure at V2 was subtracted from the F0 measure at V1. This difference score (V1–V2) reflects the amount of pitch fall from V1 to V2.
For examination of voice quality, the following measurements were taken for V2 following the target medial stop consonant: (1) the difference in amplitude (dB) between the first and second harmonics (H1–H2), as an indicator of open quotient; (2) the difference in amplitude between the first harmonic and the first formant peak (H1–A1) as a correlate of first formant bandwidth; (3) the difference in amplitude between the first harmonic and the third formant peak (H1–A3) as a reflection of spectral tilt. These amplitude measures were taken using FFT spectra with a 23 ms window beginning at vowel onset. This specific location was used in order to examine the influence of the production of the adjacent consonant. Each spectrum was overlayed with an LPC contour. A1 and A3 were estimated by measuring the amplitude of the strongest harmonic of the F1 and F3 peaks as defined by the LPC tracing.
2.5 Analysis
The primary aim of this investigation was to examine potential covariants of the Japanese singleton vs. geminate stops. Three durational measures (C1, V1, and V2 durations) as well as five non-durational measures (intensity, F0, H1–H2, H1–A1, and H1–A3) were selected as potential candidates based on previous research. In terms of the analysis, therefore, the important question that needed to be addressed was whether there was an effect of stop length (singleton vs. geminate) on those eight acoustic measures. The duration of the stop itself (C2) was also analyzed in order to enable a comparison of relative categorization power between the other eight measures and stop duration.
A total of nine measures (C1, V1, V2, C2, intensity, F0, H1–H2, H1–A1, and H1–A3) were submitted to separate repeated-measures ANOVAs. Four within-subjects factors were entered in each test: phonological length of C2 (singleton and geminate), place of articulation of C2 (bilabial, alveolar, and velar), voicing distinction of C2 (voiceless and voiced), as well as vowel quality of V2 ([e], [a], and [o]). These factors are referred to as Length, Place, Voicing, and Vowel in the remainder of this paper. The factor of Length was of primary interest in this investigation. The other three factors were entered as control factors for the purpose of examining whether the effect of Length, if any, would persist across different conditions. In the result section, all significant effects will be reported; however, the post-hoc analyses will only focus on the effects involving Length.
In addition to identifying covariants of the length contrast, another aim of this study was to evaluate the covariants with regard to their ability to accurately categorize the singleton and geminate stops. For this purpose, discriminant analysis (DA) was used. DA indicates the percentage of observations that are accurately classified into two predefined categories using that predictor alone. In other words, this procedure determines how well each covariant alone (i.e., without the information of C2 duration and other covariants) can categorize the singleton and geminate stops. Covariants of a phonological contrast are by their nature related to the contrasting feature and perhaps with each other. Therefore, it must be assumed that the covariants will have overlapping effects on categorization rather than that each covariant will have an independent and mutually exclusive effect. Thus, DA was selected as a method of analysis because it provides the categorization power of a given factor regardless of whether or not the contribution of the factor overlaps with that of other factors.
It should be noted that there were some non-typical productions of voiced stops observed in two of the speakers. One speaker produced six instances of the singleton voiced velar stop as the velar nasal. Velar nasals can occur in Japanese as allophones of voiced velar stops in medial positions. Traditionally, the nasal variant was considered favorable in medial positions; however, the preference is no longer as strong as before (Vance Reference Vance1987). In these cases, the medial nasal murmur was measured as the duration of the consonant. The six instances of the velar nasal variant accounted for 3% of all the singleton velar data. Another speaker produced ten instances of voiced singleton stops with no observable stop closure. In other words, this speaker produced the segment as a velar or alveolar glide. In these cases, zero was recorded for closure duration. The ten instances of glided stops account for 2% of all singleton voiced stop data. Since these productions, particularly glided stops, could affect durational measurements, two sets of tests were run, one including these non-typical production data and one excluding them. Both analyses returned the same statistical results. A minimal difference was found only in the mean duration of the medial consonant in the singleton condition (69 ms for all data; 71 ms when the 16 instances above were excluded). Since there was virtually no difference, the results based on the entire data set, including the non-typical productions, are presented here.
3 Results
3.1 Durational covariants
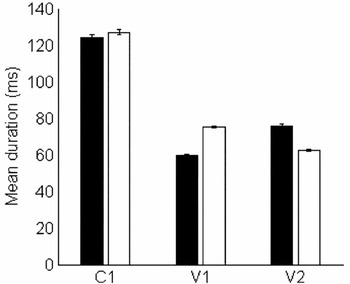
Figure 2 shows the mean durations of C1, V1, and V2 for the singleton and geminate conditions. Note that V1 was longer and V2 shorter for the geminate than the singleton condition. There seemed to be little effect of consonant duration on C1 duration.
Mean durations of C1, V1, and V2 for the singleton (dark bar) and geminate words (clear bar). Error bars indicate one standard error of the mean.

3.1.1 C1
For C1 duration, there was no significant main effect of Length (F(1, 21) = 3.656, p = .07). The main effect of Voicing and the interaction among Place, Voicing, and Length were significant (Voicing: F(1, 21) = 7.798, p < .05, ηp2 = .271; Place*Voicing*Length: F(2, 42) = 8.009, p < .01, ηp2 = .276). Post-hoc tests (alpha level adjusted to .008 for 6 comparisons) indicated that Length had an effect in only one of six Place × Voicing conditions: C1 duration was longer in the geminate than the singleton condition only when the stop was voiceless and V2 was [a] (p < .008). These results indicated that the singleton vs. geminate contrast did not have general effect on C1 duration.
3.1.2 V1
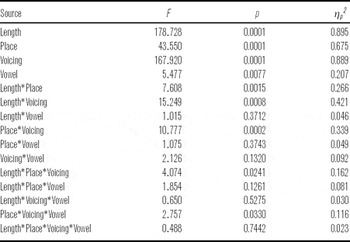
An ANOVA on V1 duration returned a number of significant main effects and interactions, which are summarized in table 3.
Results of ANOVA for V1 duration.

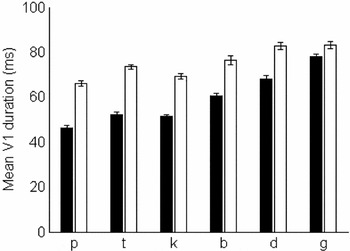
The factor of Length showed a statistically significant main effect, as well as significant interactions with other factors (Length*Place, Length*Voicing, and Length*Place*Voicing). Post-hoc tests examining the 3-way interaction revealed that a significant effect of Length was present in all six Place × Voicing conditions (p < .008 for all), indicating that the interaction was due to difference in the magnitude of the effect (figure 3). The mean of V1 duration was consistently longer before a geminate stop (M = 75 ms) than before a singleton stop (M = 59 ms). The effect was larger when C2 was voiceless, and the voicing effect was largest for the velar place of articulation.
Mean duration of V1 for the singleton (dark bar) and geminate (clear bar) conditions across Place*Voicing conditions. Error bars indicate one standard error of the mean.

3.1.3 V2
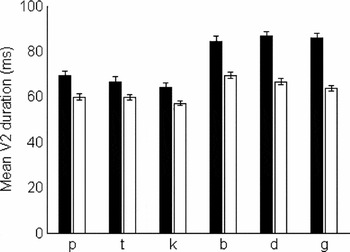
An ANOVA on V2 duration revealed significant main effects for all four factors (Length: F(1, 21) = 27.229, p < .0001, ηp2 = .565; Place: F(2, 42) = 9.588, p < .001, ηp2 = .313; Voicing: F(1, 21) = 235.737, p < .0001, ηp2 = .918; Vowel: F(2, 42) = 69.705, p < .0001, ηp2 = .768) as well as two significant interactions (Length*Voicing: F(1, 21) = 32.660, p < .0001, ηp2 = .609; Length*Place*Voicing: F(2, 42) = 6.811, p < .01, ηp2 = .245). The post-hoc tests examining the 3-way interaction showed that the effect of Length persisted in all six Place × Voicing conditions (p < .008 for all), indicating that the interaction was due to differences in the magnitude of the effect (figure 4). The overall mean of V2 duration was shorter after a geminate stop (M = 63 ms) than after a singleton stop (M = 76 ms). This effect of Length on V2 duration was found in all cases. The interaction was due to a larger length effect for voiced than voiceless sounds, particularly for the velar place of articulation.
Mean duration of V2 for the singleton (dark bar) and geminate (clear bar) conditions across Place*Voicing conditions. Error bars indicate one standard error of the mean.

The analysis of segmental durations revealed that the duration of both vowels in the test words systematically covaried with the length contrast of the stop. Specifically, the duration of preceding vowel (V1) lengthened before a geminate, and the duration of the following vowel (V2) shortened after a geminate.
3.1.4 C2
Finally, an ANOVA was also run for the C2 duration to confirm the durational difference between singleton (M = 69 ms, SD = 28) and geminate (M = 206 ms, SD = 45) stops. All four factors showed significant main effects (Length: F(1, 21) = 458.011, p < .0001, ηp2 = .956; Place: F(2, 42) = 18.694, p < .0001, ηp2 = .471; Voicing: F(1, 21) = 180.374, p < .0001, ηp2 = .896; Vowel: F(2, 42) = 3.493, p < .05, ηp2 = .143). The interactions between Length and Voicing, as well as Place and Voicing were also statistically significant (Length*Voicing: F(1, 21) = 86.719, p < .0001, ηp2 = .805; Place*Voicing: F(2, 42) = 7.598, p < .01, ηp2 = .266).
The post-hoc tests (alpha level adjusted to .025 for two comparisons) examining the Length × Voicing interaction indicated that, as expected, the effect of Length was present for both voiceless and voiceless stops (p < .025 for all). The interaction suggested that the effect of Length had a different magnitude depending on whether the stop was voiced or voiceless (figure 5). The effect appears to be greater in voiced than voiceless stops. Nonetheless, this analysis confirmed a robust difference in duration between singleton and geminate stop consonants (M = 69 ms vs. 206 ms) that were present across all test conditions.
Mean duration (ms) of singleton (dark bar) and geminate (clear bar) stops by voicing type (vcls = voiceless, vcd = voiced). Error bars indicate one standard error of the mean.

3.2 Non-durational covariants
3.2.1 Intensity
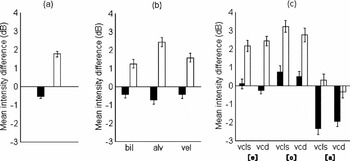
Figure 6(a) presents the overall intensity difference for the singleton and geminate conditions, showing a greater difference across geminate stops than singleton stops. The ANOVA returned significant main effects for Length, Place, and Vowel (Length: F(1, 21) = 83.197, p < .0001, ηp2 = .798; Place: F(2, 42) = 3.392, p < .05, ηp2 = .139; Vowel: F(2, 42) = 88.515, p < .0001, ηp2 = .808). Length × Place, Place × Vowel as well as Length × Voicing × Vowel interactions were found to be significant (Length*Place: F(2, 42) = 9.078, p < .01, ηp2 = .302; Place*Vowel: F(4, 84) = 3.335, p < .05, ηp2 = .137; Length*Voicing*Vowel: F(2, 42) = 3.456, p < .05, ηp2 = .141). The post-hoc tests examining the Length × Place interaction revealed that the main effect of Length was present in all three place conditions (p < .017 for all). As figure 6(b) shows, for all Place conditions, intensity difference values were positive for geminates and negative for singletons, indicating that V1 intensity was greater than V2 intensity for geminate words and vice versa for singletons. The significant interaction suggested that there was a difference in the magnitude of the Length effect depending on the place of articulation. As figure 6(b) illustrates, the effect was largest when the stop was alveolar and smallest when the stop was bilabial.
Mean intensity differences for the singleton (dark bar) and geminate (clear bar) conditions. (a) shows the overall results, (b) by Place conditions (bil = bilabial, alv = alveolar, vel = velar), and (c) by Voicing*Vowel conditions (vcls = voiceless, vcd = voiced). Error bars indicate one standard error of the mean.

The tests examining the Length × Voicing × Vowel interaction also found a significant effect of Place in all six Voicing × Vowel conditions (p < .008 for all). As figure 6(c) illustrates, there was a clear difference between singleton and geminate in all Voicing × Vowel conditions. The intensity difference values were mostly negative in the [a] condition, whereas the values were positive in the other two vowel conditions, [e] and [o]. This means that in general the intensity increased from V1 to V2 when V2 was [a], whereas it decreased from V1 to V2 in other contexts. However, regardless of the direction of difference, the effect of Length was found consistently. The significant interaction was apparently due to difference in the magnitude of the effect. The effect was largest in the voiced V2-[e] condition and smallest in the voiced V2-[a] condition (M = 2.68 dB vs. 1.60 dB).
These results demonstrate that in spite of the significant interactions of factors, the effect of Length persisted for the intensity measure. The intensity difference values were consistently smaller in singleton words than in geminate words, although the magnitude of the effect was not necessarily uniform across the contextual conditions.
3.2.2 F0
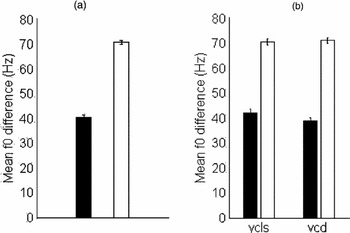
Figure 7(a) presents the overall F0 difference for the singleton and geminate conditions, showing that the fall of F0 was greater across a geminate than across a singleton. An ANOVA found a significant main effect only for Length (F(1, 21) = 59.078, p < .0001, ηp2 = .738), and a significant interaction between Length and Voicing. (F(1, 21) = 5.184, p < .05, ηp2 = .198). The post-hoc tests examining the Length × Voicing interaction revealed that the main effect of Length was present in both voicing conditions (see figure 7(b), p < .025 for all). These results indicate that the F0 fall from V1 to V2 was greater across geminates than singletons. The significant interaction indicates that the effect of Length was greater when C2 was voiced than voiceless (M = 32 Hz vs. 29 Hz).
Mean values of overall F0 difference for the singleton (dark bar) and geminate (clear bar) conditions. (a) shows the overall results and (b) by Voicing conditions (vcls = voiceless, vcd = voiced). Error bars indicate one standard error of the mean.

3.2.3 Voice quality
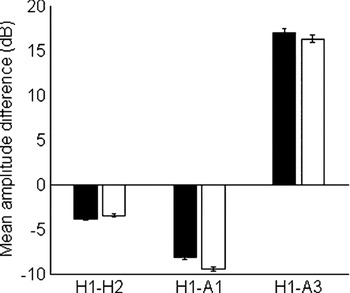
Figure 8 presents H1–H2, H1–A1, and H1–A3 in the singleton and geminates conditions. An ANOVA performed on H1–H2 values showed no significant main effect or interaction involving the factor of Length. Significant effects were found for Voicing and Vowel (Voicing: F(1, 21) = 13.897, p < .01, ηp2 = .387; Vowel: F(2, 42) = 24.083, p < .0001, ηp2 = .523), as well as Voicing × Vowel and Place × Voicing × Vowel interactions (Voicing*Vowel: F(2, 42) = 4.431, p < .05, ηp2 = .168; Place*Voicing*Vowel: F(4, 84) = 2.655, p < .05, ηp2 = .108). These results indicate that the singleton vs. geminate contrast of the stop was not related to the variation in the H1–H2 values of the following vowel.
Mean values of H1–H2, H1–A1, and H1–A3 for the singleton (dark bar) and geminate (clear bar) conditions. Error bars indicate one standard error of the mean.

An ANOVA performed on H1–A1 found significant main effects for three factors, Length, Voicing and Vowel (Length: F(1, 21) = 4.860, p < .05, ηp2 = .181; Voicing: F(1, 21) = 4.850, p < .05, ηp2 = .181; Vowel: F(2, 42) = 16.953, p < .0001, ηp2 = .435), and no significant interactions. This indicates that H1–A1 values varied as a function of Length, with the mean value being significantly smaller for the geminate condition (M = −9.5) than for the singleton condition (M = −8.2); see figure 8. These results were compatible with the prediction that production of geminate involves more creaky voicing, indicated by a smaller value of H1–A1 found in the geminate words.
Finally, another ANOVA was run on the third measure of voice quality, H1–A3, and no significant results were found for the factor of Length. Main effects were found for the factors of Place and Vowel (Place: F(2, 42) = 7.920, p < .01, ηp2 = .265; Vowel: F(2, 42) = 228.148, p < .0001, ηp2 = .912), as well as Place × Vowel and Place × Voicing × Vowel interactions (Place*Vowel: F(4, 84) = 17.921, p < .0001, ηp2 = .449; Place*Voicing*Vowel: F(4, 84) = 4.850, p < .01, ηp2 = .181). Similar to H1–H2, these results indicate that the singleton vs. geminate contrast of the stop was not related to the variation in the H1–A3 values of the following vowel.
3.3 Summary
The analysis presented here has revealed that the phonological length of a stop affected a number of acoustic features of the adjacent vowels: duration, intensity, F0, as well as H1–A1. Other factors, namely, place of articulation and voicing of the stop, as well as the identity of the following vowel, also affected these measures and interacted with the factor of the stop length. However, the effects of these other factors did not nullify or reverse the effect of stop length, indicating that the effect of stop length persisted for all conditions. The effects found for stop length were the following. The preceding vowel lengthened before a geminate, whereas the following vowel shortened after a geminate. Intensity of the preceding vowel relative to the following vowel was found to be greater before a geminate than a singleton. Pitch fall was also greater across geminates than across singletons. Finally, there was a suggestion that vowels following a geminate were produced with more creaky voicing than the vowels following a singleton, as indicated by one of three measures of voice quality, H1–A1.
3.4 Discriminant analysis
Given the confirmed presence of a number of features covarying with the singleton vs. geminate stop length contrast, it is of interest to evaluate the covariants with regard to their strength in successfully categorizing speech productions. In order to pursue this question, separate DAs (discriminant analyses) were performed to determine the categorization power of C2 duration, which is thought to be the primary cue to the contrast, as well as to determine the power of the identified covariants that were found to be reliable indicators of the contrast, i.e., the V1 and V2 durations, as well as the intensity, F0 and H1–A1 measures. These independent analyses indicate the ability of a given factor to accurately categorize the productions when none of the other factors are present in the model. Table 4 shows the results of DA performed for each factor.
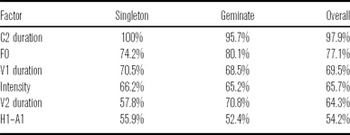
Percentage of accurate categorization by the discriminant analysis for each factor.

Clearly, the effect of the primary cue, C2 duration, was robust, as predicted. Using the C2 duration as the criterion, 100% of singleton productions and over 95% of geminate productions were categorized accurately. Interestingly, however, the measures of F0 and V1 duration showed strong overall categorization, reaching close to 80% and 70% accuracy, respectively. This means that even without the primary cue, by using the V1 duration or F0 information alone, about 70% to 80% of the produced tokens were accurately classified. Intensity and V2 duration were weaker classifiers; and H1–A1 was at near chance level. These results confirmed that the covariants of Japanese singleton vs. geminate stop length contrast investigated here are not equally strong acoustic cues. Some are potentially stronger cues (i.e. F0 and V1 duration) than others (intensity and V2 duration). One particular feature, H1–A1, although it did correlate with the contrast, was not an accurate classifier in the DA.
4 Discussion and conclusion
Previous research has found a number of features that correlated with the stop length distinction in Japanese and other languages (Homma Reference Homma1981, Abramson Reference Abramson1987, Han Reference Han1994, Lahiri & Hankamer Reference Lahiri and Hankamer1998, Hankamer et al. Reference Hankamer, Lahiri and Koreman1989, Campbell Reference Campbell1999, Kawahara Reference Kawahara2006a). The current study examined segmental durations, intensity, fundamental frequency, and three measures of voice quality, as suggested by the previous studies, to investigate whether those factors covaried with the singleton vs. geminate stop contrast. The analysis presented here demonstrated that even though the difference in consonant duration was robust, there were several other reliable correlates to the contrast. Duration of the preceding vowel, duration of the following vowel, a measure of voice quality, as well as intensity and pitch patterns systematically varied as a function of the stop length contrast. While other factors such as place of articulation and voicing of the stop and the type of the following vowel also influenced these features, the analysis found consistent effects of stop length persisting across all the conditions examined. These results demonstrated that similar to the voicing contrast in English, there is rich and redundant information in the acoustic signal for the Japanese singleton vs. geminate stop contrast.
In the durational domain, the results of this study showed that (1) the preceding vowel lengthens before a geminate, and (2) the following vowel shortens after a geminate. Thus, the current study further supports the durational covariants of the singleton vs. geminate contrast in Japanese reported in previous studies (Homma Reference Homma1981, Han Reference Han1994, Campbell Reference Campbell1999, Kawahara Reference Kawahara2006a). The results also confirm the proposal that Japanese is one of the languages that do not fit into Maddieson's (Reference Maddieson and Fromkin1985) observation that languages with a consonant length distinction exhibit a durational inverse between the consonant length and the preceding vowel. This issue will be further discussed below.
In the non-durational domain, this study found that the production of geminates was associated with (1) larger intensity of the preceding than following vowel, (2) larger fall of F0 from the preceding to the following vowel, and (3) creaky voicing. Of these covariants, only F0 has been investigated previously for Japanese. We replicated Kawahara's (Reference Kawahara2006a) finding that F0 showed greater fall after geminates than singletons. Our findings also converge with Abramson (Reference Abramson1987) and Hankamer et al. (Reference Hankamer, Lahiri and Koreman1989), who found that greater intensity was associated with geminate words than singleton words in Pattani Malay (Abramson) and Bengali (Hankamer et al.). Here we may be tempted to propose that a greater intensity is a feature generally associated with production of geminate stops. However, Turkish, the other language that Hankamer et al. investigated, did not show this tendency. Thus, further research is needed to examine how common it is for larger intensity to be correlated with the production of geminates than singletons.
Of the three measures of voice quality examined, this study found that just one measure, H1–A1, covaried with the singleton vs. geminate contrast. H1–A1 is considered to be a reflection of F1 bandwidth. A smaller value of H1–A1, which we found for geminates compared to singletons, indicates a smaller degree of damping in the first formant. Less damping of frequency energy reflects creaky voicing. However, the fact that the other measures of voice quality, H1–H2 and H1–A3, did not show evidence of creaky voicing associated with geminate production suggests that there was not a strong association between geminate production and voice quality in Japanese.
In addition to exploring phonetic covariants, another important purpose of this study was to evaluate the covariants with regard to the accuracy in classifying the singleton and geminate productions. The results of discriminant analyses demonstrated the strong classification power of not only consonant duration (97.9% accurate) but also F0 fall from the vowel preceding to the vowel following the stop (77.1%), preceding vowel duration (69.5%), intensity change from the vowel preceding to the vowel following the stop (65.7%), and the following vowel duration (64.3%). H1–A1 showed near chance level accuracy (54.2%). These results indicated that the Japanese stop length contrast has multiple acoustic features, other than consonant duration, which are available in the signal as fairly strong predictors.
It is thus possible that listeners may make use of these other features, namely preceding and following vowel durations, F0, and intensity, together with consonant length, to categorize singleton and geminate Japanese stops. In this vein, there have been reports suggesting that Japanese listeners make use of the duration of preceding vowel (Ofuka et al. Reference Ofuka, Mori and Kiritani2005, Kawahara Reference Kawahara2006b). Further work will be needed to investigate whether other acoustic correlates also play a functional role in the perception of singleton vs. geminate stops, and what the relative strength of these correlates as perceptual cues is.
Of particular interest is the role of adjacent vowel durations. Durational differences were 16 ms and 13 ms for the preceding and following vowel, respectively. Although actual values are expected to vary due to varying speech rates, previous studies found somewhat similar differences in both preceding vowel (8 ms in Homma Reference Homma1981, 11 ms in Han Reference Han1994, 21 ms in Kawahara Reference Kawahara2006a) as well as following vowel (8 ms in Han Reference Han1994). Except for the data in Kawahara, these differences are rather small, and are on the edge of just noticeable differences for duration (10–40 ms; Lehiste Reference Lehiste1970, Klatt Reference Klatt1976). These small degrees of difference raise a question regarding the role of the vowel durations in perception. Although Ofuka et al. (Reference Ofuka, Mori and Kiritani2005) reported listeners' sensitivity to the duration of the preceding vowel, the preceding and following vowel duration differed by approximately 30 ms. It is not clear whether the effect would also be found when the durational differences are smaller, in the range of 8 ms to 21 ms, as found in acoustic studies.
With regard to the different patterns of covariation between stop length and preceding vowel duration, there are some typological trends to be explored. The current study confirmed that Japanese does not show an inverse relationship between the length of a stop and the duration of the preceding vowel. Furthermore, the durational difference between the singleton and geminate obtained here was robust (singleton to geminate ratio = 1:3), which is similar to the ratios observed previously for Japanese (1:3 by Homma Reference Homma1981, 1:2.88 by Han Reference Han1992, 1:2.88–3.36 by Hirata & Whiton Reference Hirata and Whiton2005). These results are compatible with Ham's (Reference Ham2001) observation that mora-timed languages, such as Japanese, tend to have more robust singleton-geminate durational differences and to lack the durational inverse between the stop and preceding vowel. Ham also observed that syllable-timed languages, such as Italian, tend to have less robust singleton-geminate durational differences (1:1.85 for Italian) and to show a durational inverse between the stop and preceding vowel. These observations seem to suggest that there is a typological regularity between the presence versus absence of the durational inverse and the magnitude of the consonant duration difference. Languages with a robust consonant duration difference do not tend to vary inversely the duration of a vowel to the duration of the following consonant. Languages that have a less robust difference in consonant length show the inverse durational pattern with the preceding vowel.
On the basis of findings in pattern recognition studies across different modalities, Diehl, Molis & Castleman (Reference Diehl, Molis, Castleman, Hume and Johnson2001) report that such inverse patterning provides a highly salient perceptual difference, suggesting that whereas short-short and long-long covariation patterns may provide a quantitative difference, an inverse durational pattern pertains to a more qualitative difference. These observations indicate a possible trading relationship between the degree of the consonant duration difference and recruitment of the preceding vowel duration as a perceptual cue. When there is enough information in the consonant duration alone, the inverse vowel-duration cue may not be recruited (as in the case of a language like Japanese). When, on the other hand, the strength of the consonant-duration cue is in question, the inverse vowel-duration cue may be used to enhance the duration of the consonant (as in the case of a language like Italian). It should, however, be noted that the current study did find a durational inverse between the stop and the following vowel. In the current acoustic data, the preceding vowel duration, which had direct relationship with the stop length (i.e. short-short and long-long), showed slightly stronger classification strength (69.5%) than the following vowel duration, which had an inverse relationship to the stop length (i.e. short-long and long-short, 64.3%). However, following Diehl et al. (Reference Diehl, Molis, Castleman, Hume and Johnson2001), the inversely varying vowel duration in the post-stop position would be predicted to provide a more perceptually salient qualitative difference that would enhance the length difference of the stop sounds. Therefore, it is of great interest to examine the effect of the vowel duration, both preceding and following the stop consonant, on the perception of singleton vs. geminate categories in a variety of speech styles and speech rates.
Acknowledgements
The work presented here formed part of the first author's doctoral Dissertation. The authors thank Noriko Fujii, Jackie Schachter, Paula Rogers, Tetsuo Harada, Melissa Redford, Shigeto Kawahara, Lori Holt, John Esling, and two anonymous reviewers for their helpful comments on the research presented here.