INTRODUCTION
Obtaining accurate ages from marine shell is complicated by a variety of factors. It is well established that the marine carbon reservoir is depleted in radiocarbon (14C) relative to the atmosphere, and that variations in coastal geomorphology, ocean circulation, and upwelling create localized, time-dependent deviations from the global-averaged marine calibration curve. A correction, designated ΔR, must be applied to 14C dates of marine shell carbonates to account for local carbon reservoir offsets (Stuiver et al. Reference Stuiver, Pearson and Braziunas1986). Estuaries pose additional problems for estimation of ΔR. As places where marine, freshwater, and terrestrial biomes meet, carbon derived from diverse sources combines in estuaries to create a unique carbon reservoir that may be subject to rapid fluctuations in reservoir age, even over small spatial scales (e.g., Cherkinsky et al. Reference Cherkinsky, Pluckhahn and Thompson2014; Reimer Reference Reimer2014; Rick and Henkes Reference Rick and Henkes2014; Hadden and Cherkinsky Reference Hadden and Cherkinsky2017a, Reference Hadden and Cherkinsky2017b; Olsen et al. Reference Olsen, Ascough, Lougheed, Rasmussen, Weckström, Saunders, Gell and Skilbek2017). Estimations of ΔR in estuarine settings must explicitly account for both short- and long-term variability in carbon reservoirs.
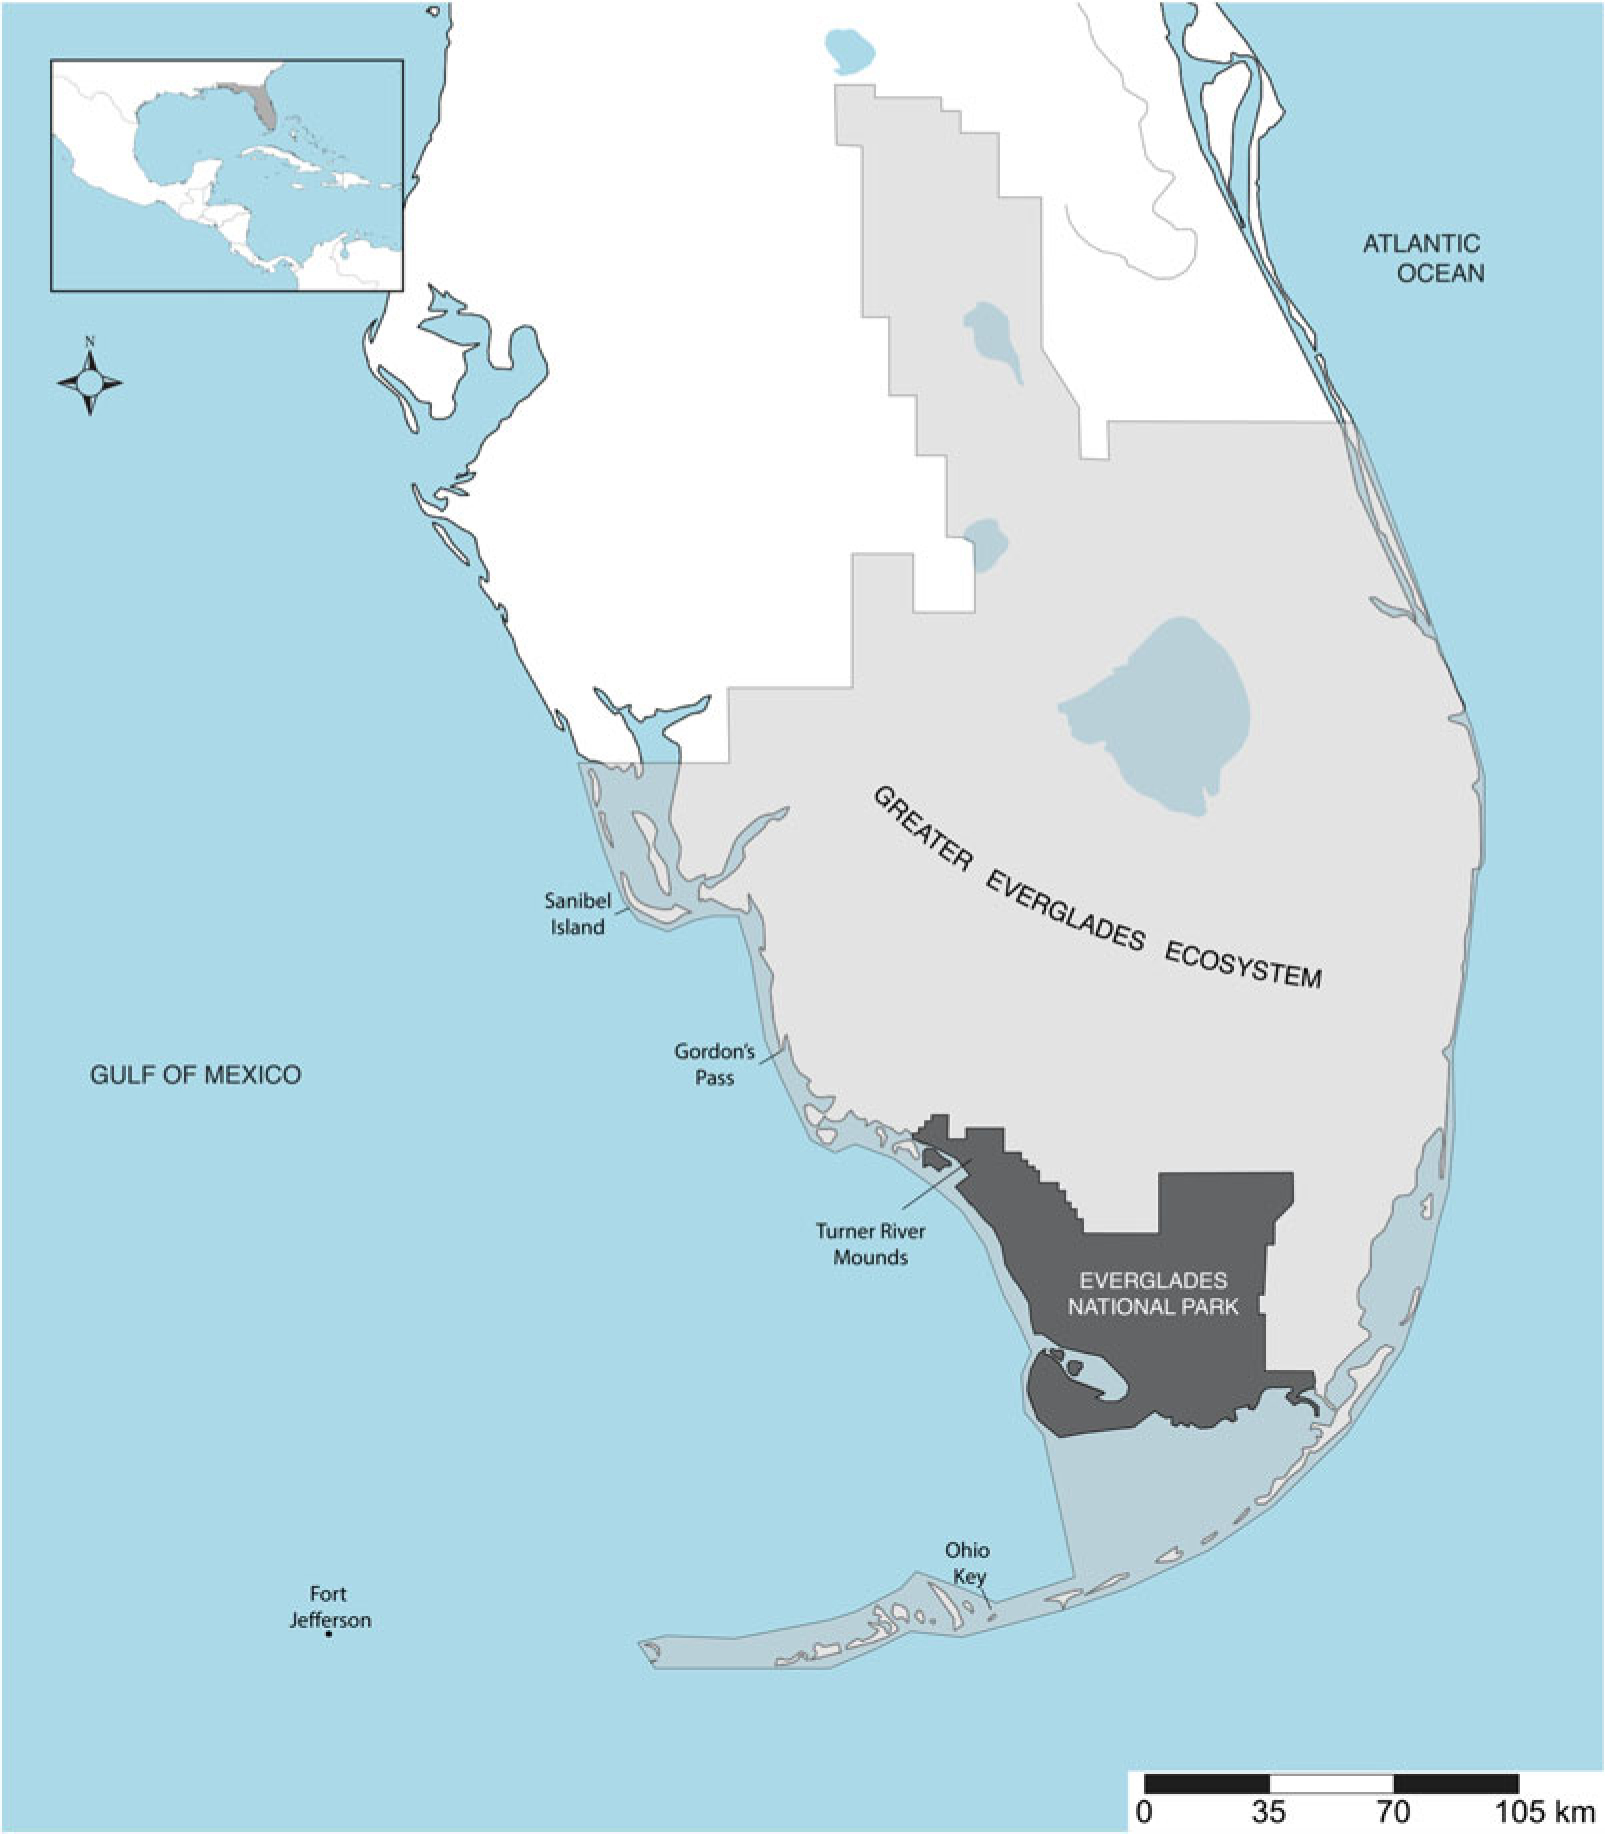
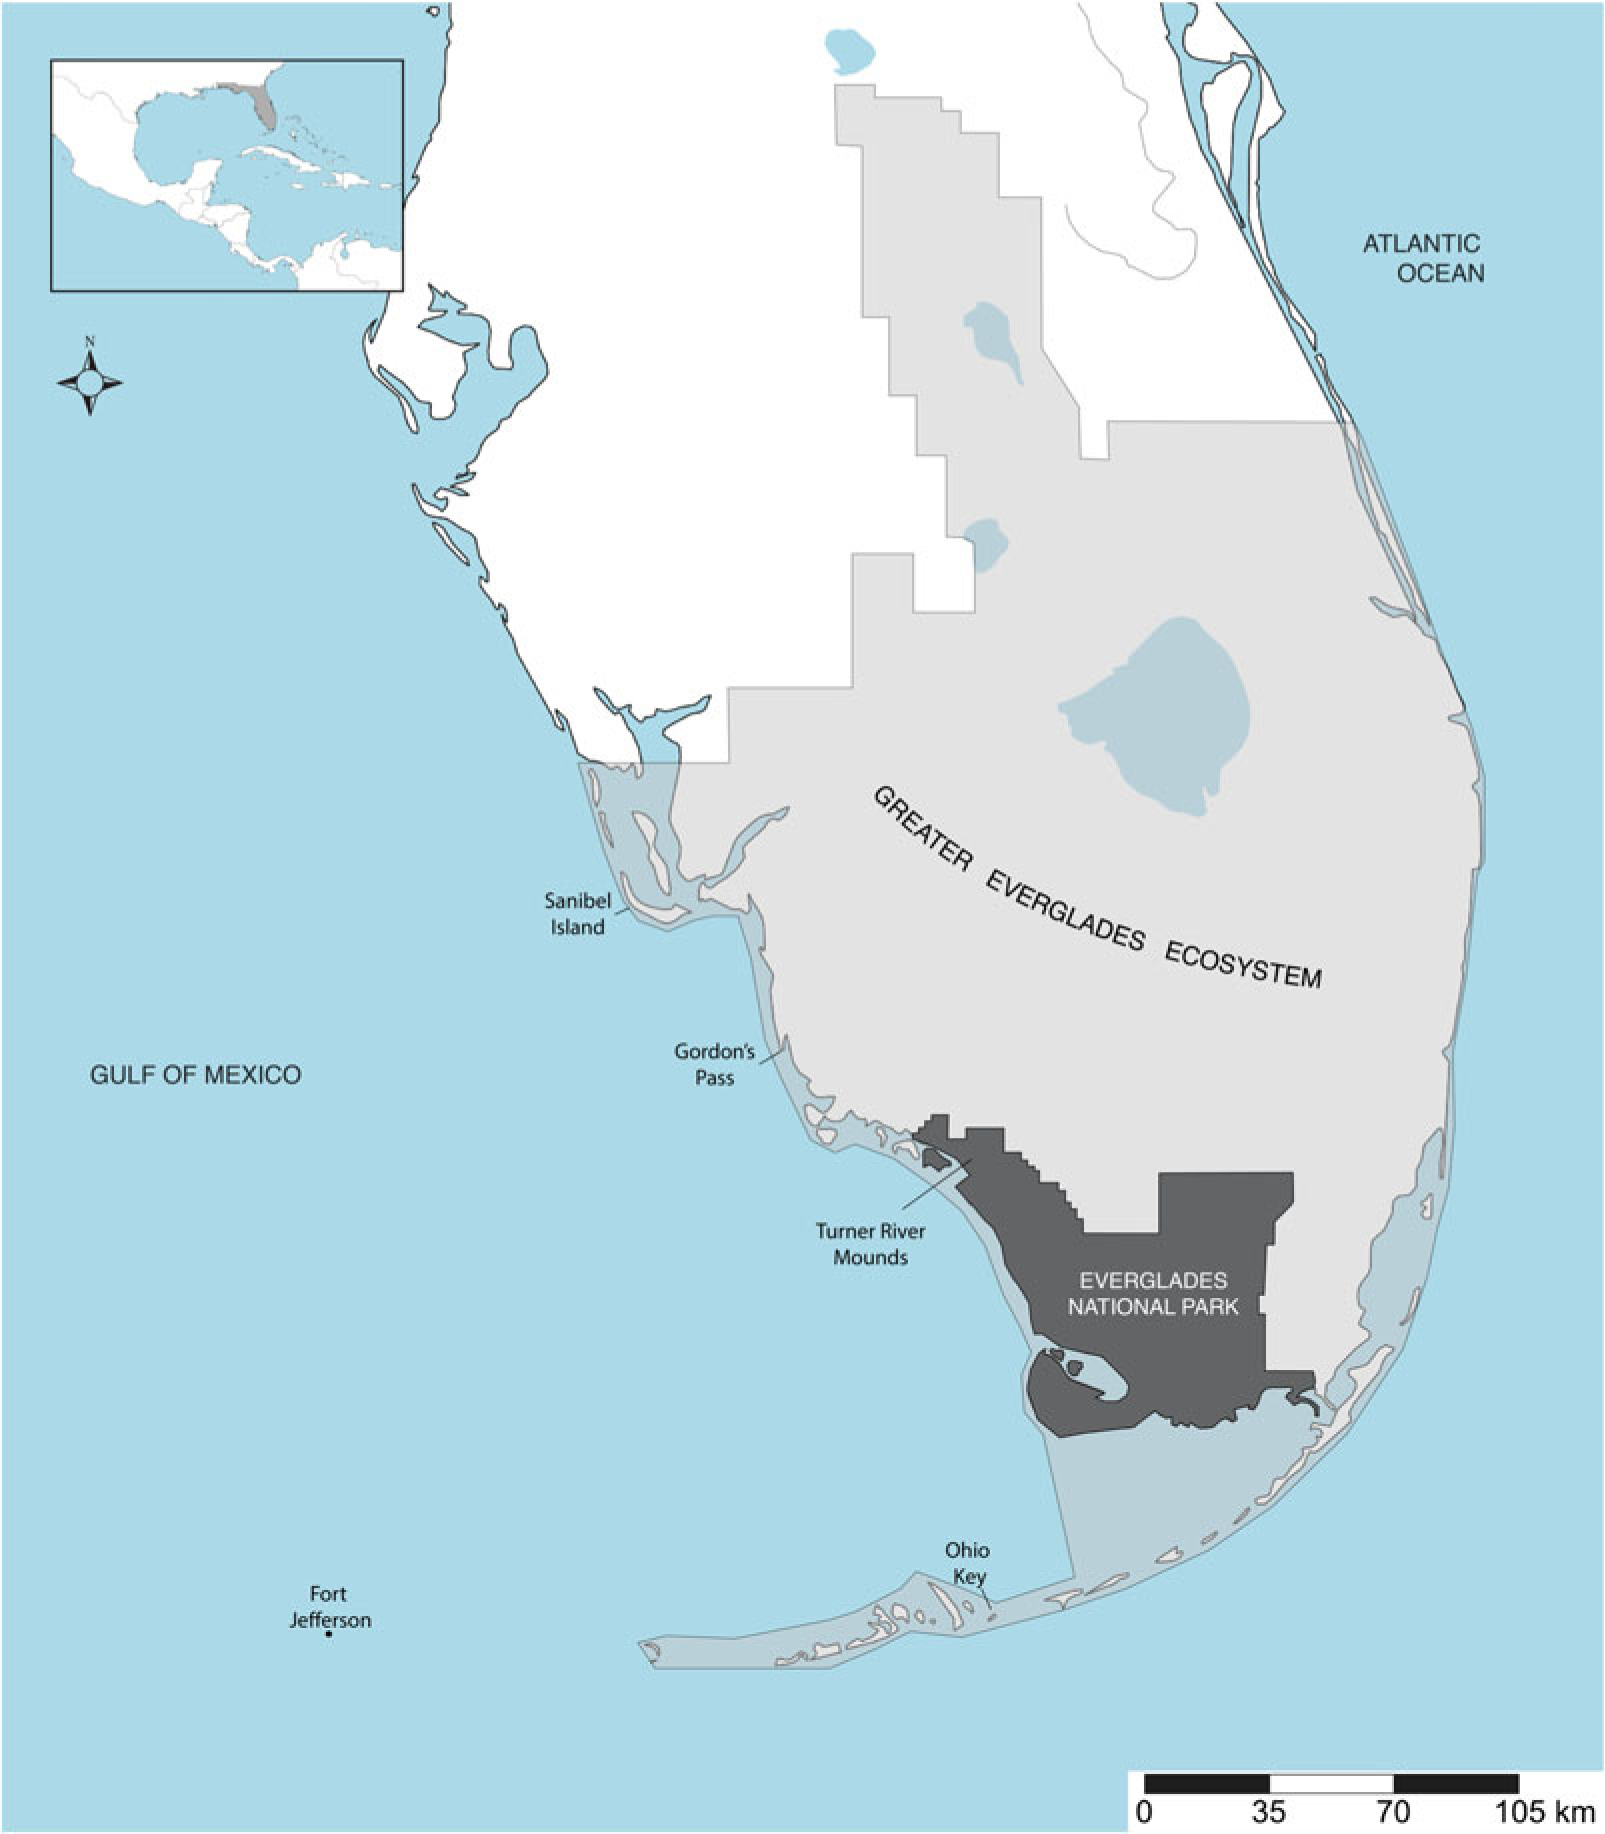
Eastern oyster (Crassostrea virginica) is a ubiquitous estuarine shellfish taxon in eastern North America and one of the most abundant materials for 14C dating in coastal archaeological settings throughout its range. In southwestern Florida, terraformed landscapes built almost entirely of oyster shells reflect a unique pre-Columbian tradition of shell-built architecture and large-scale landscape construction (Schwadron Reference Schwadron2010, Reference Schwadron2017). In this region especially, the ability to reliably date oyster shells is essential to identifying spatial, temporal, and functional relationships among shellworks sites. To date, no systematic attempt has been made to characterize ΔR for the coastal wetlands and islands of southwestern Florida (Figure 1). However, research in other regions of Eastern North America suggests that archaeological C. virginica can be reliably dated if spatially and temporally relevant data on reservoir effects are available (Thomas Reference Thomas and Thomas2008; Rick et al. Reference Rick, Henkes, Lowery, Colman and Culleton2012; Thomas et al. Reference Thomas, Sanger, Hayes, Thompson and Thomas2013; Rick and Henkes Reference Rick and Henkes2014; Hadden and Cherkinsky Reference Hadden and Cherkinsky2017b).
Map of study area.
Methods for estimating ΔR are described by Ascough et al. (Reference Ascough, Cook and Dugmore2005) and usually involve measuring the 14C concentration of known-age marine materials (e.g., “pre-bomb” museum specimens, tephra isochrones, and pairs of terrestrial and marine samples from archaeological contexts). Museum samples appropriate for this type of research must have been collected live, with reliable records regarding the date and location of collection, storage methods, etc. In addition, the samples must have been collected prior to the era of atmospheric nuclear weapons testing. In this paper were present 14C data from known-age, pre-bomb (pre-1950) oyster shells, in addition to a limited number of “paired” marine and terrestrial samples from archaeological contexts, as an important first step towards developing a robust ΔR correction for southwestern Florida.
MATERIALS AND METHODS
Pre-Bomb Specimens
Pre-bomb oyster specimens of known age were loaned to the Center for Applied Isotope Studies (CAIS) from the malacology collections at the Florida Museum of Natural History (FLMNH) and the Delaware Museum of Natural History (DMNH). The specimens were collected between AD 1932 and AD 1948 from Monroe, Collier, and Lee counties, spanning the southwestern coast of Florida (Figure 1). Museum records rarely indicated whether the shells were collected live or dead, but care was taken by the museum curators and the authors to select specimens that likely had died no more than a few years prior to collection (e.g., glossy, unbleached appearance; lack of epibionts on shell interior).
The shells were manually cleaned and placed in an ultrasonic bath for 40 min to remove superficial contaminants, sonicated with diluted HCl for 15 min to leach surface contamination, and then rinsed and dried at 105°C. Usually 2–3 subsamples were taken from each shell in order to observe variability in 14C over the life of the organism. Oysters grow their shells throughout their lives, laying down new layers of calcium carbonate on the interior surface of the shell, covering and extending beyond the margins of previous layers (Carriker et al. Reference Carriker, Palmer, Sick and Johnson1980). In this manner, the valves grow both in height as well as in thickness. The margins of the valves contain the most recent growth, and the oldest portion of the shell is the exterior surface of the umbo or beak, the narrow apex of the shell where the two valves are joined (Galstoff Reference Galstoff1964). Two or three samples were drilled from each shell in transects following visible growth lines, parallel to the shell margins. Carbonate samples (10–15 mg) were drilled using a Dremmel tool with a 0.5-mm carbide drill bit. We obtained a total of 14 carbonate samples from the five specimens.
The carbonate samples were reacted under vacuum with 100% H3PO4 to recover CO2. The resulting CO2 was cryogenically purified from the other reaction products and catalytically converted to graphite (Cherkinsky et al. Reference Cherkinsky, Culp, Dvoracek and Noakes2010). Graphite 14C/13C ratios were measured using the NEC 500 kV Tandem Pelletron accelerator mass spectrometer at the CAIS, University of Georgia, USA. The sample ratios were compared to the ratios measured from Oxalic Acid I (NBS SRM 4990). Carrara marble (IAEA C1) was used as the background, and travertine (IAEA C2) was used as a secondary standard. The sample 13C/12C ratios were measured separately using a Thermo GasBench II-IRMS and expressed as δ13C with respect to PDB, with an error of less than 0.1‰. All 14C dates have been corrected for natural isotope fractionation using the isotope ratio mass spectrometer value. The error is quoted as one standard deviation and reflects both statistical and experimental errors.
To calculate ΔR for known-age (pre-bomb) specimens, we relied on the equation
 $$\Delta R = P-Q$$
where P is the measured 14C age of a sample of known age, and Q is the corresponding marine age, obtained from the Marine13 calibration curve (Reimer et al. Reference Reimer, Bard, Bayliss, Beck, Blackwell, Bronk Ramsey, Buck, Cheng, Edwards, Friedrich, Grootes, Guilderson, Haflidason, Hajdas, Hatté, Heaton, Hoffman, Hogg, Hughen, Kaiser, Kromer, Manning, Niu, Reimer, Richards, Scott, Southon, Staff, Turney and van der Plicht2013). Uncertainty in ΔR was calculated as  ${\sigma _R} = \sqrt{\sigma_P^2 + \sigma_Q^2}$ (Stuiver et al. Reference Stuiver, Pearson and Braziunas1986).
Paired Archaeological Specimens
Marine reservoir effects were evaluated from archaeological materials by comparing the measured 14C ages of oyster shells and terrestrial materials found in close association, which were assumed to have approximately the same dates of death and deposition (Southon et al. Reference Southon, Rodman and True1995; Ascough et al. Reference Ascough, Cook and Dugmore2005). The paired archaeological specimens were excavated from secure archaeological contexts at the Turner River Mound Complex in the Ten Thousand Islands region of Everglades National Park, located approximately 2.5 km northeast of Chokoloskee, Florida (Figure 1). Turner River site is an important shellworks site consisting of 34 large individual mounds, some reaching 7.6 m in height, and as long as 47 m in length and 28 m in width, with numerous other shell work features such as ridges, walkways, canals and ponds. We assume the shells were originally collected from the mouth of modern-day Turner River, the body of water adjacent to the archaeological site. The materials were excavated by Margo Schwadron of the National Park Service in 2017.
Bayesian models were used to estimate ΔR for archaeological specimens in OxCal v.4.3 (Bronk Ramsey Reference Bronk Ramsey2009) using the IntCal13 and Marine13 calibration curves (Reimer et al. Reference Reimer, Bard, Bayliss, Beck, Blackwell, Bronk Ramsey, Buck, Cheng, Edwards, Friedrich, Grootes, Guilderson, Haflidason, Hajdas, Hatté, Heaton, Hoffman, Hogg, Hughen, Kaiser, Kromer, Manning, Niu, Reimer, Richards, Scott, Southon, Staff, Turney and van der Plicht2013). Each pair of terrestrial (charcoal) and marine (oyster) samples were assumed to be drawn from a single uniform phase. The prior probability for ΔR was specified as a uniform distribution over the large range –200 to + 200 yr and was specified as an independent parameter for each individual shell 14C measurement. The limits were assigned based on the range of ΔR values typically observed in the region (Table 1). The use of this intentionally vague prior allows estimates for ΔR to be extracted from the data in the model itself (Bronk Ramsey and Lee Reference Bronk Ramsey and Lee2013), including the charcoal dates and the phase boundaries, and also allows ΔR to be determined independently for each individual 14C measurement on shell. The posterior probability for ΔR represents the updated estimate based on the model parameters. The mean and σ of the posteriors are included in the regional estimates of ΔR.
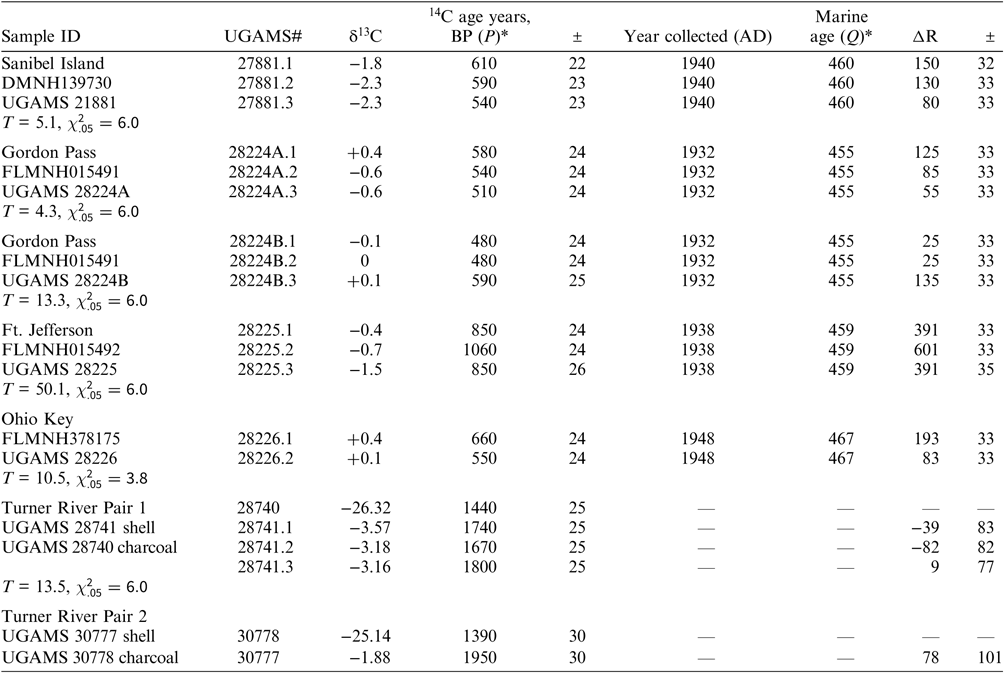
Sample data for pre-bomb known-age oyster shells and archaeology oyster/charcoal pairs from Southwest Florida.

* Please see Equation (1) for definitions of P and Q.
Homogeneity of 14C Ages
To determine whether groups of 14C dates and ΔR values were homogenous, we used chi-squared (χ2) tests as described by Ward and Wilson (Reference Ward and Wilson1978) and implemented using the R_Combine() function in OxCal 4.3 (Bronk Ramsey Reference Bronk Ramsey2009).
RESULTS AND DISCUSSION
The measured 14C ages of the known-age and paired samples are presented in Table 1. Two shells (UGAMS21881 and UGAMS28224A) passed the chi-square test of homogeneity, indicating that there is no statistical difference in 14C ages within the individual shells. The remaining shells exhibit significant within-shell variability, with discrepancies in excess of 100 14C yr. Given that oysters rarely live more than 20 yr (Buroker Reference Buroker1983), the variability in 14C ages likely reflects changes in the concentration of 14C in the environment, manifest as short-term fluctuations in ΔR.
The largest ΔR values are all attributed to a single shell, UGAMS28225, collected from a man-made moat surrounding Fort Jefferson National Monument (Figure 1). The massive, but unfinished, fort was built during the American Civil War (1861–1865). Ancient coral rubble from outlying reefs was used in the concrete infill that comprises the bulk of the walls of the fort (Port Reference Port2014). Dissolution of the centuries-old coral rubble that was used in the fort’s construction may be responsible for localized depletion in 14C within the moat, as well as the anomalously old 14C ages of the known-age oyster (UGAMS 28225). The conditions within the fort’s moat are unique and completely uncharacteristic of southwestern Florida. Shell UGAMS28225 is therefore excluded from the subsequent discussion.
Eleven 14C measurements on the four remaining museum specimens yielded a wide distribution of ΔR values, ranging from 25–190 yr with a weighted regional average ΔR of 95 ± 54 yr (1σ), failing the chi-square test of homogeneity (T = 44.28,  $\chi_{.05}^2$ = 18.31). The variability observed among shells suggests the need for sub-regional ΔR estimates for southwestern Florida, as reported by Rick and colleagues (Reference Rick, Henkes, Lowery, Colman and Culleton2012, Reference Rick and Henkes2014) for eastern oysters from the Chesapeake Bay and Middle Atlantic regions, and for Apalachicola Bay oysters (northwestern Florida) by Hadden and Cherkinsky (Reference Hadden and Cherkinsky2017b). In the latter case, significant mixing of marine water with 14C-depleted freshwater from Florida’s extensive limestone aquifer resulted in an east–west 14C gradient within the coastal bay. Likewise, the headwaters of the Everglades, originating among the limestone aquifers of central Florida, could be a source of 14C-depleted dissolved limestone to the coast of South Florida.
It is extremely likely that sub-regional variation in 14C exists along the coast of Southwest Florida. Unfortunately, the potential for more highly resolved ΔR estimates is limited because well-curated, known-age, pre-1950 C. virginica shells from Southwest Florida are surprisingly rare in museum collections––to our best knowledge consisting of the five specimens included in the current study. Attempts over the past 150 yr to drain, re-route, and control the Everglades have dramatically altered the flow of freshwater across most of South Florida (Willard and Cronin Reference Willard and Cronin2007; Krauss et al. Reference Krauss, From, Doyle, Doyle and Barry2011), undoubtedly affecting local reservoir ages. Any spatial patterning that might be discerned among the pre-bomb museum specimens would have little relevance to earlier times, when the flow of water was relatively unrestricted. For this same reason, it is important to ground-truth ΔR estimates based on relatively modern specimens against known-age archaeological materials.
Paired archaeological specimens have great potential to provide spatially and temporally relevant estimates of carbon reservoir offsets in Southwest Florida archaeology. However, this approach presents its own challenges. The paired-sample approach assumes that the difference in reservoir age is responsible for the difference in 14C age between terrestrial and marine materials. Post-depositional mixing and bioturbation must be considered when selecting contemporaneous sample pairs (Ascough et al. Reference Ascough, Cook and Dugmore2005). In shell-dense archaeological matrixes, including shellworks sites, stratigraphy may be lacking, and disturbances difficult to detect (Rick and Waselkov Reference Rick and Waselkov2015). It is challenging to account for uncertainty in the contemporaneity of two archaeological specimens in such as setting. Secondly, an important attribute of shellworks sites is the overwhelming abundance of remains of estuarine fish and shellfish, and at the same time the relative scarcity of well-preserved terrestrial materials. Most often, dispersed wood charcoal is the dominant terrestrial material available for analysis. The right archaeological contexts, containing the right mix of materials, are extraordinarily rare in this region.
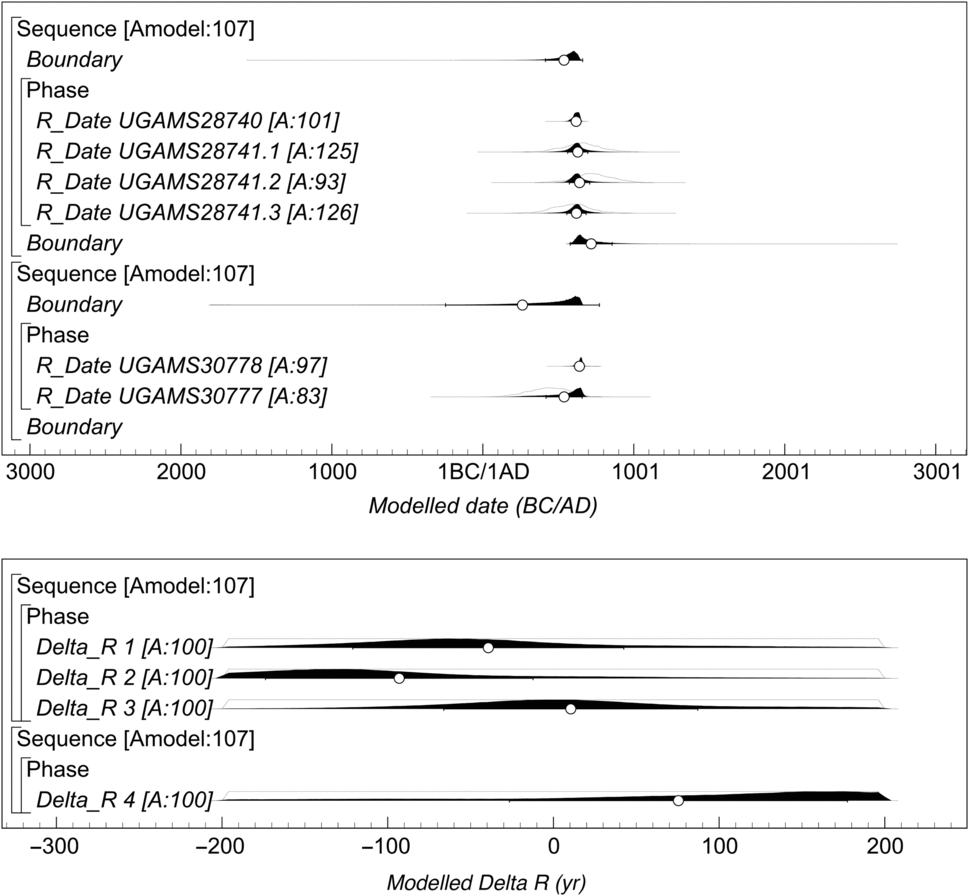
To date, we have accumulated a total of four 14C dates on oyster and two 14C dates on unidentified wood charcoal from two relatively secure archaeological contexts from one archaeological site (Table 1). The posterior probability distributions for ΔR are given in Figure 2; the mean and σ of these posteriors are included as estimates for ΔR in Table 1. These yielded a weighted average and weighted uncertainty for ΔR of –15 ± 42 yr (T = 1.70,  $\chi_{.05}^2$ = 7.815). We consider this to be the current best estimate for ΔR for the pre-Columbian Turner River archaeological site, at least during the 7th century cal AD, which coincides with the Vandal Minimum climate episode, an abrupt onset of cooler, drier, or even drought-like conditions in Southwest Florida (Wang et al. Reference Wang, Surge and Walker2011, Reference Wang, Surge and Walker2013) and elsewhere (Arjava Reference Arjava2005). We do not know, or purport to know, whether this value is generalizable to the greater region or beyond this time-period.
Results of modeled 14C ages (top) and modeled ΔR values (bottom). Posterior probabilities are shown as filled distributions; likelihoods are outlined in black. Open circles and whiskers denote mean and sigma, respectively.

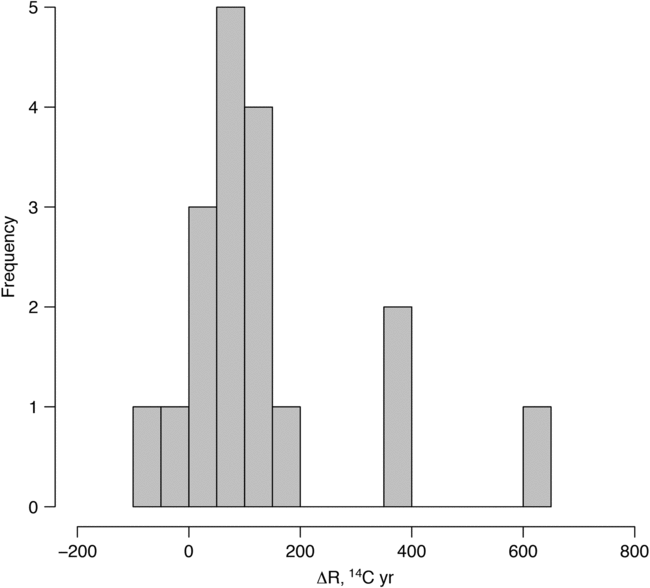
Following Russell et al. (Reference Russell, Cook, Ascough, Scott and Dugmore2011), the distribution of ΔR values from all museum and archaeological specimens is displayed as a histogram to illustrate the full data range (Figure 3). The weighted regional average ΔR, including archaeological and museum specimens but excluding the Fort Jefferson specimen (UGAMS28225), fails the chi-square (T = 73.64,  $\chi_{.05}^2$ = 23.68) and we therefore report the weighted average and σ, rather than weighted uncertainty, of 92 ± 74 yr for Greater Southwest Florida.
Frequency histogram of full range of ΔR values from all museum and archaeological specimens included in this study.

CONCLUSION
The ability to reliability date oyster shells is key to understanding the tradition of shell-built architecture and landscape modification in southwestern Florida. Based on a total of 20 14C measurements, we present a best estimate for ΔR of 92 ± 74 yr for Greater Southwest Florida and –15 ± 42 yr for the Turner River archaeological site. Both estimates are subject to revision as additional data become available.
Due to efforts to drain and re-route the flow of water in this massive wetlands ecosystem over the past 150 yr, ΔR estimates based on “pre-bomb” museum specimens may not be appropriate for correcting 14C dates on archaeological oysters. We suggest that paired archaeological samples have great potential to provide spatially and temporally relevant estimates of carbon reservoir offsets in Southwest Florida archaeology.
ACKNOWLEDGMENTS
An earlier version of this research was presented at the 23rd International Radiocarbon Conference in Trondheim, Norway. We wish to thank the conference organizers for inviting us to contribute to the conference proceedings. We also wish to thank Alex Kittle at the Delaware Museum of Natural History and Gustav Paulay and John Slapcinsky at the Florida Museum of Natural History for facilitating access to museum specimens; as well as Tom Iandimarino, Josh Marano, Paige Hawthorne, Matt Fenno, Oscar Rothrock, and PJ Walker (National Park Service); Jeff Speakman, Alexander Cherkinsky, Ravi Prasad, Hong Sheng, Matt Colvin, Marianne Happek, Tom Maddox, and Corinne Sweeney (Center for Applied Isotope Studies); and Randy Parkinson (Florida International University) for assistance in the field and in the lab. This project was funded as part of an Cooperative Ecosystems Studies Unit Award #P16AC01679 for the project titled “Paleoecology and Paeloclimate at the Turner River Mound Complex.”