


Introduction
Changes in the polar and Subpolar Sea-ice cover and thickness influence global climate. it is important to monitor Sea-ice thickness over a long term in order to validate Satellite remote-sensing data and to understand global climate change. techniques used to measure Sea-ice thickness have included drilling, Ship-mounted video camera observations, Submarine Sonar (wadhams and others, 1991;wadhams, 1997; rothrock and others, 1999), moored ice-profiling Sonar, laser altimetery (Reference MultalaMultala and others, 1995; Reference Ishizu, Mizutani and ItabeIshizu and others, 1999) and electromagnetic–induction (em) measurements from the Surface, icebreakers or helicopters (Reference Haas, Gerland, Eicken and MillerHaas and others, 1997;Reference Worby, Griffin, Lytle and MassomWorby and others, 1999; Reference Uto, Shimoda, Izumiyama, Squire and LanghorneUto and others, 2002; Reference Reid, Worby, Vrbancich and MunroReid and others, 2003). ice profiling using an em instrument and a laser altimeter is currently considered to be one of the more reliable and practical techniques for measuring Sea-ice thickness.
The em instrument measures the apparent conductivity, σ a, of all the conductive materials beneath it, and can be used to estimate the Sea-ice thickness, Z I, because of the large contrast in the electrical conductivities of Sea ice (0–80 msm–1) and Sea water (2300–2900msm–1) (morey and others, 1984; Reference Kovacs, Valleau and HolladayKovacs and others, 1987; Reference Kovacs and MoreyKovacs and morey, 1991; Reference Haas, Gerland, Eicken and MillerHaas and others, 1997). in order to improve the accuracy of Ship-based and ground-based em measurements for different regions and Seasons, calibration Should consider that the underlying Surface may be composed of Several different layers of Snow, ice and Sea water. by calibration we mean here tuning the coefficients in the formula used to determine total thickness from apparent conductivity.
The objective of this Study is to develop an appropriately Standardized transformation from σ a to Z I that Simplifies the calibration procedure for em measurements for all regions, without requiring individual Snow, ice and Sea-water Samples.
For this Study we conducted Ship-based and ground-based em measurements in the chukchi Sea both from r/v XueLong as part of the chinese arctic research expedition 2003 (chinare-03) and from the uscgc Healy during the western arctic Shelf basin interaction (sbi-04) project. east antarctic measurements were made from the rsv Aurora Australis during the antarctic remote ice Sensing experiment 2003 (arise-03). we also made em measurements from the japanese coast guard p/v Soya during the Sea-ice research activities in the Sea of okhotsk in february 2004 and 2005 (siras-04 and -05), and in Saroma-ko (lagoon), hokkaido, japan, in the winters of 2004 and 2005.
Measurements and Methods
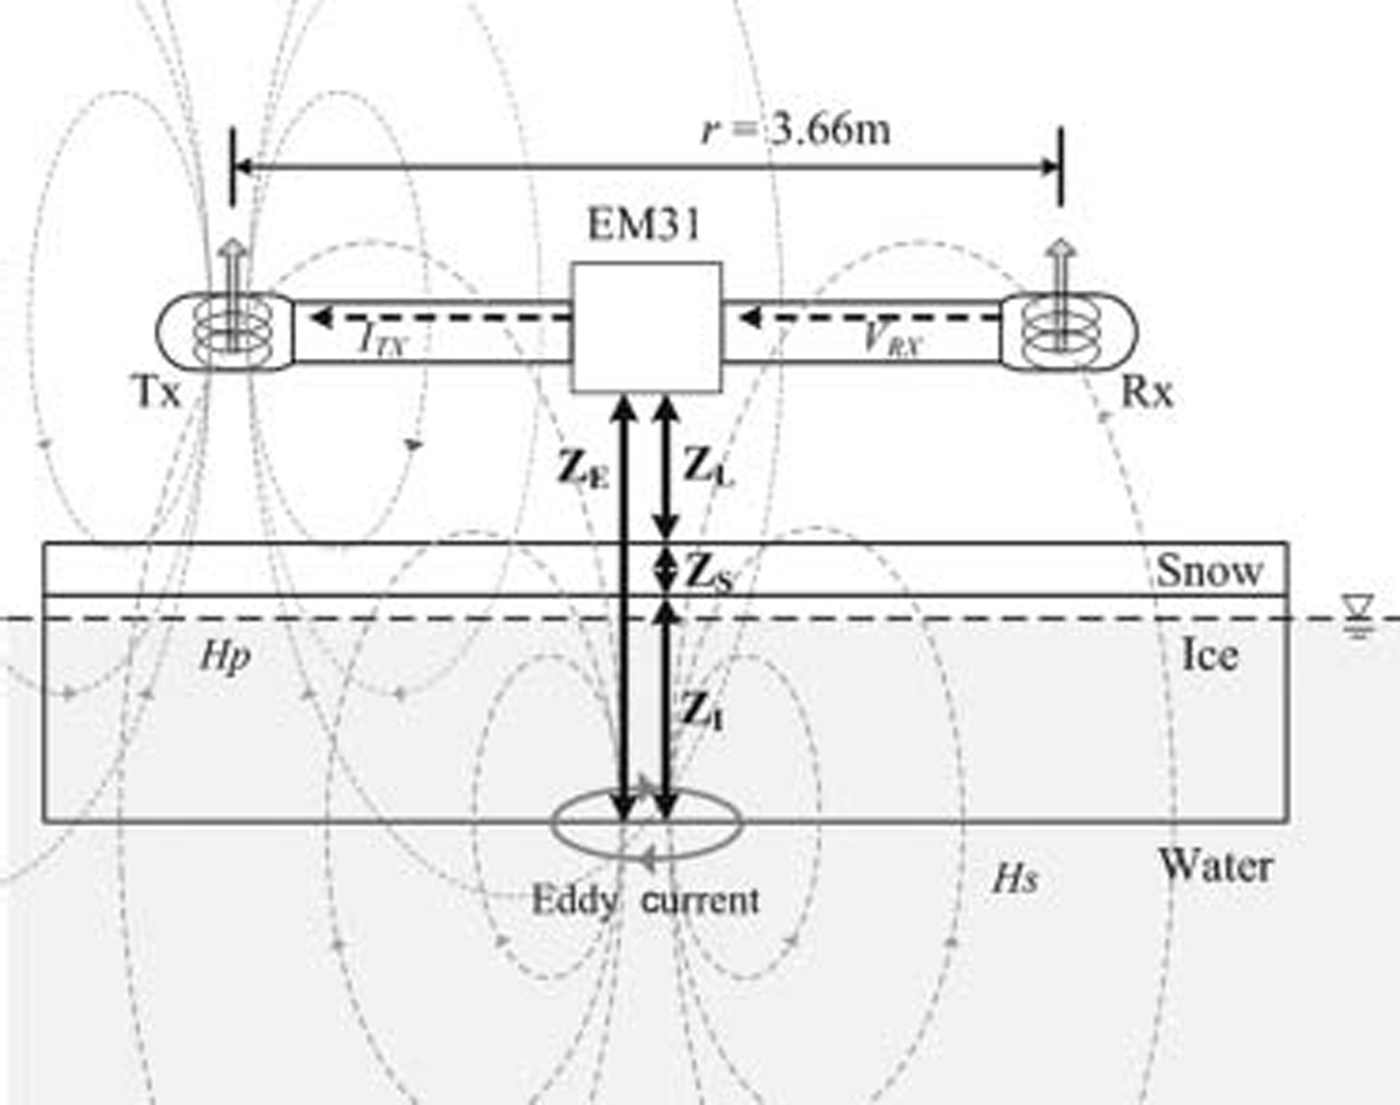
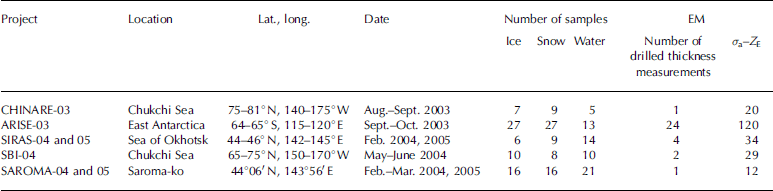
Em measurements were made with an em31/ice (geonics, ltd, canada), which is widely used for measuring Sea-ice thickness as Shown in figure 1. in order to investigate the σ a response to the distance between the em instrument and Sea water (Z E), the elevation of a Ship-based instrument was varied (chinare-03, Sbi-04, Siras-04 and -05) and ground measurements were made at different heights at 20m intervals along 500m Survey lines (chinare-03 and arise-03). during arise-03 the height was varied by placing the instrument on 0.31 m thick Stacked plastic boxes. in Saroma-ko, the height of the instrument was changed by using a wooden ladder (saroma-04 and -05). table 1 lists the observation Sites and the numbers of ice/snow/water Samples, drilled thickness measurements and em measurements used for the calibration at each Site.
Schematic of measurement of Sea-ice thickness with the EM31/ICE. The distances Z E, Z L, Z S and Z I are respectively from instrument to ice bottom, from instrument to Snow Surface, Snow depth, and ice thickness.
Summary of observation Sites and the number of ice-core, Snow and water Samples and EM measurements taken at each. σ a–Z E is the total number of EM measurements, at different heights at the drilling Sites, used for the calibration
Since the conductivity contrast between Snow and ice is very Small, the em measurements cannot distinguish between Snow and ice, So we discuss the relationship between σ a derived from em measurements and the observed total thickness of Snow and ice (Z S+Z I, where Z S is the Snow depth and Z I is the ice thickness). the total thickness can be derived by Subtracting the distances between the em instrument and the Snow/ice Surface (Z L) from Z E. in this manner, we can obtain multiple σ a and Z E datasets for a certain Z S + Z I at Several heights Z L.
Snow, ice and Sea-water Samples were collected from beneath the em instruments during these campaigns (table 1). the ice temperature was measured using a thermistor Stick inserted into holes drilled at 5 or 10 cm intervals in the recovered cores. these ice Samples were cut into 5–10cm Sections, melted, and the bulk Salinity was measured to derive the Sea-ice conductivity, σ I (see below). the Snow density, temperature, Salinity, type, crystal Size and wetness were measured at 1–3 cm vertical intervals, and these parameters were used to determine the Snow conductivity, σ S. for Sea water, the measurements from a Ship-based profiler of conductivity (σ W), temperature and depth were used.
Electromagnetic–induction instrument
The em31 has a pair of coils – a transmitter coil (tx) and a receiver coil (rx) – Separated by 3.66m (fig. 1). the tx generates an alternating primary magnetic field H p and induces Small eddy currents in the underlying Sea water. these currents generate a Secondary magnetic field H s, which is Sensed along with H p by rx. the em31 automatically transforms the measured quadrature response of H s to the apparent conductivity σ a in msm–1 (Reference McNeillMcneill, 1980). σ a is defined as

Where μ 0, ω, r and Q(H s/H p) denote the magnetic permeability of free Space (4π×10–7hm–1), angular frequency (ω = 2πf ), transmitter–receiver coil Separation (3.66 m) and quadrature component of the ratio of H s to H p at rx, respectively. the frequency, f, is 9.8 khz.
The em31 can measure σ a by either the horizontal coplanar (hcp) mode or the vertical coplanar (vcp) mode. in this Study, we Surveyed the Sea-ice thickness using the vcp mode, because it has a finer lateral resolution than the hcp mode and it possesses a high capability of distinguishing thin ice (Reference Reid, Worby, Vrbancich and MunroReid and others, 2003), which makes it Suitable for application in the Sea of okhotsk and Saroma-ko. according to Reference Reid and VrbancichReid and vrbancich (2004), the footprint Size for vcp geometry is 1.4–1.5 times Z E, i.e. when Sounding a 6 m thick ice ridge at an instrument height of 4 m (Z E = 10 m), the apparent footprint Size of the vcp mode is 14–15 m. therefore, the instrument Should be placed 5.6–6.0 m from the Ship hull for the vcp mode at an operating height of 4 m in order to prevent the Ship hull from causing offsets in the observed data.
Modeling
A method to calculate Z S + Z I from σ a for arctic and antarctic Sea ice by using a one-dimensional (1-d) multilayer model was proposed by Reference Haas, Gerland, Eicken and MillerHaas and others (1997) and Reference C.Haas (1998). we used the program pcloop developed by geonics (Reference McNeillMcneill, 1980) to calculate σ a using the 1-d multilayer model, which consists of three layers: Snow (Z S, σ Sbulk), ice (Z I, σ IBULK) and Sea water (infinite depth, σ W). the instrument height (Z L) was also included in this model.
For the model, we first calculated the Sea-ice conductivity σ I from the results of ice-core analysis. according to archie’s law (Reference ArchieArchie, 1942), σ I (sm–1) can be calculated from the fraction of brine cells filled with Sea water, v b, and the conductivity of brine, σ b (sm–1):

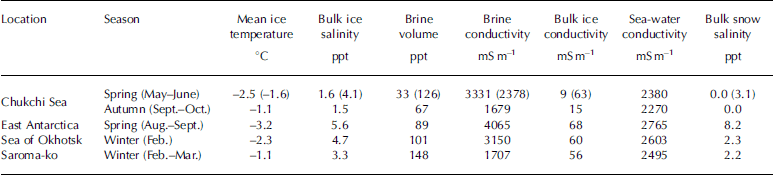
We used a value of 1.75 for m as per Reference Haas, Gerland, Eicken and MillerHaas and others (1997). the σ b was calculated from the ice-core temperature using an equation given by Reference Stogryn and DesargantStogryn and desargant (1985). v b was calculated from the Salinity and temperature of the ice core using the method of Reference Frankenstein and GarnerFrankenstein and garner (1967). these calculations were carried out for each 5–10 cm Section of the ice cores, and the bulk Sea-ice conductivity σ IBULK was calculated by averaging the σ 1 profile for each ice core. table 2 Summarizes the mean ice temperature, the bulk Salinity and conductivity of the ice, the volume and conductivity of brine, Sea-water conductivity and bulk Snow Salinity of the Samples from our Study regions.
Summary of the mean ice temperature, bulk ice Salinity and conductivity, volume and conductivity of brine, Sea-water conductivity and bulk Snow Salinity of Samples. For the Chukchi Sea in Spring, the values are given for both multi-year ice and first-year ice (latter in parentheses)
The σ a–Z E transform equation is based on an empirical approximation of the analytical equation for the measured electromagnetic field. an approximation for the inversion model, which calculates Z E from σ a, is commonly used and gives Stable results (Reference Pfaffling, Haas and ReidPfaffling and others, 2004).

Where an are coefficients. figure 2 Shows the derived σ a–Z E relationships from calibrations made by changing the instrument height in the chukchi Sea, off east antarctica, in the Sea of okhotsk and in Saroma-ko. each regional dataset was fitted by equation (3) using different coefficients. in okhotsk ice, there may be an underestimation of the offset because all data were taken over deformed ice floes, not on the undeformed ice, although the data were observed mainly over undeformed ice in the other Seas.
Derived σ a–Z E relationships from calibrations made by changing the EM instrument height in the Chukchi Sea, off East Antarctica, in the Sea of Okhotsk and in Saroma-ko. The curves are exponential fits to the data points.

The objective of this Study is to develop a best common fit to the σ a–Z E relationship for all regions. in the following Section, we consider the variability of Sea-ice characteristics, and how these affect the σ a–Z E relationship.
Results
Observed conductivities and thicknesses of Snow, ice and Sea water
The conductivity and thickness of Snow, ice and Sea-water Samples are Summarized in table 2. the range of ice-core lengths in chinare-03, Sbi-04, arise-03, Siras-04 and -05 and Saroma-04 and -05 is 0.20–1.85, 1.29–2.05, 0.90–2.69, 0.15–2.53 and 0.24–0.52 m, respectively. in autumn the chukchi Sea had the lowest bulk ice Salinity and lowest Sea-water conductivity. the ice at this time consists of Second-year and multi-year ice, and fresh meltwater has been released into the Sea water from Surface melt prior to the onset of freezing. in contrast, the ice in the chukchi Sea in Spring consists mainly of first-year ice (values in parentheses in table 2), and the conductivities of bulk ice and Sea water, as well as the Snow Salinity, are greater than those in autumn. off east antarctica, the Salinities and conductivities of Snow, ice and Sea water are the highest, and the ice temperature is the lowest. although the ice conductivity and Snow Salinity in the Sea of okhotsk and Saroma-ko are Similar, the ice temperature and Sea-water conductivity are different. Saroma-ko is located near the Sea of okhotsk and connected through two estuaries; therefore ice and water Salinities in the region where the lagoon faces the Sea are Similar to those in the Sea. on the inland Side, however, ice and water are relatively fresh due to river inflow. multi-year ice in the arctic is fresh, with a conductivity range of 9–15 msm–1 regardless of the Season, but its temperature varies. the temperature of first-year ice varies with the Season and region; however, its mean conductivity remains relatively constant within the range 56–68msm–1. on the other hand, the conductivity of Surface Sea water ranges widely from 2270 to 2765 msm–1 depending on the region and Season.
Model Sensitivities and improvements
The effects of Snow, ice and Sea-water characteristics on the σ a–Z E relationship were examined using a Simple 1-d three-or four-layer model (Reference Haas, Gerland, Eicken and MillerHaas and others, 1997; Reference C.Haas, 1998) and a 1-d five-, Seven- or nine-layer model for the deformed ice, which are modified from haas’s model (Reference Tateyama, Uto, Shirasawa, Enomoto, Chung, Izumiyama, Sayed and HongTateyama and others, 2004). figure 3a–e Show the Simulated σ a–Z E relationships from the model due to changes, respectively, in Sea-water conductivity, Sea-ice conductivity, Snow depth, depth of Saline wet Snow layer, and Sea-water-filled gaps. we used a three-layer model for figure 3a–c, a four-layer model for figure 3d and a five-, Seven- or nine-layer model for figure 3e.
Effects on the σ a–Z E relationships due to changes in (a) Sea-water conductivity, (b) Sea ice conductivity, (c) Snow depth, (d) depth of Saline wet Snow ‘slush’ layer on the ice, and (e) Sea-water-filled gaps between deformed ice floes. The floes have a maximum thickness of 1m. All calculations use Z L=0m and σ S=0mSm–1.

Effect of Sea-water conductivity
The response for different Sea-water conductivities ranging from 2270 to 2765 msm–1 Shows a large difference for ice thinner than 1m, but the effect is Small in thicker ice (fig. 3a). when the em measurement is carried out from a height greater than 4 m, this effect can be disregarded. in our Standardized model, a value of 2482 msm–1, the average of all observed Sea-water conductivities, was used.
Effect of Sea-ice conductivity
In Situ measurements of the resistivity of the antarctic and arctic Sea ice Show that the ice conductivity is highly anisotropic and the bulk ice conductivity mainly corresponds to the vertical conductivity, which is not Sensed by em measurement (Reference Thyssen, Kohnen, Cowan and TimcoThyssen and others, 1974; Reference Buckley, Staines and RobinsonBuckley and others, 1986; Reference Reid, Pfaffling, Worby and BishopReid and others, 2006). the horizontal ice conductivity is much lower than conductivity determined by archie’s law. in this Study we have no observed resistivity data, So we Simply used ice conductivity calculated from ice-core Samples with archie’s law.
The effect of change in Sea-ice conductivity is examined in figure 3b. a large effect is observed in the thicker ice (>2 m), and a Small effect in the thinner ice. figure 4 Shows the relationship between the ice-core length and conductivity of bulk ice for all Samples. there is a Significant difference between the conductivity of thin ice (≤0.4 m) and that of thick ice (>0.4 m). the conductivity of thin ice is highly variable in the range 25–183msm–1. thin ice has greater Salinity than thick ice because there has been less brine rejection, but the conductivity difference is due to temperature as well as the ice Salinity: warmer ice has higher conductivity at a constant Salinity (Reference Stogryn and DesargantStogryn and desargant, 1985). we Suggest that a mean of the average ice conductivities for ice <0.4m thick (86msm–1) and for ice >0.4m thick (52msm–1) Should be used in the Standardized model calculation (fig. 5).
Relationship between the bulk Sea-ice conductivity and ice-core length.

Relationships between the in Situ measured Z E and Z E calculated with (a) a Simple three-layer model of Snow (σ S=0mSm–1), ice (σ I=52mSm–1) and Sea water (σ W=2482mSm–1), and (b) the Standardized model. Relative errors are Shown between the in Situ measured Z E and the Z E calculated using (c) a Simple three-layer model and (d) the Standardized model.

Effect of the thickness of Snow and of Surface Slush layer
The effect of Snow-cover thickness is negligible (fig. 3c), but large differences result from the effect of the Saline wet Snow ‘slush’ (fig. 3d). the bulk Snow Salinity is generally <5 ppt, but Saline Snow with Salinity in the range 9–31 ppt was observed in this Study. Reference Massom, Drinkwater and HaasMassom and others (1997, Reference R.A., Lytle, Worby and Allison1998) reported that Such Saline Snow layers were particularly prevalent in areas of deep Snow (where the ratio of Z S to Z I was 0.2 or greater) and at heights of up to 0.03–0.05m above the interface of Snow and ice (where the Snow is Salinized by Surface expulsion of brine from the Sea ice). thick Saline Snow is also found around ridges, due to Sea-water penetration of ice with negative freeboard. in Some cases, the Salinity of the Snow is almost equal to that of Sea water.
Reference Tateyama, Uto, Shirasawa, Enomoto, Chung, Izumiyama, Sayed and HongTateyama and others (2004) investigated the influence of a Slush layer of wet Saline Snow with a density of 410–830kgm–3 and a Salinity of 25–32 ppt at the interface of Snow and ice with a negative freeboard; the Slush layer thickness was generally equal to the negative freeboard. σ a had noticeably high values in this region. in the Standardized model we assign constant values of conductivity (1500msm–1) and of thickness (0.03 m) to the Slush layer. the fresh Snow layer above this is assigned a conductivity of 0 msm–1.
Effect of Sea-water-filled gaps
figure 3e Shows another large effect due to Sea-water-filled gaps within deformed ice. for antarctic Summer ice, Reference C.Haas (1998) Suggested a four-layer model consisting of (1) a non-conductive ice layer with Snow on top (0msm–1), (2) a Seawater-filled gap with a constant thickness of 0.15m and conductivity of 2600 msm–1, (3) an ice layer beneath the gap with a conductivity of 60 msm–1, and (4) Sea water with a conductivity of 2600 msm–1. the Sea-water-filled gap in Such a four-layer model could be used to represent a Slush layer at the Snow–ice interface. Such highly conductive water-filled gaps contribute to the underestimation of ice thickness with a Simple three-layer model. in our field Studies we did not observe Such Surface water-filled gaps, but we often observed water-filled gaps between rafted ice and ridged ice.
To estimate the effect of Sea-water-filled gaps in deformed ice, we used five-, Seven- and nine-layer models developed by Reference Tateyama, Uto, Shirasawa, Enomoto, Chung, Izumiyama, Sayed and HongTateyama and others (2004). we examined the thickness ratio in the cases of one (five-layer), two (seven-layer) and three rafted floes (nine-layer) and considered Sea-water-filled gaps with thicknesses Z G of 0.10, 0.15, 0.2 and 0.30 m. these rafted ice models were applied for the maximum thickness of each region, which was established as 2, 4 and 0.8 m for first-year ice in the antarctic and arctic, multi-year ice in the arctic, and first-year ice in the Sea of okhotsk, respectively. for example, the model considers a Single floe model for 0–2m thick ice, a gap between two floes for 2–4 m thick ice and two gaps within three rafted floes for 4–6m thick ice in the case of the arctic and antarctic (Reference Tateyama, Uto, Shirasawa, Enomoto, Chung, Izumiyama, Sayed and HongTateyama and others, 2004). using the deformed-ice model, the highest correlation between the in Situ and modeled Z E was found to be 0.95, with a value Z G = 0.15 m. in the Standardized model we Set Z G = 0.15 m and the conductivity of the Sea-water-filled gap, σ G, as the Same as the Sea water (2482msm–1).
Influence of Ship hull
There is an offset in Ship-based em measurements caused by the effect of a water-filled gap in ridged and rafted ice and by a Surface Slush layer that cannot be easily modeled. Reference Reid, Worby, Vrbancich and MunroReid and others (2003) detected a Significant change in the Slope of the relationship between the modeled Z E and the true value at depth >4.5 m. this occurs because the footprint of the em31 increases with the instrument height. this difference is probably caused by the non-uniformity of the ice thickness over the larger footprint Size or by the influences of the Ship hull and open water. in this Study, Since the offset also increases with Z L and Z E, it can be attributed to the increasing footprint Size, which increases with Z E. in our Ship-based em measurements, the distance between the em instrument and icebreaker is 6 m; therefore, the effect of the Ship hull, which is highly conductive, becomes greater as Z E exceeds approximately 4.2 m. the offset dZ E can be expressed as a linear function of Z L, as Shown below:

For the Healy and Xuelong, c 1 and c 2 are 0.275 and –0.184, respectively; for the Soya, 0.141 and 0.936, respectively. c 1 and c 2 are determined empirically by comparing the difference between the true data and model value at Z L. it is difficult to Standardize these values because they depend on the mounting conditions of the instrument, for example, the Shape of the Ship and Surrounding metal projections. the dZ E value needs to be validated only once for each Ship configuration; thereafter the Same value can be used as long as the Same instruments are used.
Results from the Standardized model
We finally used a five-, Seven- or nine-layer model as the Standardized model with the following parameters. the conductivities of Snow, Slush, thin ice (≤0.4 m), thick ice (>0.4 m), water-filled gap and Sea water that are used are 0, 1500, 86, 52, 2482 and 2482 msm–1, respectively. the thicknesses of Slush and the water-filled gap are fixed at values of 0.03 and 0.15 m, respectively. the threshold thickness of a Single ice floe was taken as 2, 4 and 0.8 m for first-year ice in both the antarctic and arctic, multi-year ice in the arctic, and first-year ice in the Sea of okhotsk, respectively. from these parameters a general σ a–Z E dataset was computed with pcloop, and consequently the Synthetic data were exponentially fitted to retrieve the coefficients in the following equation:

To compare with the Standardized model, we also calculated Z E using a Simple three-layer model of fresh Snow (σ S=0msm–1), Sea ice with a constant conductivity (σ I = 52 msm–1), and Sea water (σ W=2482msm–1) and Z L = 1 m as follows:

figure 5 Shows the comparison between Z E modeled using the Simple three-layer model and the new Standardized model (which includes the effect of Sea-water-filled gaps in deformed ice, the Surface Slush layer effect and the influence of Ship hull) for all regions with the Same parameters. for the Simple three-layer model (fig. 5a and c), Z E is underestimated by a maximum relative error of –92% for the arctic, antarctic and Saroma-ko. (relative error is the difference between the modeled Z E and the in Situ measured Z E, divided by the measured Z E). this large underestimation Seems to be caused by Setting Z L as a constant height. there is Still a large variability for thin ice, with relative errors up to –60%. in okhotsk and antarctic ice, the underestimation is Significant in ice thicker than 2 m, with a relative error of up to –60% and –30%, respectively. overestimations are also Seen for Z E>6m. these errors are considered to originate from the characteristics of the em response and model faults; in other words, the 1-d three-layer model is not Suitable for thick ice.
The Standardized model results (fig. 5b and d) indicate an improved estimation for ice thicker than 2 m in the antarctic and Sea of okhotsk, which Showed a large offset, and for the arctic, which Showed an error increasing with thickness. the offset is decreased by inclusion of the effect of multi-sea-water-filled gaps. the variability in thin ice is also decreased, largely due to the inclusion of a Slush layer effect.
Inclusion of the footprint effect appears to contribute to a decrease in the variability for arctic ice. as Shown in figure 5d, the overall average error (the averaged absolute value of all relative errors for all regions; 215 Samples in total) decreased from 18% to 3.7%. the maximum relative errors decreased from 66% to 22% in thin antarctic ice, from –60% to 10% in deformed okhotsk ice, from 31% to –6.7% in arctic ice, and from –92% to –2.9% in Saroma-ko ice. the regional average errors in Z E calculated with the Standardized model are 1.8% for the arctic, 4.7% for the antarctic, 3.5% for okhotsk and 1.4% for Saroma-ko. (the regional average error is the averaged absolute value of all relative errors for each region: arctic, antarctic, Sea of okhotsk and Saroma-ko as Shown in table 1.)
The overall average error in the modeled Z S+Z I (fig. 6) is about 7%, Slightly greater than that in Z E. the regional average errors in Z S+Z I are 2.2% for the arctic, 7.0% for the antarctic, 6.5% for okhotsk and 4.4% for Saroma-ko. individual errors are within 15% except for a few cases of arctic ice that were observed near highly deformed ridges. these errors are due to the limited lateral resolution of em instruments. although the conductivity of Sea ice is generally negligible as compared to that of Sea water, em measurements of Significantly deformed ice are greatly underestimated because of the low lateral Spatial resolution of em instruments and the existence of water-filled gaps between ice Sections. the vertical resolution of em instruments also decreases with increasing Z E. thus em measurements have Some limitations. the ice thickness Should be measured at Several points around em instruments, and a three-dimensional (3-d) multi-layer model Should be used in order to overcome these limitations.
Relative errors between the modeled Z S+Z I calculated using the Standardized model and the in Situ measured Z S+Z I.

Conclusion
We validated the Sea-ice thickness estimated by the em device with the 1-d multi-layer model for different regions and Seasons and examined the accuracy of estimated ice thickness with a new model. a Standardized σ a–Z E transformation equation was developed for Sea-ice thickness measurements made with an em instrument in the arctic, antarctic, Sea of okhotsk and Saroma-ko. this equation is based on a 1-d three-layer model consisting of Snow, ice and Sea-water layers, and also considers the effects of Seawater-filled gaps in deformed ice, a Surface Slush layer and the instrument footprint. the average regional errors in the derived Z S+Z I are 2.2%, 7.0%, 6.5% and 4.4% for the arctic, antarctic, Sea of okhotsk and Saroma-ko, respectively. near highly deformed ice, a high error of >12% was observed in the modeled Z S+Z I. this error is caused by the limited lateral resolution of em instruments, and a 3-d multi-layer model Should be developed for these Situations.
Acknowledgements
We thank j. reid, a. pfaffling and i. allison for help and useful Suggestions. we thank the officers and crews of rsv Aurora Australis, uscgc Healy, r/v Xuelong and pv Soya for field Support.



