Introduction
Of the wide range of pragmatic phenomena developing throughout childhood, the ability to refer unambiguously is a communicative priority, yet the component and integrative skills driving this are still unclear. The current study focuses on the development of a foundational prerequisite for unambiguous reference: the ability to visually scan a scene and then integrate distinguishing information into felicitous referring expressions. To complement the large body of existing work investigating the later stages of reference production (e.g., assessing accessibility; perspective-taking: Allen, Hughes, & Skarabela, Reference Allen, Hughes, Skarabela, Serratrice and Allen2015: Nadig & Sedivy, Reference Nadig and Sedivy2002), here we focus on the earlier stages, when speakers collect the information they need to eventually produce fully informative referring expressions.
In learning to communicate effectively, children must learn to refer to objects unambiguously by using informative referring expressions (e.g., “the small apple” to refer to the smaller member of a pair of apples) and to avoid producing under-informative expressions (e.g., “the apple” in the same context). To achieve this, they must consider the visual aspects of the referential context that the addressee is likely to consider when identifying the intended referent. In particular, the speaker must attend to the presence of any similar objects in the shared context that the target referent must be distinguished from, and then integrate that information into their chosen referring expression. They must also consider pragmatic aspects of the exchange, such as the consequences of referring inadequately. These considerations require the integration of various types of knowledge while speech is being planned, and involve complex skills that may take several years to acquire. Our study focuses on the relationship between children's visual attention and their developing informativeness. Specifically, we ask how children come to use visual information as they mature towards a stage of being fully informative.
The ability to produce informative expressions develops throughout childhood. Children initially pass through a phase of habitual under-informativeness before they master the ability to reliably and spontaneously produce appropriately overt expressions at around seven years of age, (although full informativeness has been documented at younger ages depending on the task: Abbot-Smith, Nurmsoo, Croll, Ferguson, & Forrester, Reference Abbot-Smith, Nurmsoo, Croll, Ferguson and Forrester2016; Davies & Katsos, Reference Davies and Katsos2010; Matthews, Butcher, Lieven, & Tomasello, Reference Matthews, Butcher, Lieven and Tomasello2012; Matthews, Lieven, & Tomasello, Reference Matthews, Lieven and Tomasello2007; Whitehurst, Reference Whitehurst1976; Whitehurst & Sonnenschein, Reference Whitehurst, Sonnenschein and Dickson1981). The development of referential skills has been investigated by a wide range of studies focusing on the use of articles, pronouns vs. full nouns, and modified noun phrases (for reviews see Allen et al., Reference Allen, Hughes, Skarabela, Serratrice and Allen2015; De Cat, Reference De Cat, Serratrice and Allen2015; Dickson, Reference Dickson, Brainerd and Presley1982; Graf & Davies, Reference Graf, Davies and Matthews2014) using variants of the referential communication task. These typically require the child to unambiguously identify a target referent from arrays of similar objects for an addressee (Glucksberg, Krauss, & Weisberg, Reference Glucksberg, Krauss and Weisberg1966; Krauss & Glucksberg, Reference Krauss and Glucksberg1969). Several explanations for children's persistent under-informativeness have been proposed, e.g., difficulties in understanding that a referring expression must describe the differences between target and distractor items (Whitehurst, Reference Whitehurst1976; Whitehurst & Sonnenschein, Reference Whitehurst, Sonnenschein and Dickson1981); lack of communicative breakdown, feedback, or modelling (Matthews et al., Reference Matthews, Lieven and Tomasello2007); egocentricity and lack of perspective-taking (Glucksberg et al., Reference Glucksberg, Krauss and Weisberg1966; Nadig & Sedivy, Reference Nadig and Sedivy2002), and immature executive function skills (De Cat, Reference De Cat, Serratrice and Allen2015; Nilsen & Graham, Reference Nilsen and Graham2009; Varghese & Nilsen, Reference Varghese and Nilsen2013). Together, these various accounts highlight the need to examine the underlying cognitive prerequisites in order to explain young children's under-informativeness. To address this need, the current study measures children's visual search and linguistic skills, then examines the relationship between these skills and their referential abilities. Knowledge of these foundational skills is essential for understanding how children come to integrate them to become more proficient users of referring expressions.
Although the field stands to gain much from examining the component skills for referring, we must first ascertain how children collect the data that they then go on to manage using more sophisticated cognitive and executive skills. How does children's visual scanning behaviour influence the informativeness of their referring expressions? When do they start to make meaningful comparisons between the referent they want to talk about, and other comparable objects? How does the complexity of the display affect their ability to produce informative referring expressions? How much time is required to encode distinguishing features, and how long in advance of articulation? What enables them to identify these distinctive features and then encode them into their referential choices? To address these questions, we investigate how the prerequisite of visual scanning behaviour affects children's referential informativeness.
Although few studies of children's sentence production have used eye-movement paradigms, existing research demonstrates the value of such methods in examining links between children's visual attention, speech planning, and referential production. Bunger, Trueswell, and Papafragou (Reference Bunger, Trueswell and Papafragou2012) recorded four-year-olds’ eye-movements as they described motion events to ascertain whether children's linguistic omissions are due to attentional deficits (i.e., that children simply do not look at core aspects of a scene) or due to constraints stemming from the developing linguistic system itself. Like the adult comparison group in Bunger et al.’s study, the children fixated multiple core elements of the scene (e.g., instrument, path). However, this did not always lead them to mention these aspects, in contrast to the more explicit adults. The authors conclude that the similar eye-movement patterns yet different linguistic encoding between the two age groups reflect children's developing interface between attention and language production, or their developing linguistic production system (the latter explanation was also put forward by Norbury, Reference Norbury2014, with respect to children with language impairment). These findings leave open the possibility that even if children fixate a crucial aspect of a scene, they may not go on to encode it in their referring expressions.
Intuitively, in a referential communication paradigm, speakers must look at competitor objects to identify which features distinguish the target from these other objects, and to monitor potential ambiguity for the addressee. Deutsch and Pechmann (Reference Deutsch and Pechmann1982, p. 178) appealed for research into the link between visual scanning and referring, and Pechmann (Reference Pechmann1989, p. 98) proposed incomplete visual scanning as a reason for failures in informativeness, though did not provide developmental data to support this. More recently, studies into adults’ pre-articulatory visual scanning found that fully informative expressions are associated with fixations to a contrast referent before articulation (Brown-Schmidt & Tanenhaus, Reference Brown-Schmidt and Tanenhaus2006; Davies & Kreysa, Reference Davies and Kreysa2017Footnote 1). In Davies and Kreysa (Reference Davies and Kreysa2017), we showed that speakers were more likely to be informative when they had fixated the contrast object during multiple temporal regions and for longer before starting to speak. However, such fixations were not essential for producing a fully informative utterance: the cooperative adult speaker has a pragmatic drive to be informative and can use information gleaned from a number of sources (direct fixation, extrafoveal processing, previous exposure) in order to provide their addressee with a felicitous referring expression.
Rabagliati and Robertson (Reference Rabagliati and Robertson2017) examined three- to five-year-olds’ monitoring processes when producing informative or under-informative expressions to refer to target objects accompanied by a foil and a distractor object. They investigated proactive monitoring, i.e., saccades to target and contrast objects before naming. Unlike the adult comparison group, children across the tested age range did not typically monitor for potential ambiguity, although they did show some evidence of monitoring before producing informative expressions. Rabagliati and Robertson conclude that the absence of proactive monitoring plays an important role in children's failure in referential communication tasks. However, since there was inter- and intra-individual variability in children's monitoring and informativeness, results also show that while preschoolers are able to engage in ambiguity monitoring and go on to produce informative descriptions, they typically fail to do this.
This small body of research shows the potential for eye-tracking studies to help clarify the relationship between speakers’ ambiguity monitoring and the form of their referring expressions, and to ultimately reveal the role of visual search in children's under-informativeness. We advance this potential by further investigating lack of visual scanning as a reason for under-informativeness. We aim to reveal more subtle relationships between visual inspection and attribute encoding across development by examining the incidence of contrast fixations as a separate process to their use. We ask whether children at different points of development differ in when contrast fixations become useful. For example, do younger children need more time between fixating the contrast object and articulating an informative referring expression than older children? We also measure whether the number of distractor objects in a visual display compromises children's ability to comprehensively scan the scene and/or to refer informatively.
With a more thorough understanding of the role of visual inspection in children's referential informativeness, we can move towards an understanding of how children manage that visual information using their developing executive skills. For effective referential communication, children must be able to (i) attend to target and competitor referents, (ii) monitor for ambiguity, (iii) identify precisely what distinguishes the target from its competitors, (iv) update a situation model based on referent accessibility from multiple social perspectives, and then (v) encode any distinguishing features into their chosen referring expression. They may also need to inhibit prepotent, higher frequency under-informative expressions, e.g., “the car” in a multiple-car context. Clearly, referential planning is both cognitively and linguistically demanding: the child must control their attentional resources as well as accessing the appropriate lexical and syntactic forms.
By measuring selected aspects of children's linguistic and cognitive abilities (see ‘Materials’ for details of all assessment instruments) in addition to their eye-movements and chosen referential forms, the current study examines the cognitive components of referring. To complement the live measurement of participants’ eye-movements as they refer, we measure their visual search efficiency, with the prediction that better visual search abilities will be associated with more informative referring in our task. We also take two measures of linguistic ability: receptive vocabulary and perspective-taking in a discourse context. Receptive vocabulary is a key index of language development (Christensen, Zubrick, Lawrence, Mitrou, & Taylor, Reference Christensen, Zubrick, Lawrence, Mitrou and Taylor2014), and strong correlations have been found between receptive vocabulary size and speed of language processing in three- to ten-year-olds (Borovsky, Elman, & Fernald, Reference Borovsky, Elman and Fernald2012). Thus, higher scores in receptive vocabulary may be associated with more informative referring. The measure of discourse perspective-taking requires the child to identify characters contrastively where the addressee cannot see them. Similarly, our task requires a consideration of addressee needs; the child must understand that their addressee requires a modified noun to find the target object. Thus, higher scores on the perspective-taking task might be associated with more informative referring. In sum, we use children's performance on these three tasks to investigate drivers of under-informativeness, to complement our analysis of children's scanning behaviour before and during their speech production within the referential task. By doing this, we hope to reveal whether under-informativeness is more closely associated with children's developing language or with their visual search abilities. The tests also act as an additional screen for participants with an atypical profile. All of the tests are well established and widely recognised as reliable and valid assessment instruments for capturing their intended constructs.
Finally, we aim to clarify the developmental trajectory towards habitual informative referring by comparing performance at different ages. In planning even simple referring expressions that distinguish a target from a single competitor, there are heavy demands on children's developing language and cognitive skills. Multiple skills must be deployed in the moment: targets must be analysed, ambiguity monitored, and descriptions planned and produced. Evidence suggests that these component skills are in place relatively early: five-year-olds can articulate differences using referring expressions when explicitly asked (Whitehurst & Sonnenschein, Reference Whitehurst, Sonnenschein and Dickson1981); two-year-olds are sensitive to others’ knowledge states for referential purposes (O'Neill, Reference O'Neill1996), and adjective–noun constructions are within the reach of three- to five-year-olds (Nicoladis, Reference Nicoladis2002). However, integrating these skills (or perhaps realising that such integration is necessary) appears to be a significant challenge for children, since they persist in spontaneously under-informing into their seventh year (Whitehurst, Reference Whitehurst1976; though note that this varies with task demands: Girbau, Reference Girbau2001). Our age groups of interest capture linguistic, cognitive, and eye-movement profiles at two time-points: at the stage of habitual under-informativeness (four-year-olds), and once informativeness begins to stabilise (seven-year-olds).
In sum, our study combines experimental methods from language production research and those using eye-movements as an index of cognitive processes to investigate differences in the rate at which children of four and seven years of age monitor and integrate information about referential ambiguity into their referential choices. In order to explore the relationship between referential abilities and other cognitive skills, we also measure children's linguistic and cognitive profiles outside the referential domain. We ask three main research questions:
1. What is the developmental trajectory in referential informativeness when children refer to objects in simple and more complex visual scenes?
2. What are the linguistic and cognitive profiles of children who tend to provide under-informative referring expressions?
3. Do fixations to contrast objects boost referential informativeness, and how is this affected by age and visual complexity?
We hypothesise that: (1) Four-year-old children will frequently produce under-informative referring expressions, whereas seven-year-olds will provide more informative ones. This difference is hypothesised to be clear in simple displays but may break down in complex displays where the cognitive demands are greater; (2) Children who tend to provide under-informative referring expressions will score lower on tests of language ability or visual search; (3) In both age groups, the contrast object will be fixated more frequently before informative referring expressions than before under-informative referring expressions.
Method
Participants
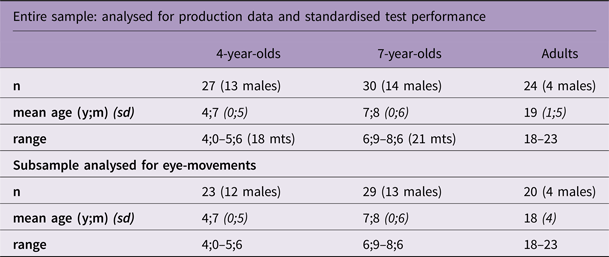
Twenty-seven four-year-olds and 30 seven-year-olds were recruited from nurseries, schools, and playschemes in Leeds. Table 1 contains participant profile information. All were monolingual native speakers of British English, and all had normal or corrected-to-normal vision and hearing. Each participated voluntarily with the informed consent of their caregiver, and each child gave their assent before starting the tasks. In addition, 24 adults were recruited from the University of Leeds for a separate study with a similar methodology (reported in Davies & Kreysa, Reference Davies and Kreysa2017). We refer to this adult data as a comparison to the children's patterns, and present this control group data at relevant points to show fully developed referential and visual behaviour.
Participant Profiles for the Original Sample and after Exclusions from the Eye-movement Analysis (see ‘Data cleaning’ for exclusion criteria)

Materials: referential communication task
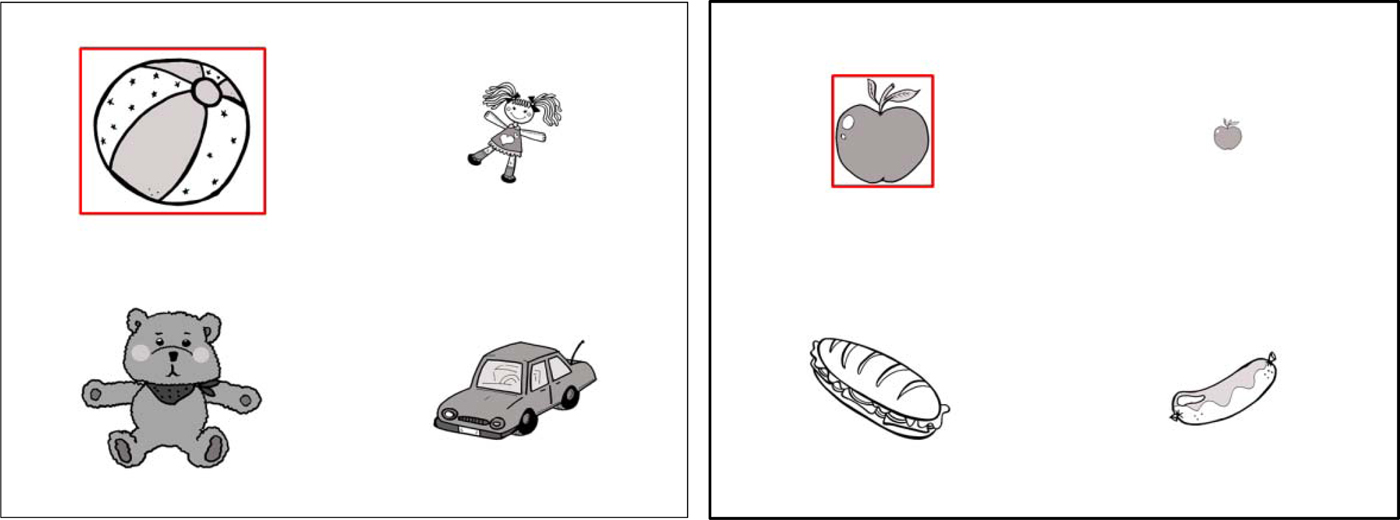
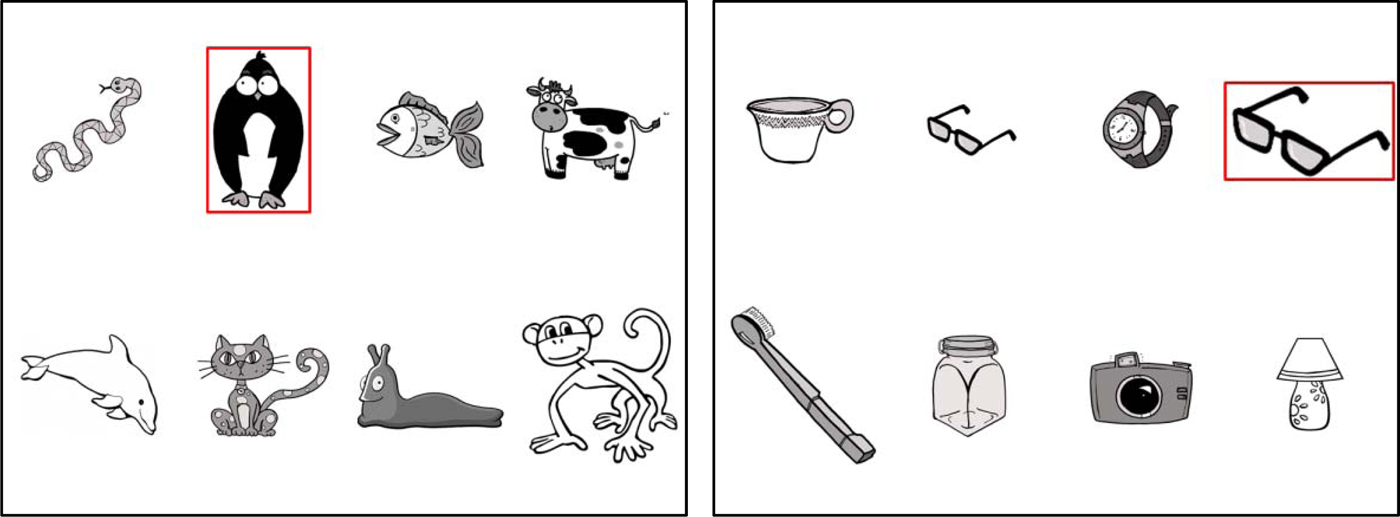
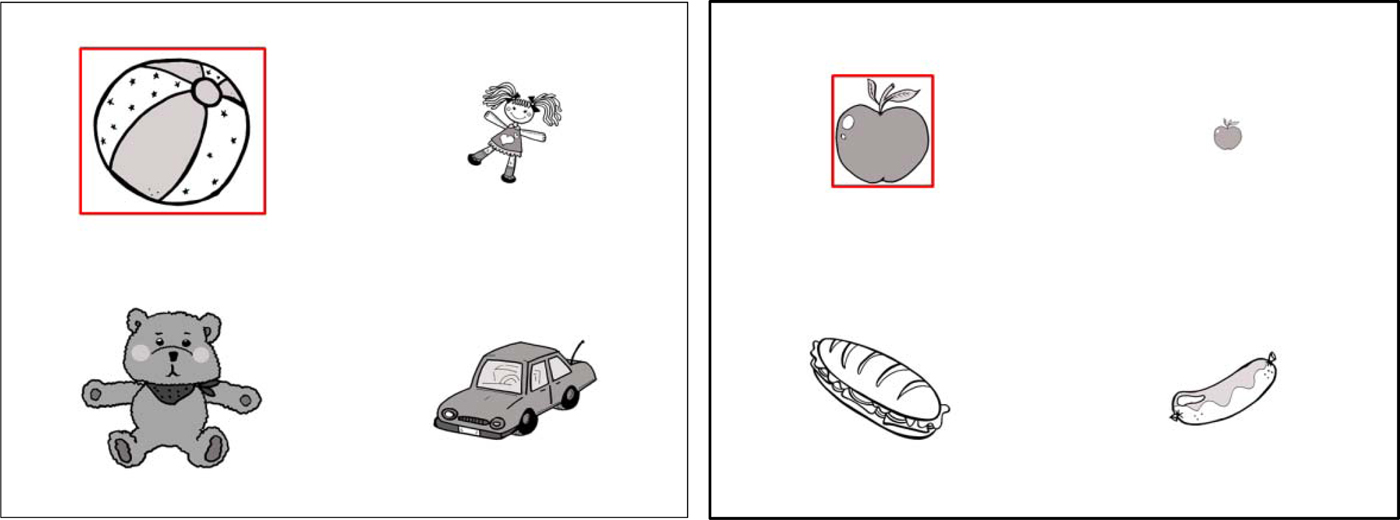
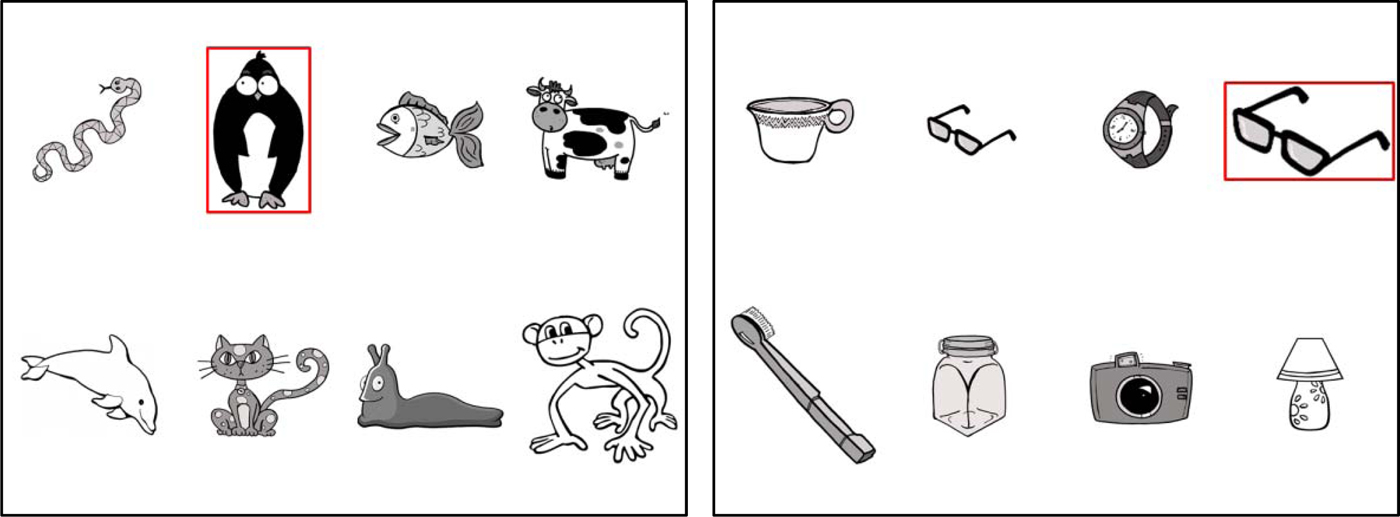
The stimuli consisted of 44 displays of everyday objects, grouped into semantically related sets, e.g., animals, food, household objects, clothes. Sixteen displays were critical items, 24 were fillers, and four formed the practice block. Of the critical items, half of the displays contained four objects and half contained eight objects (see Figures 1 and 2 for example displays), constituting simple and complex displays, respectively. All images were presented in grayscale to limit bias from colour salience. They fitted within areas of interest measuring 300 × 300 pixels (four-object displays) and 235 × 235 pixels (eight-object displays). Participants were seated 60–70 cm from the 17-inch monitor screen (1280 × 1024 resolution), and the areas of interest surrounding each object spanned approximately 7° of visual angle for four-object displays and 5.5° for eight-object displays. Half of the critical displays were contrast-absent displays with only one referent of each noun category (e.g., a ball, a doll, a teddy, and a car). The other half were contrast-present displays featuring two referents of the same noun category, one of which was the target and thus required disambiguation (e.g., a large apple, a small apple), as well as two unrelated objects (e.g., a sausage and a sandwich). Target objects always differed from their contrast mates by size (large vs. small); no other adjectives were required or would discriminate the target from the contrast object. In the four-object displays, the contrast-absent items contained three distractor objects and the contrast-present items contained two. In the eight-object displays, the contrast-absent items contained seven distractors and the contrast-present items contained six. The 16 critical items all appeared in four pseudo-randomised lists, counterbalanced for target attribute and for block order. Thus, half the participants saw, e.g., the small apple as the target, while the other half saw the large apple as the target. No object appeared as target more than once throughout the experiment, and the position of the target and the contrast objects was rotated around each slot of the four- and eight-object displays. Stimuli were presented and eye-movements recorded using Tobii Studio software, v. 3.1.6.
Four-object stimuli. Left panel shows a contrast-absent item and right panel shows a contrast-present item. Target is highlighted in both panels.
Eight-object stimuli. Left panel shows a contrast-absent item and right panel shows a contrast-present item. Target is highlighted in both panels.
The 24 filler items were of four types: two-object picture displays, two-object number displays, four-object picture displays, and eight-object picture displays. In the four- and eight-object filler displays, targets differed from contrast mates by pattern (stripy vs. spotty). The fillers were partly designed to mask the pattern inherent in the critical trials, i.e., when a display contained a contrast set, the target object in the critical trials was necessarily a member of this set. In order to reduce the likelihood of the children predicting the identity of the critical target before it was highlighted, half of the filler items featured a target object which was not a member of the co-present contrast set.
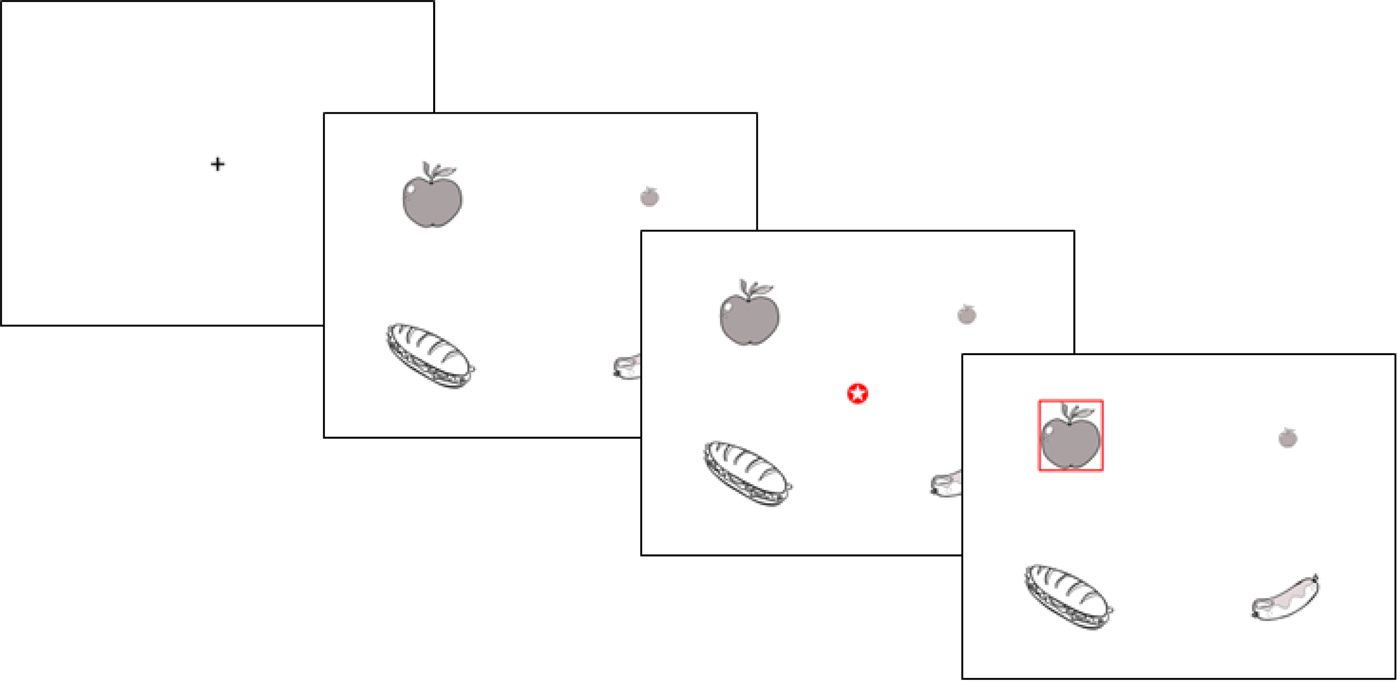
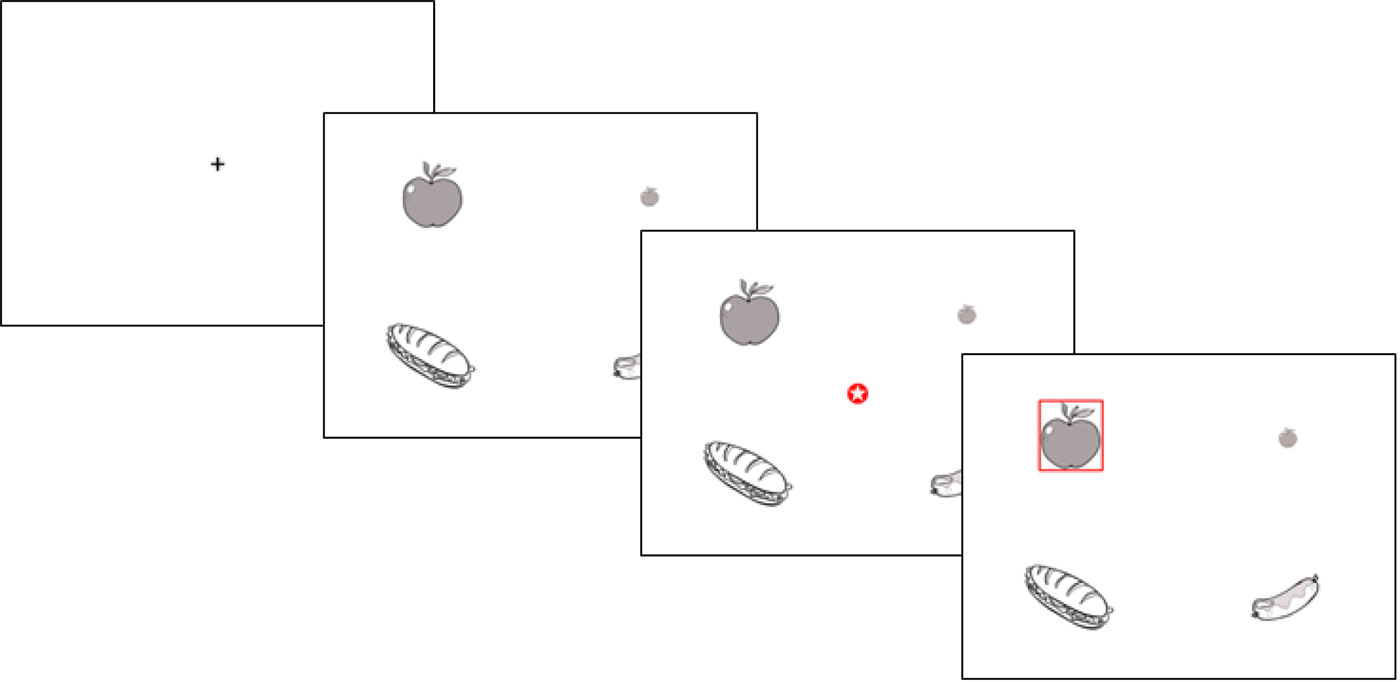
The sequencing of each trial is depicted in Figure 3. The experiment was conducted using a Tobii X120 remote desk-mounted eye-tracker, a Dell flat panel monitor visible to the participant, and a Lenovo W540 laptop running the experimental software, visible to the experimenter. Participants’ utterances were recorded using an omnidirectional tabletop microphone. The adult design and procedure was comparable to the child experiment, though there were double the number of items and dimensions involved, and the exposure time for the preview and target-highlighted displays were each 1000 ms shorter. For full details, see Davies and Kreysa (Reference Davies and Kreysa2017).
Trial sequence: (1) the fixation cross was presented for 1000 ms, followed by; (2) a preview of the displays without the target highlight (3000 ms for four-object displays; 4000 ms for eight-object displays); (3) a red fixation cross then appeared within the preview for a further 1000 ms; (4) the fixation cross disappeared and the target was highlighted with a red frame around the object. This final display remained visible for 5000 ms, during which time the participant produced their utterance using the form “click on the X”.
Materials: standardised tests
Three standardised tests were administered to correlate participants’ linguistic and cognitive abilities with their informativeness in the referential communication task. As an index of receptive language ability, the British Picture Vocabulary Scale (BPVS-III) was used, normed for three- to sixteen-year-olds (Dunn, Dunn, Styles, & Sewell, Reference Dunn, Dunn, Styles and Sewell2009). For visual search efficiency, the Bug Search task from the Wechsler Preschool and Primary Scale of Intelligence (WPPSI-IV) battery was used (Wechsler, Reference Wechsler2013). This is a processing speed subtest for ages 4;0–7;7. It measures participants’ perceptual speed, short-term visual memory, cognitive flexibility, visual discrimination, and concentration whilst they match one of five images to a reference image. In place of the WPPSI-IV Bug Search task, the adult comparison group did the visual search task from the PEBL battery (Mueller, Reference Mueller2014; results reported in Davies & Kreysa, Reference Davies and Kreysa2017). As a measure of perspective-taking ability in a discourse context, the Short Narrative subtest from the Diagnostic Evaluation of Language Variation (DELV-ST) was administered, recommended for use with four- to nine-year-olds (Seymour, Roeper, & De Villiers, Reference Seymour, Roeper and De Villiers2003). The scoring system for each instrument is explained in the ‘Results’ section.
Procedure
Participants were tested individually in a quiet room in their nursery, school, or playscheme setting. The nursery children's key worker sat with them during their session. Children were welcomed, briefed on the content of the session, and then gave their assent. The order of tests was the same for all participants and was as follows (with approximate durations):
1. The BPVS-III, administered on hard copy according to the manual's instructions (10 minutes).
2. Object recognition task. This was a bespoke PowerPoint presentation containing 34 target images from the referential communication task, displaying one object per slide. These images included all targets from the critical items plus ‘object’ targets from the filler items (i.e., numerals and geometric shapes excluded); see ‘Appendix’ for the list of target objects. Its function was to check that the children could name all of the objects before the eye-tracking experiment began. As the child named each object, the experimenter advanced to the next slide, asking “What's that?” for each image. All children were able to name all images (2 minutes).
3. Referential communication task. Participants were seated in front of the eye-tracker and monitor, with the experimenter seated at the laptop nearby. The two monitors were not mutually visible. A five-point calibration was performed, then participants were instructed as follows: We're going to play a game. Your job is to help me find some pictures. You'll see some pictures on the screen. I can see them too, but they're not in the same place on my screen. Look at the pictures on your screen. A red box will appear around one of them for you. You should tell me to click on that picture, like “click on the dog”. You'll also see a red star – you should always try to look at the red star when you can see it. We'll practise a few times first and then we'll play the game. Do you have any questions? […] Are you ready to start practising? We emphasised that the participants’ role was to tell the experimenter to click on the highlighted item, and the experimenter-addressee maintained the impression of being highly motivated to find the objects throughout the course of the experiment. During the experiment, the experimenter clicked a mouse to signal that they had found the referent roughly one second after the offset of the participant's utterance, regardless of the form of referring expression used. No other feedback was given. The task was split into four blocks of equal length with voluntary breaks between (10 minutes).
4. WPPSI-IV Bug Search, administered on hard copy according to the manual's instructions (4 minutes).
5. The DELV-ST Short Narrative subtest, administered on hard copy according to the manual's instructions (3 minutes).
The children were debriefed, thanked, and received a certificate for their participation. The whole testing session lasted approximately 30 minutes. The study was approved by the Faculty Research Ethics Committee at the lead author's institution.
Data preparation: utterance coding
The utterances were transcribed and coded from the audio-recording made during the testing session. If a referring expression contained minimally sufficient information for the addressee to uniquely identify it (i.e., with appropriate modification in the contrast-present condition; “click on the big apple”) it was coded as optimal. If it lacked such information (e.g., “click on the apple” in the contrast-present condition) it was coded as under-informative. Since we were interested in participants’ eye-movements leading up to their first attempt at a referring expression, utterances which were initially under-informative but subsequently self-corrected to an informative form were coded as under-informative (e.g., “click on the glasses (.) the big ones”). This applied to six out of the 432 critical referring expressions in the four-year-olds’ data (1%), and 17 out of the 480 critical referring expressions in the seven-year-olds’ data (3.5%). Referring expressions which contained more information than necessary for unique reference resolution (e.g., “click on the little tie” in a display with a single tie) were coded as over-informative. Utterances which referred to an incorrect target were coded as such and excluded from subsequent analysis: this applied to nine out of the 432 critical referring expressions in the four-year-olds’ data (2%), and one out of the 480 critical referring expressions in the seven-year-olds’ data (0.2%). Trials in which the participants did not respond or gave incomprehensible responses were coded as no response: this applied to 11 out of the 432 critical referring expressions in the four-year-olds’ data (2.5%), and three out of the 480 critical referring expressions in the seven-year-olds’ data (0.6%). Only the optimal, under-informative and over-informative items went forward for analysis. The other response types were excluded, totalling 6% of the four-year-olds’ data and 4% of the seven-year-olds’ data.
Data preparation: eye-tracking data
Onsets and offsets of all critical utterances were calculated using the Sound Finder function in Audacity (Audacity Team, 2014), and then manually checked and adjusted where required (e.g., where the function had falsely detected a background noise as the speaker's voice). These timestamps were merged into the eye-tracking data exports to provide utterance duration information. By cross-referencing utterance duration information with the timestamps for onsets and offsets of each visual stimulus, we split the data into four temporal regions: preview, pre-utterance, utterance, and post-utterance. The preview temporal region was the period between the array first appearing and the target being highlighted (i.e., Screen 2 in Figure 3). The pre-utterance temporal region was the period between the target being highlighted and the speaker beginning their utterance. The utterance and the post-utterance temporal regions were not analysed so will not be discussed further.
Areas of interest (hereafter ‘objects’) in the displays were coded as Target, Contrast (if present), and Distractor. Fixation counts and fixation durations to each object during each temporal region were then derived.Footnote 2 Finally, the referential form coding (under-informative; informative) was merged with the eye-tracking data.
Results
Referential communication task: production data
For measuring the form of referring expressions from participants’ production data (hypothesis 1), the experiment had a 2 × 2 × 2 design (age group × contrast × display complexity). Age group varied between participants (four-year-olds; seven-year-olds). Visual contrast (present; absent) and display complexity (four-objects; eight-objects) were manipulated within participants. The dependent variable was the mean percentage of each participant's referring expressions at each level of informativeness: % under-informative, % optimally informative, and % over-informative.
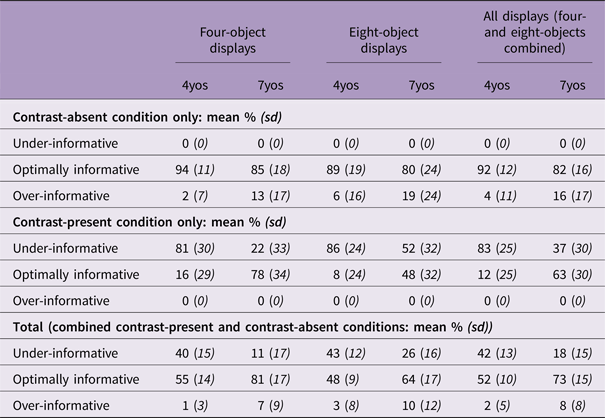
In an analysis of all production data (contrast-present and contrast-absent conditions; four- and eight-object displays, see Table 2), four-year-olds were equivocal in the informativeness of their referring expressions (under-informative M = 42%, SD = 13; informative M = 52%, SD = 10),Footnote 3 whereas seven-year-olds were more frequently informative in their referential choices (under-informative M = 18%, SD = 15; informative M = 73%, SD = 15).Footnote 4
Mean Rates of Referential Informativeness as a Percentage of all Expressions Produced. Percentages Summing < 100 within Informativeness Group Are Due To Exclusions (see footnotes 3 and 4).

Because over-informativeness was rare in the data, statistical comparisons focus on rates of optimal informativeness vs. under-informativeness. Hence, only the contrast-present condition went forward for further analysis, since it is not possible to examine under-informativeness in the contrast-absent condition (where a bare noun would constitute informative referring). In addition, the contrast-present condition is in focus due to its importance in the eye-movement analysis.
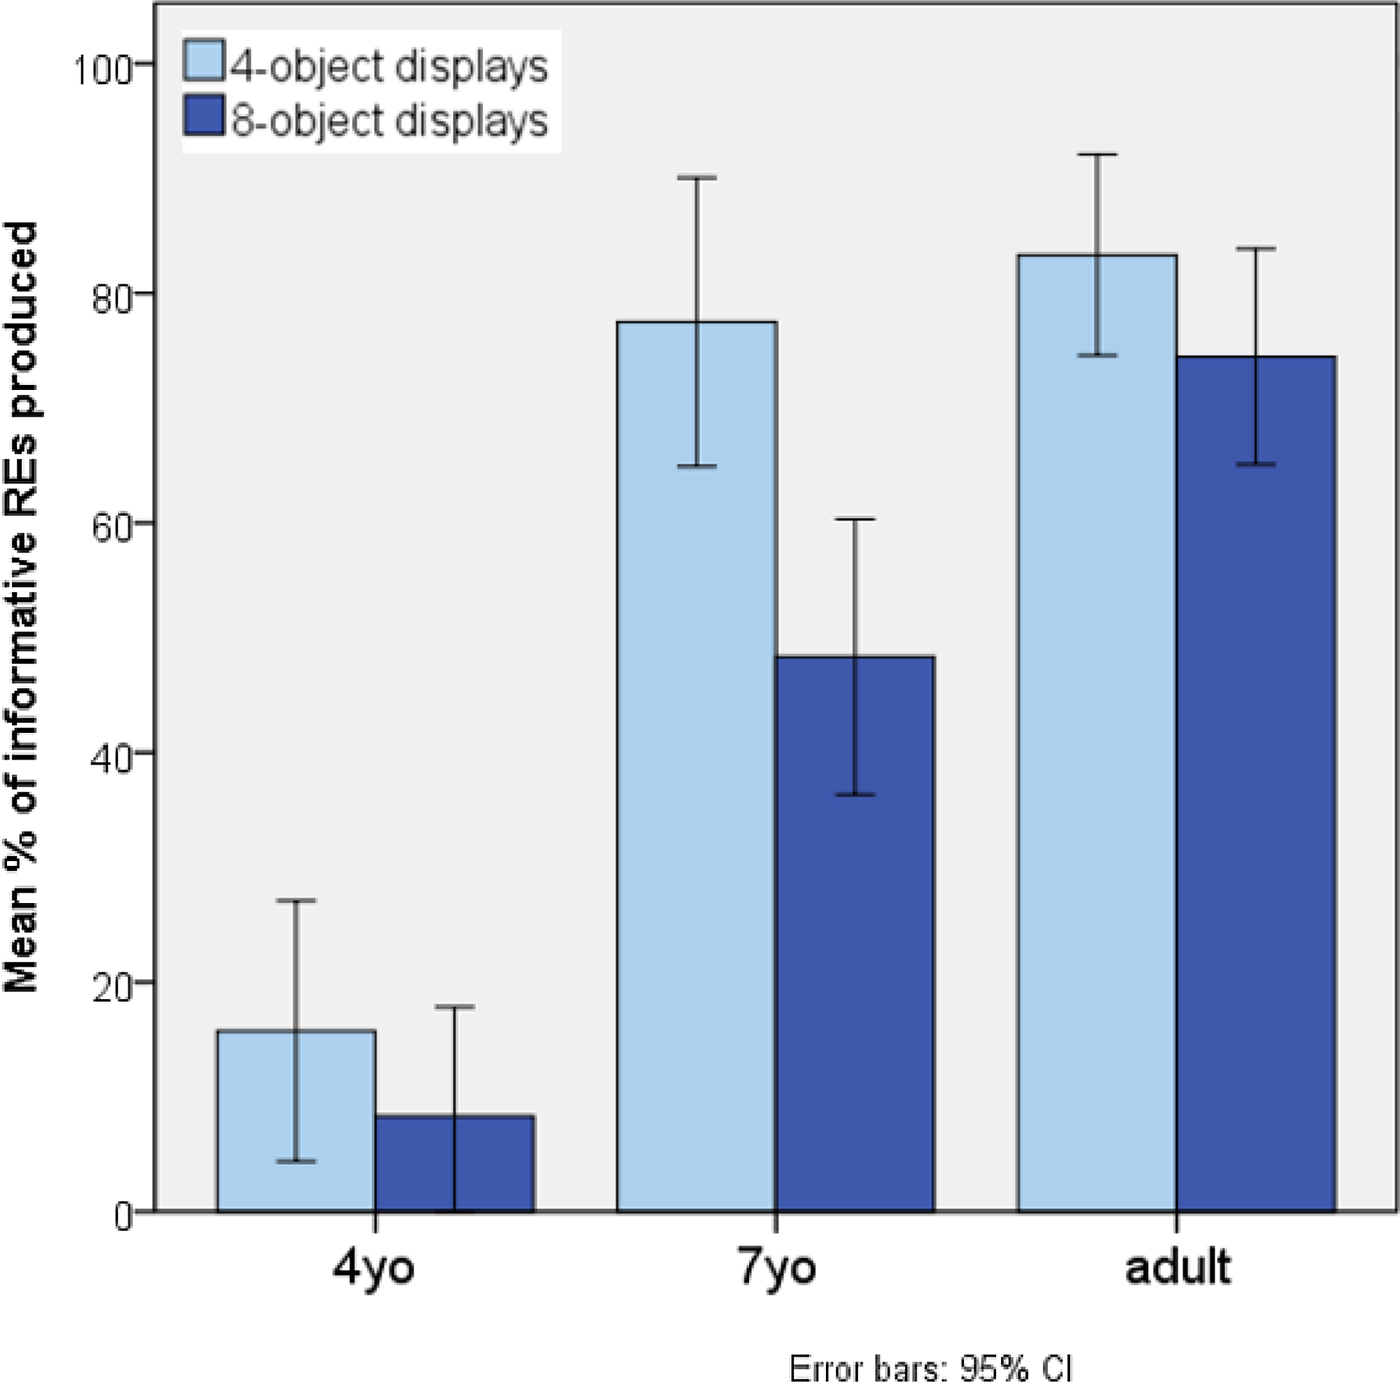
Figure 4 shows the mean rates of informativeness as a percentage of all expressions produced, by age group and display complexity; contrast-present condition only. For comparison, Figure 4 also includes the rates of informativeness in the adult control group, though the statistical analysis is reported for the two child groups only (see Davies & Kreysa, Reference Davies and Kreysa2017, for details of the adult data). Collapsing across the two levels of display complexity, four-year-olds were largely under-informative in their referential choices (83% under-informative and 12% informative), whereas seven-year-olds were more frequently informative (37% under-informative and 63% informative). The adults were largely informative at a mean rate of 79%. A two-way mixed-measures ANOVA with the factors age and display complexity found a main effect of age on informativeness (F(1,55) = 47.27, p < .001, η2p = .46). There was also a main effect of display complexity on informativeness, such that participants were significantly more informative with four- than with eight-object displays (see Table 1 for means and SDs) (F(1,55) = 38.2, p < .001, η2p = .41). Finally, there was a significant interaction between age and complexity, i.e., increased display complexity compromised informativeness for the seven-year-olds to a greater extent than the four-year-olds (F(1,55) = 13.52, p = .001, η2p = .2). This is likely driven by floor effects in the younger group.Footnote 5
Mean rates of informativeness as a percentage of expressions produced, by age group and display complexity; contrast-present condition only.
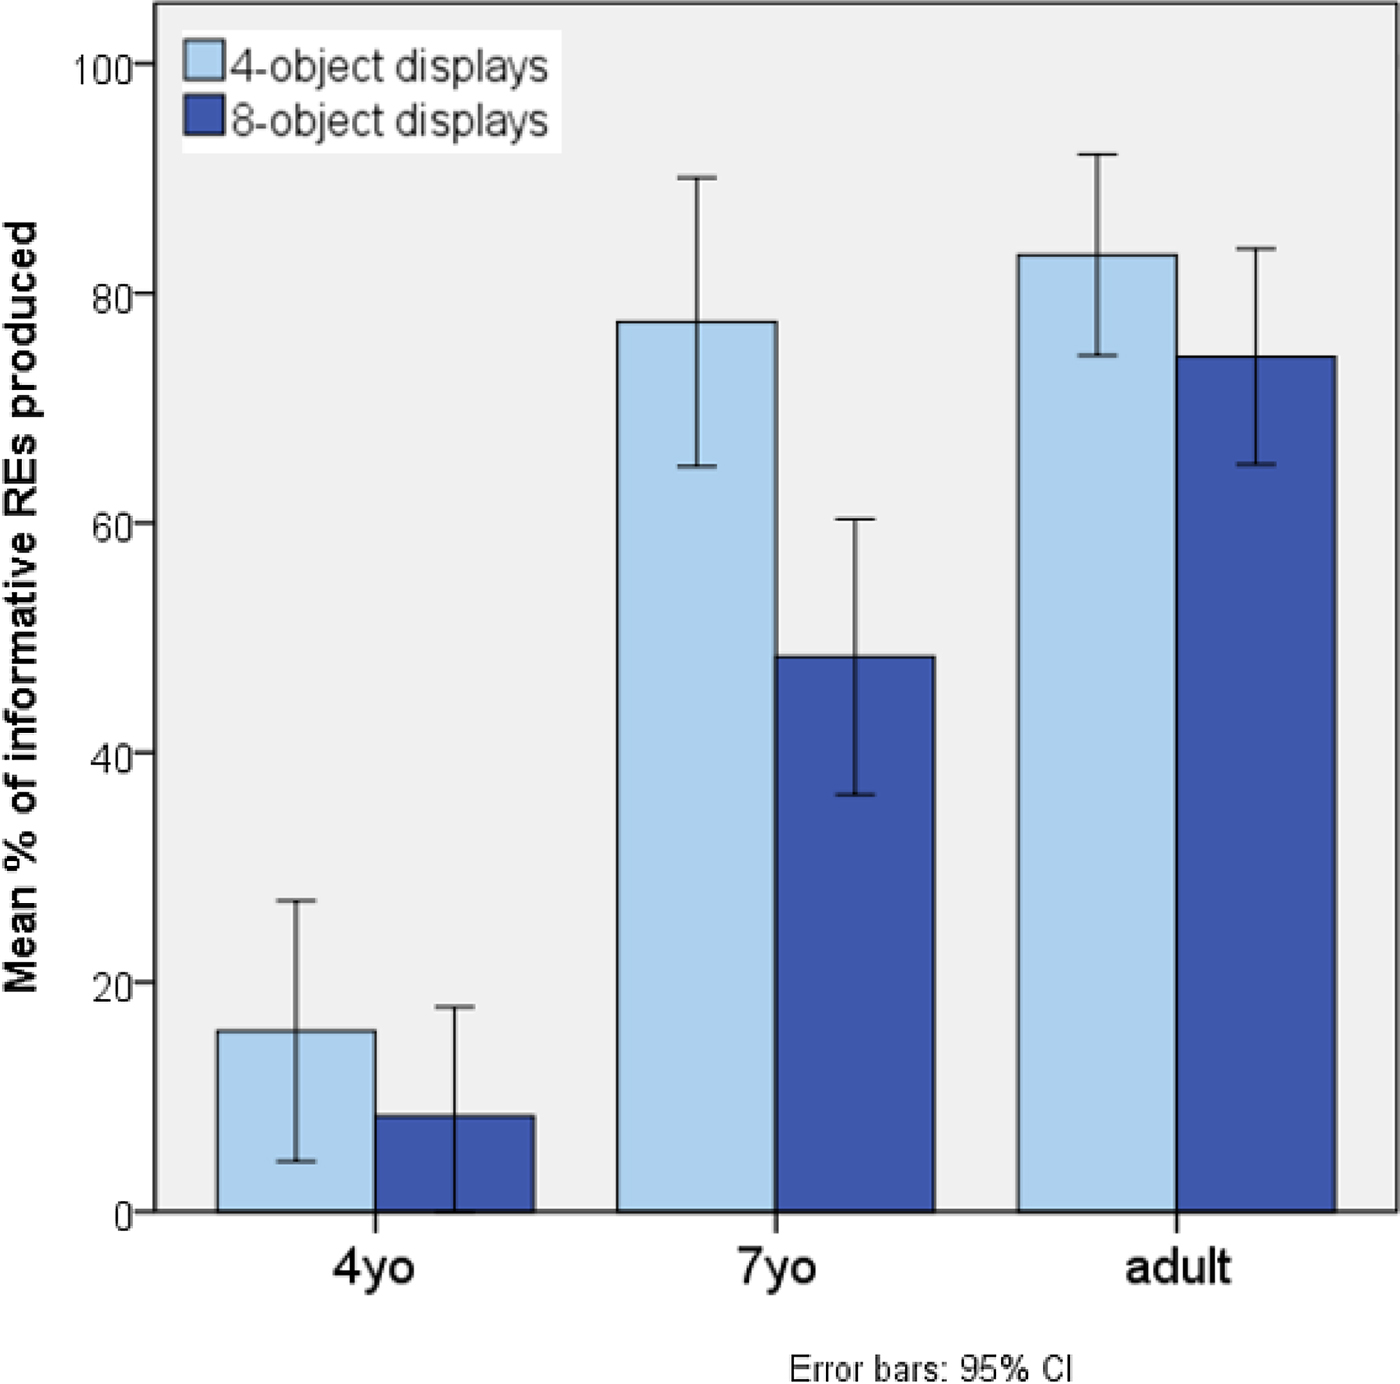
As predicted by our first hypothesis, the younger children were largely under-informative when referring to objects. Their older counterparts were less so, though not to the extent of adult speakers. Both child groups produced fewer informative expressions when displays were complex, and this effect was more pronounced in the older group.
Relationships between rates of informativeness and performance on standardised tests
This analysis tests the relationship between rates of informativeness of the children's referring expressions (as a percentage of each child's referring expressions) and their performance on the standardised tests.
Scoring of the test battery
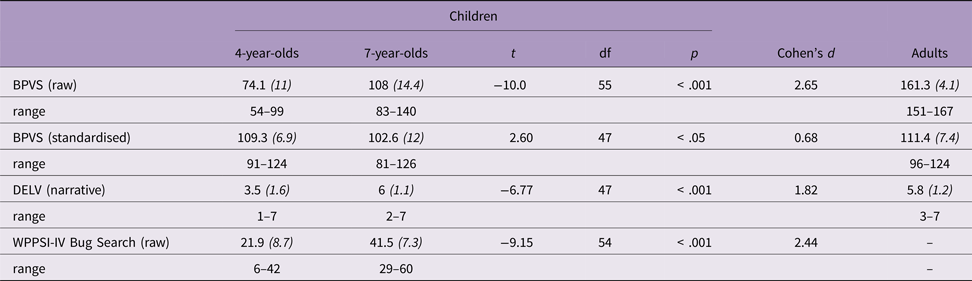
For the BPVS-III, raw and standardised scores were calculated using the test manual. Performance on the DELV-ST was a score out of 7. For the WPPSI-IV Bug Search visual search task, we counted the total number of items matched correctly within the time limit of 2 minutes, as per the manual. As expected, the four-year-old group scored significantly lower than their seven-year-old peers on the BPVS (raw scores), the DELV, and the Bug Search. Notably, the four-year-olds scored significantly higher than their older peers on the BPVS relative to age norms (standardised scores), suggesting that the younger sample had relative strengths in receptive vocabulary. All effect sizes were small. Scores are shown in Table 3.
Scores on Standardised Tests: Mean (SD).

Correlational analyses
A Pearson correlation coefficient was computed to assess the relationship between informativeness of referring expressions (contrast-present condition only) and performance on the standardised tests. Within each child group, there were no significant correlations between the proportion of referring expressions that were under-informative and any of the standardised measures, (all ps > .1; all rs < .3). This was the case when correlations were run across the two levels of display complexity, and when the four-object and eight-object conditions were analysed separately. Thus, our second hypothesis was not supported. That is, the informativeness of children's referring expressions is not associated with their receptive language ability, their narrative ability, or their visual search capabilities, as measured using the selected tools. This lack of significant associations may have been due to the minimal variance in the informativeness rates in both the four-year-old and the seven-year-old groups.
Note that when correlations were run across the entire child sample (n = 57), we found significant positive correlations between informativeness and scores on the BPVS (raw) (r = 0.58, p < .001), scores on the DELV (r = 0.39, p < .01), and scores on the Bug Search (r = 0.55, p < .001). No relationship was found between informativeness and BPVS (standardised) (r = –0.19, p = .16). That is, the higher the children scored on tests of receptive vocabulary, narrative ability, and visual search, the higher their rates of informativeness. However, since these correlations did not remain once age was controlled (all ps > .7; all rs < 0.05), nor were they significant within each age group, age appears to be driving the relationship in the whole sample: older children tend to be more informative and score higher on the tests because their abilities in all areas improve with age, rather than their informativeness and language/cognitive abilities being directly related.
Eye-movement data
For measuring the relationship between eye-movements and informativeness (hypothesis 3), each analysis used a different combination of predictor and outcome variables. Since the eye-movement analyses focused on looks to the contrast object (which was of course absent in the contrast-absent condition), only the contrast-present level of this variable was retained. The first analysis (proportion of contrast-fixated trials resulting in informative expressions) took age, visual complexity, and presence or absence of fixations to the contrast object during two temporal regions (preview; pre-utterance) as predictors, and utterance type as outcome (though only with two levels: under-informative and informative: over-informative trials were excluded due to their low frequency in the data). The second analysis (proportion of under-informative trials preceded by a contrast fixation) took age and presence of contrast fixations as predictors (with the two temporal regions analysed separately) and utterance type as outcome. The third analysis (contrast fixation duration) took age and utterance type as predictors, and total fixation duration to the contrast object during the same temporal regions as the outcome.
Data cleaning
Since the eye-movement analyses focus on fixations to the contrast object, the contrast-absent condition is not considered here. Five participants (four from the four-year-old group; one seven-year-old) were wholly excluded from the eye-tracking analysis since in each of these cases less than 20% of the samples recorded by the eye-tracker were usable, leaving the remaining participant samples at n = 23 and n = 29 for the younger and older groups respectively (see Table 1 for details). A more conservative cut-off (< 50%) had previously been used in analysing the adult data, thus four adult participants were also excluded from the eye-tracking analyses.
In addition, 19 individual trials from the four-year-olds’ data and 28 trials from the seven-year-olds’ data had to be removed from the eye-movement analyses for one of five reasons: (i) no oral response; (ii) early articulation, i.e., a participants’ utterance occurred before the target was revealed; (iii) late articulation, i.e., the utterance started after the offset of the target display; (iv) the incorrect target was referred to; (v) over 50% of the samples in the eye-tracking data for a particular trial had validity codes of 4-4, signalling that neither eye was found by the eye-tracker. After these exclusions, 90% of the four-year-olds’ original dataset and 88% of the seven-year-olds’ were included in the analyses.
Proportion of contrast-fixated trials resulting in informative expressions (combined pre-articulatory regions)
As an initial course-grained measure of the relationship between fixation of the contrast object and speaker informativeness, we analysed the proportion of valid trials in which children in each age group fixated the contrast object during the preview and pre-utterance temporal regions before they produced an informative vs. under-informative utterance, by display complexity. Trials that were invalid in one or both of these temporal regions were excluded, leaving 70% of the four-year-olds’ original dataset and 69% of the seven-year-olds’.
This analysis allows us to examine the role of contrast fixations as a predictor of informativeness. We focused on those trials which contained a contrast fixation in either the preview region, the pre-utterance region, or both. This represented 80% of the four-year-olds’ valid trials, 88% of the seven-year-olds’ valid trials, and 80% of the adults’ valid trials (n = 102, n = 142, and n = 235, respectively).
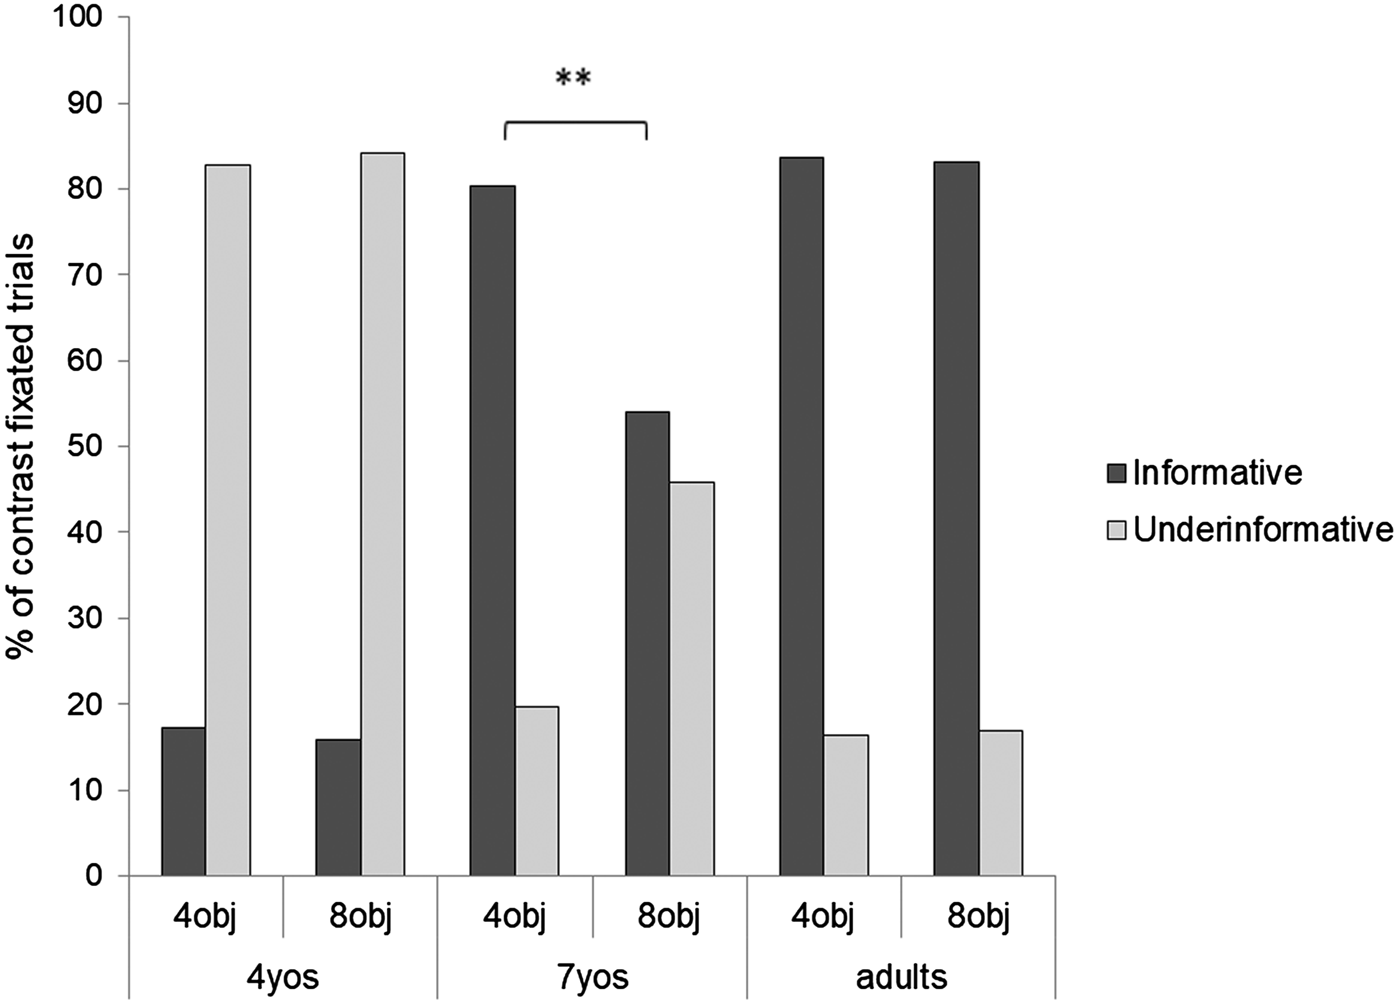
As Figure 5 shows, when four-year-olds fixated the contrast object, they seldom went on to use it in their referring expressions (only 17% of contrast-fixated trials were informative across display complexity conditions). A clear difference can be seen in the seven-year-olds, who frequently went on to use the information from the contrast fixation in their expressions (69% of contrast-fixated trials were informative across display complexity conditions). Adults almost always went on to use the information from the contrast fixation in their expressions (83% of contrast-fixated trials were informative across display complexity conditions). Importantly, although the older children's rate of informativeness is in line with the adults’ for the four-object displays, they were significantly hampered from reaching adult levels by the eight-object displays. A chi-square analysis reveals a significant association between informativeness and display complexity in the seven-year-olds (χ 2(1) = 11.13, p = .001, Cramer's V = .28, odds ratio = 1.97), with no association between informativeness and complexity for the four-year-olds (χ 2(1) = 0.03, n.s.) or the adults (χ 2(1) = 0.007, n.s.).
Proportion of all trials with pre-articulatory contrast fixations which resulted in informative or under-informative referring expressions, by age and display complexity. Since the percentages are based on an absolute frequency out of all trials (i.e., not averaged over participants or trials), there is no variance to report.

This analysis suggests that the four-year-olds struggled to integrate the information they gleaned from fixating the contrast during utterance planning. Despite looking at the contrast object, they did not go on to provide fully informative expressions in the same trial. On the other hand, contrast fixations boosted informativeness for the seven-year-olds who, like adults, were able to use the information from the contrast object in their ensuing informative expressions. However, in contrast to adults, the older children's informativeness was significantly compromised by display complexity.
Proportion of under-informative trials preceded by a contrast fixation (separated by pre-articulatory regions)
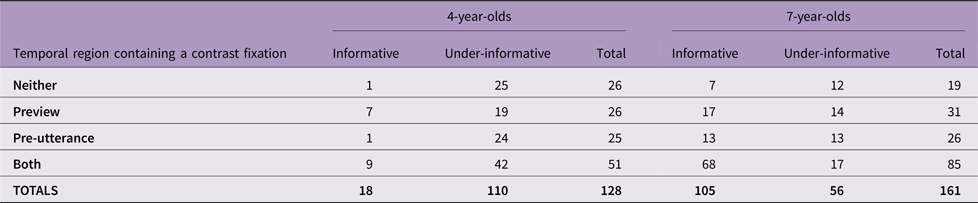
Since we found a clear by-age difference in the relationship between fixation pattern and informativeness above, a finer-grained measure of fixation pattern over separate temporal regions was used to further examine the effect of age on the use of contrast fixations in informativeness. Here we focus on the number of trials in which children in each age group fixated the contrast object during the preview, pre-utterance, both, or neither temporal region before producing an under-informative utterance, as a proportion of all valid trials. The two display complexity conditions were combined to boost power since there were low counts of optimally informative utterances for the younger group (see Table 4).
Frequency of Valid Trials of Each Fixation Pattern and Each Utterance Type

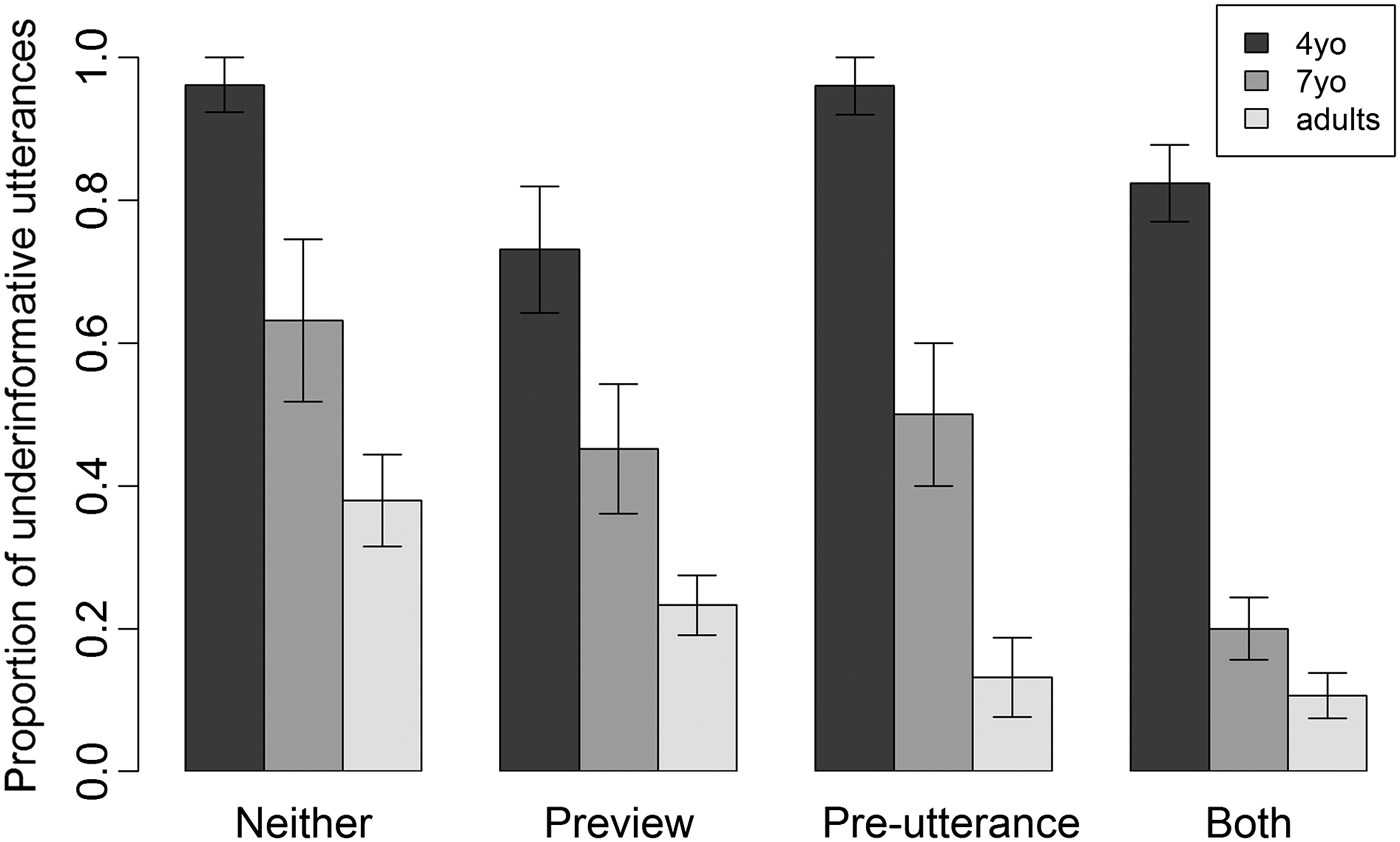
Trials were categorised as showing one of four fixation patterns: a contrast fixation in: (i) neither the preview nor the pre-utterance region; (ii) the preview region alone; (iii) the pre-utterance region alone; and (iv) both the preview and the pre-utterance regions. Trial frequencies of each fixation and utterance type are shown in Table 4, with proportions shown in Figure 6.
Mean proportions of under-informative trials following contrast fixation patterns across preview and pre-utterance temporal regions. Error bars show ± 1 SE.

The mean proportions of under-informative utterances by fixation pattern were calculated and are shown in Figure 6. For example, for the four-year-olds, 82% of all trials involving a contrast fixation in both the preview and the pre-utterance region were under-informative. Data from the adults is shown for comparison, though only the child groups are included in the reported statistical analyses (full adult analysis reported in Davies & Kreysa, Reference Davies and Kreysa2017).
To analyse the role of contrast fixations in the informativeness of the subsequent utterance, we used generalised linear mixed effects models assuming a binomial distribution. Statistical analyses were performed using R (R Core Team, 2015), in particular the lme4 package (Bates, Maechler, Bolker, & Walker, Reference Bates, Maechler, Bolker and Walker2015). Unless otherwise mentioned, mixed effects analyses were conducted on the basis of initial maximal models, including random intercepts for both participants and items, and random slopes with all fixed factors. Models were fitted by maximum likelihood, with log-likelihood ratio tests ascertaining whether the interactions in the fixed-effects structure improved model fit for the maximal compared to simpler models. Where this was not the case, interactions were removed from both the fixed and the random parts of the models.
Each age group was analysed separately. The models predicted the occurrence of an under-informative utterance based on the temporal region(s, if any) in which the contrast object was fixated. In all cases, the four contrast fixation patterns (neither, preview, pre-utterance, both) were dummy-coded with ‘both’ as the reference level. The models thus included contrast fixation pattern as a fixed effect and participants and items as random effects, i.e., informativeness ~ contrast fixation + (1 | ppt) + (1 | item). Convergence was achieved using the bobyqa optimiser.
Overall, as depicted in Figure 6, four-year-olds were equally likely to be under-informative regardless of fixation pattern. That is, they produced similarly high rates of under-informativeness when they fixated the contrast object in both the preview and the pre-utterance regions as when they fixated it in neither region (estimate = 1.51, SE = 1.58, p = .34); in the preview region only (estimate = –0.86, SE = 1.20, p = .48), or in the pre-utterance region only (estimate = 2.70, SE = 2.62, p = .30). Thus, the younger children's referring expressions tended to be under-informative regardless of their pre-articulatory scanning behaviour. Conversely, seven-year-olds were significantly less likely to be under-informative when they fixated the contrast object in both the preview and the pre-utterance regions as when they fixated it in neither region (estimate = 1.61, SE = 0.77, p = .04); in the preview region only (estimate = 1.18, SE = 0.58, p = .04), and in the pre-utterance region only (estimate = 1.37, SE = 0.66, p = .04). In other words, the older children were most likely to produce an under-informative expression if they did not previously fixate the contrast object in either temporal region, and least likely to produce an under-informative expression if they fixated it in both; just like the adult comparison group.
In summary, this binary analysis of contrast fixations in preview and pre-utterance temporal regions reveals stark differences between younger and older children. Four-year-olds are highly likely to be under-informative regardless of the comprehensiveness of their visual scan, whereas seven-year-olds showed more effective use of information from the contrast object in their choice of referring expression. If the older children never fixated the contrast object, they were most likely to be under-informative, and looking at it in both preview and pre-utterance regions was most effective at reducing under-informativeness. This pattern is broadly similar to the adults although, unlike the seven-year-olds, fixations in the pre-utterance region alone did help adults to reduce under-informativeness.
Contrast fixation duration
Focusing on those trials which contained a contrast fixation, an additional analysis of fixation duration to the contrast object corroborated the binary findings above (i.e., fixation vs. no fixation across two temporal regions). Linear mixed effects models investigated the influence of age and informativeness on fixation duration to the contrast object during the preview and pre-utterance temporal regions combined. Again, data from the adults is shown for comparison, though only the child groups are included in the reported statistical analyses. Since there were 45 trials in which children did not fixate the contrast object at all in these regions, we excluded those trials from this analysis. Three outlying trials with fixation durations of > 3000 ms were also excluded, leaving 83% of the prepared dataset. The model included the two fixed factors (age and informativeness), their interaction, and random intercepts for participants and items: fixation duration to contrast ~ age * informativeness + (1+ | ppt) + (1 | item).
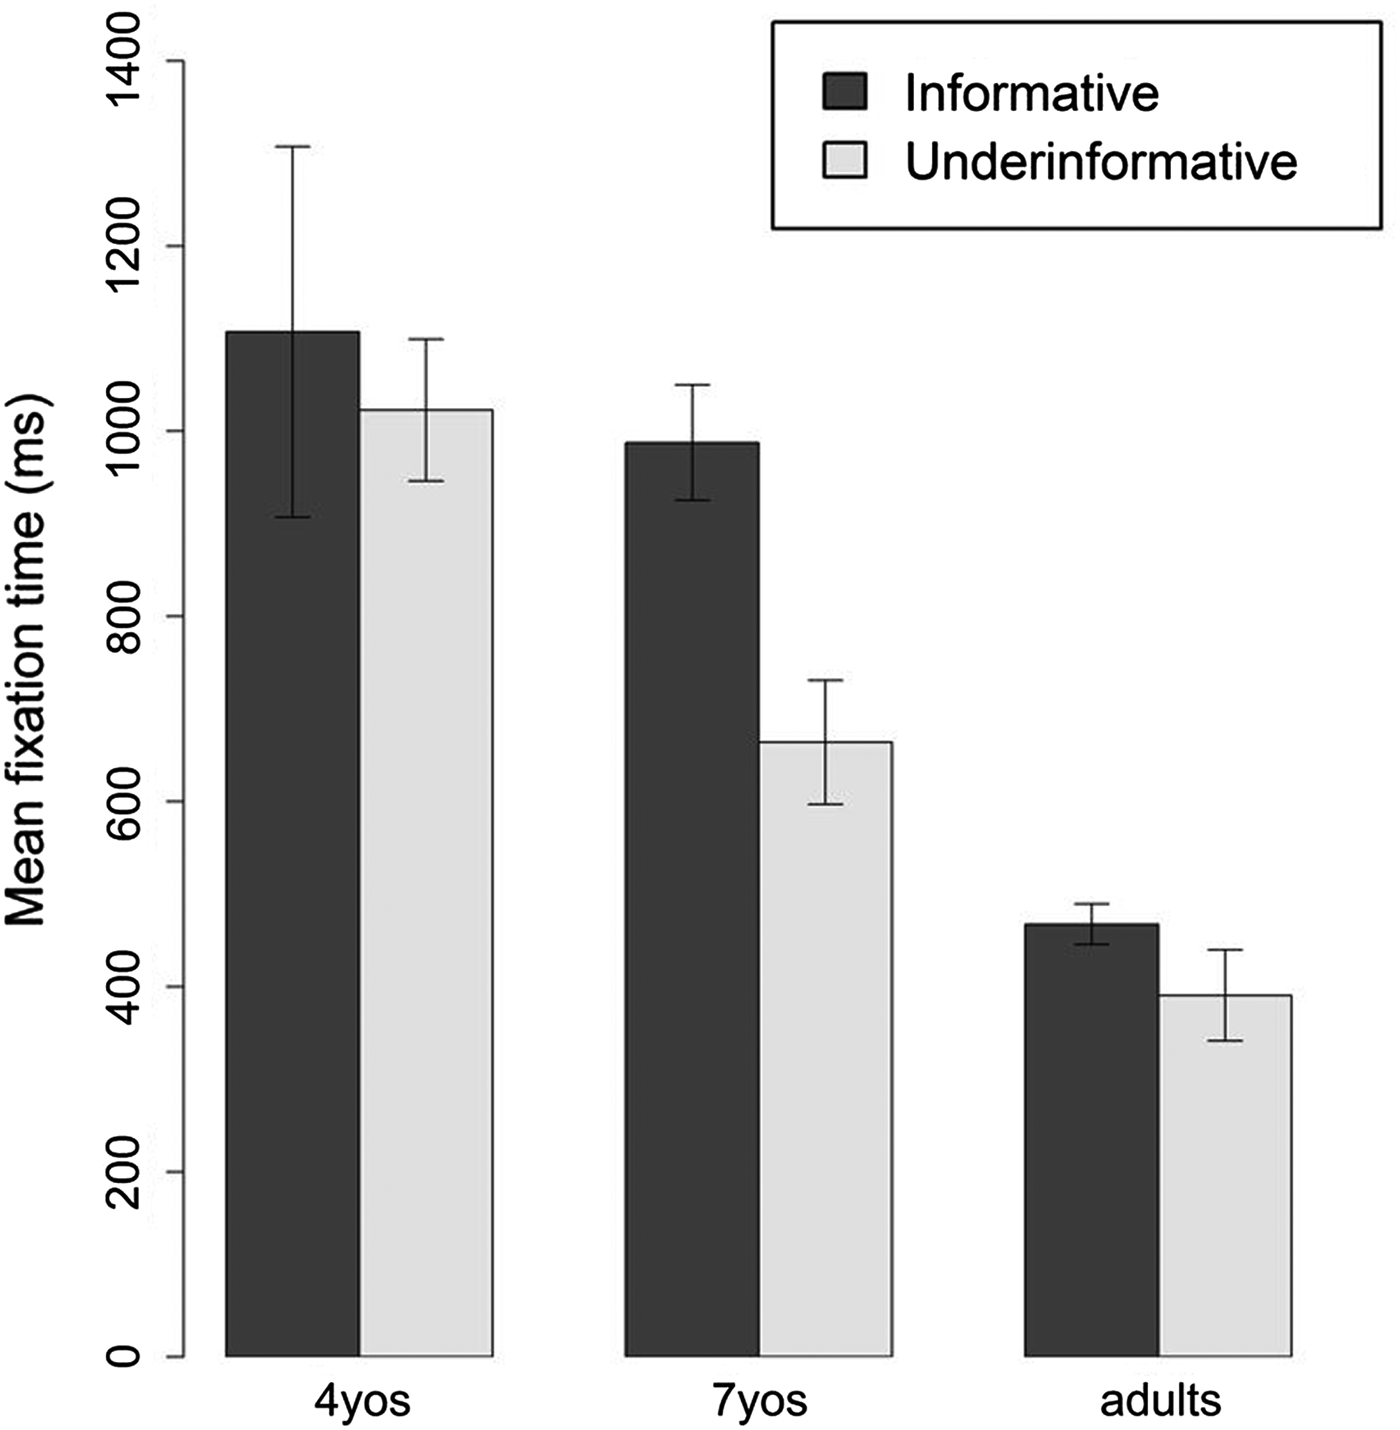
During the combined preview and pre-utterance regions, the four-year-olds (M = 1037 ms, SD = 712) fixated the contrast for longer than the seven-year-olds (M = 887 ms, SD = 587; age coefficient = –233.7, SE = 96.8, t = –2.41), regardless of informativeness. Both age groups fixated the contrast object for longer before producing an informative utterance (M = 1004 ms, SD = 643) than before producing an under-informative utterance (M = 899 ms, SD = 643; informativeness coefficient = –211.1, SE = 93.8, t = –2.25). Although Figure 7 suggests that this pattern is more marked in the seven-year-olds (informative M = 988 ms, SD = 617; under-informative M = 664 ms, SD = 444) than the four-year-olds (informative M = 1107 ms, SD = 801; under-informative M = 1023 ms, SD = 698: informativeness coefficient = –216.2, SE = 120.7, t = –1.79), the interaction was not significant (t = –0.99). However, it seems clear that longer looks to the contrast object before speaking are associated with informativeness, particularly in the older children.
Mean total fixation duration to the contrast object during the preview and pre-utterance regions, by age group and informativeness. Error bars show ± 1 SE.

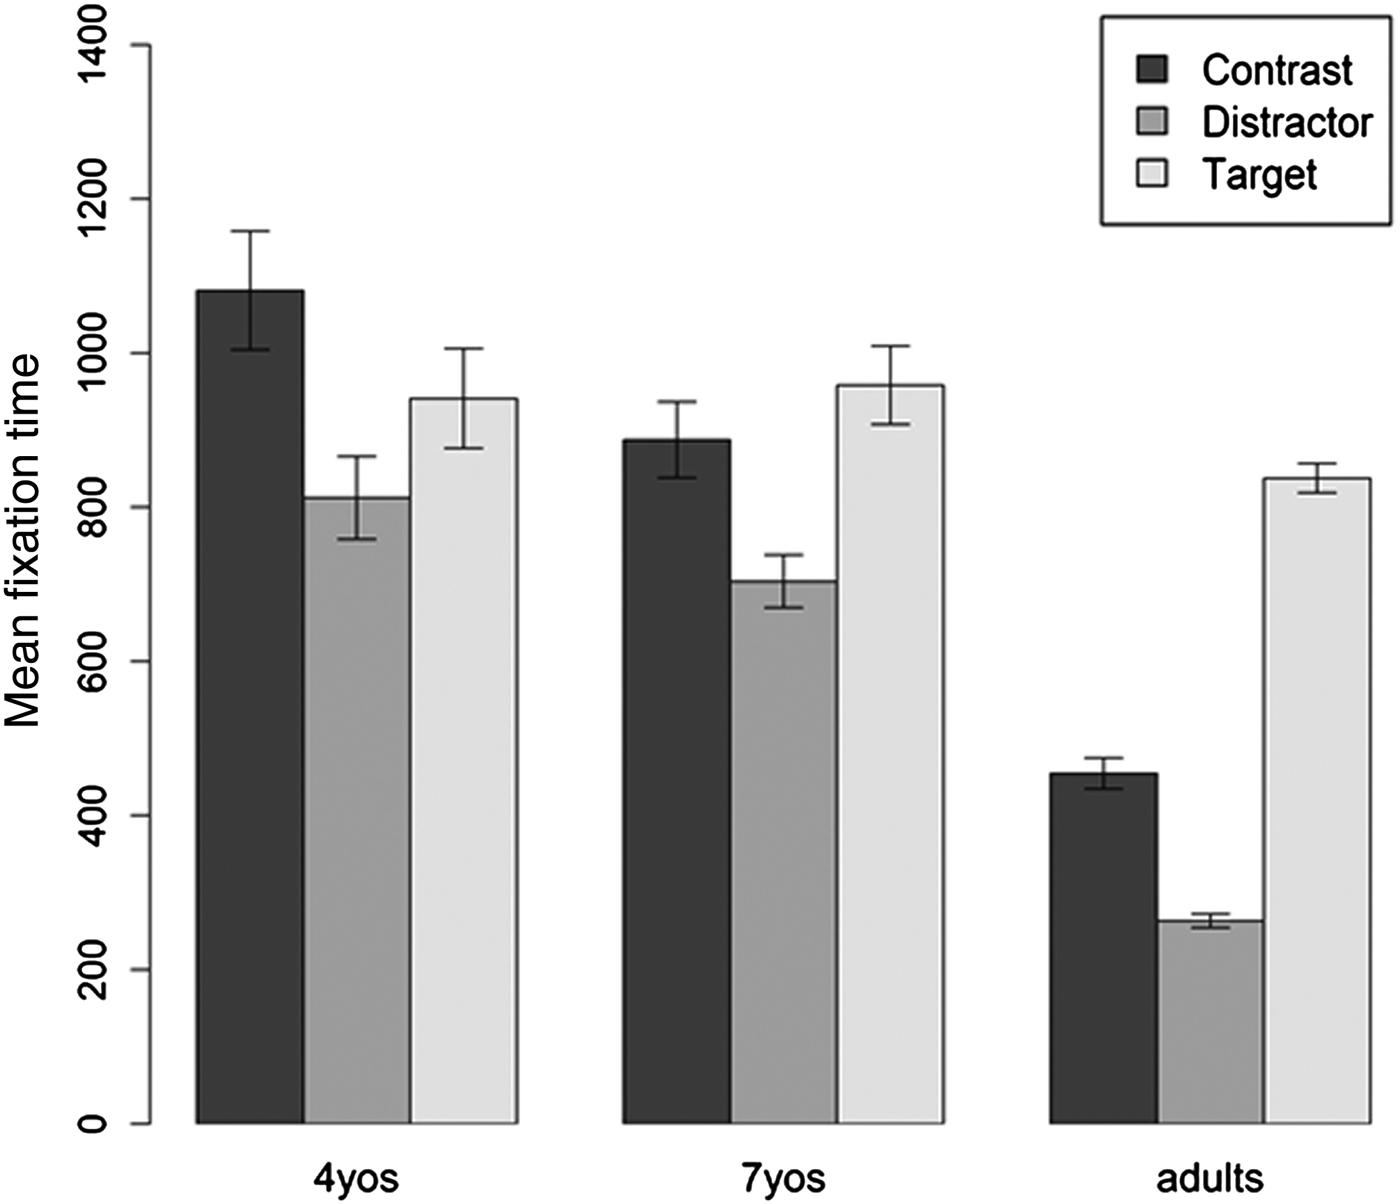
As the contrast fixation analyses suggest, children at four and at seven years of age marginally differed in how long they fixated contrast objects. Distractor fixations were also monitored to provide a measure of how much the children were scanning the display generally. On average, four-year-olds and seven-year-olds showed a similar pattern of fixation durations between areas of interest, with distractor items being fixated least (see Figure 8). Adults also fixated the distractors the least of all areas of interest, though they showed a more marked preference for the target than the two child groups.
Mean total fixation duration to each area of interest during the preview and pre-utterance regions, by age. Error bars show ± 1 SE.

Summary of eye-movement findings
The three main analyses reported above converge to suggest that, despite fixating the contrast object in visual displays, four-year-olds don't encode distinguishing information into their referring expressions, whereas their older peers show a significant boost to informativeness from their pre-articulatory contrast fixations. First, an analysis of informativeness by age group and display complexity shows that, despite looking at the contrast object before speaking, four-year-olds did not go on to provide fully informative expressions. Conversely, the seven-year-olds used the information from their contrast fixations in simple displays in their ensuing informative expressions, like adults. However, as shown by their limited informativeness in complex displays, the older children still have some way to go to match adult integration levels. Second, an analysis of the presence of contrast fixations in the preview and pre-utterance regions shows that, regardless of whether four-year-olds fixated in both temporal regions or in neither of them, the majority of their referring expressions were under-informative. On the other hand, and in line with the adult comparison group, fixating the contrast in both regions significantly reduced seven-year-olds’ rates of under-informativeness, and conversely, neglecting to look at it at all significantly impaired their ability to be fully informative. Finally, longer looks to the contrast object in the preview and pre-utterance regions are associated with informativeness, especially in the older children. Taken together, these findings robustly show that, at four years old, children tend to be under-informative regardless of looking behaviour whereas, three years later, contrast fixations facilitate informative utterances.
Discussion
How does children's visual scanning behaviour influence the informativeness of their referring expressions? As a first step to answering this question, we ascertained that our sample of four-year-olds produced under-informative expressions 83% of the time when referring to objects in a display containing a contrast, whereas their seven-year-old peers did so just 37% of the time. Having to apprehend more complex displays increased rates of under-informativeness in both age groups, though it penalised the older children more heavily, since they had a higher baseline rate to fall from. Both the age and complexity findings support our first hypothesis, and replicate previous production studies, which found a developmental shift from under-informativeness to full informativeness as children mature (Davies & Katsos, Reference Davies and Katsos2010; Matthews et al., Reference Matthews, Lieven and Tomasello2007; Whitehurst & Sonnenschein, Reference Whitehurst, Sonnenschein and Dickson1981, i.a.).
Of the various reasons proposed in the literature for younger children's under-informativeness, we focused on the association between visually scanning the display during utterance planning – specifically looking at the contrast object – and the ensuing informativeness of referring expressions. By examining children's eye-movements as they previewed visual stimuli and planned their expressions, we have shown that, although children looked at the contrast object at least once in the majority of trials, younger children did not encode the critical information in their referring expressions. Thus, we discount the suggestion that it is a lack of contrast fixations that causes referential informativeness in young children (Deutsch & Pechmann, Reference Deutsch and Pechmann1982; Pechmann, Reference Pechmann1989). As our data show, younger children indeed allocate attention to a contrasting object, but nevertheless these contrast fixations do not appear to be associated with their informativeness in any way. Whether they fixate the contrast object in both pre-articulatory regions or not at all, and regardless of the length of their fixations, four-year-old children largely produce under-informative referring expressions. However, this pattern changes by the time children reach seven years of age, when rates of informativeness rise significantly in our task (approaching adult levels for the simple displays), and contrast fixations and referential informativeness become positively associated. Thus, we find that four-year-olds omit critical linguistic information despite having inspected its visual representation; a pattern in line with Bunger et al.'s (Reference Bunger, Trueswell and Papafragou2012) findings on visual scene inspection and the encoding of manner and path information. Our results also accord with Rabagliati and Robertson's findings that young children “fail to take heed of any ambiguity in the world around them” (Reference Rabagliati and Robertson2017, p. 24). Children have a latent ability to notice potential ambiguity, yet neglect to provide disambiguating information for their addressee. The current study extends Rabagliati and Robertson's study by finding a developmental difference in the use of contrast information during proactive monitoring, refining our third hypothesis to reveal a developmental difference not in the incidence of contrast fixations, but in the use of them in producing informative referring expressions.
Thus, in terms of behaviour during the early stages of reference production, the critical skill for full informativeness is the integration of information from an initial visual search. As shown by the second eye-movement analysis, seven-year-old children are able to integrate information from a preview stage (i.e., even before the identity of the target is known) to produce informative referring expressions. Although this suggests they need a longer ‘run-up’ than adults (who find contrast fixations just before the utterance as helpful for informativeness as fixating it in both the preview and pre-utterance regions; Davies & Kreysa, Reference Davies and Kreysa2017), perhaps due to slower speed of processing or needing more time for speech planning, it highlights older children's ability to hold referential information in mind while attending to visual information and planning their eventual referential form. However, this is harder to achieve when displays are complex; in these cases, older children struggle to encode the distinguishing information even when they have fixated the contrast object. We suggest that the additional objects in the display impose extra processing demands, which may cause children to revert to referring to target objects in absolute rather than relative terms. The lack of any modifying adjective in these trials – even incorrect or non-distinguishing ones – suggests that the extra visual complexity may curtail the necessary linguistic complexity in spontaneous referring. Interestingly, Whitehurst and Sonnenschein (Reference Whitehurst, Sonnenschein and Dickson1981) successfully elicited fully informative expressions requiring comparisons of complex arrays from five-year-olds, but only when the children were explicitly instructed to make such comparisons.
So what is it that prevents younger children from integrating visual information into their expressions? One possibility is that these children are more likely to talk about an element of a scene that has captured their attention. Recall that the target was highlighted using a red square; a salient cue that may have overshadowed the rest of the array even when the contrast object had been previously inspected. This explanation is in line with Bunger at al.'s (Reference Bunger, Trueswell and Papafragou2012, p. 147) suggestion that adults are “able to suppress their excitement about particular event components in the interest of providing fully informative event descriptions”. Here we can extend such an explanation to children just three years older than those four-year-olds who could not stop themselves describing the highlighted target on its own merits, rather than relative to contrast objects, as required for felicitous referring. This susceptibility to a ‘see-it-say it’ strategy may be caused by a tendency in younger children to use adjectives descriptively rather than contrastively (though their low rate of over-informative referring casts doubt on this as a sole explanation). More likely, their narrow focus is related to immature executive function skills, e.g., inhibitory control, which we turn to below. A more gradient, though complementary, explanation is that children and adults differ in the amount of visual attention required for eventual integration into informative utterances, as shown by our analysis of fixation duration where both child groups spent almost twice as long as the adults fixating the contrast object before producing an informative utterance. Interestingly, an analysis of speech onset time between the child groups suggests that although four-year-olds were slower (M = 1819 ms, SD = 607) to start producing their utterances than the seven-year olds were (M = 1520 ms, SD = 308; age coefficient = –333.9, SE = 98.9, t = –3.4), this didn't enable them to match their older peers’ informativeness. Follow-up work which increases the salience of the difference between target and contrast, or that allows children more time to attend to it, would shed light on the role of timing in informative reference.
Counter to our second hypothesis, we did not find a contributory role for receptive vocabulary, narrative ability (both used as indices of language ability), or visual search capabilities towards referential informativeness at either age-point. Note, however, that there was limited within-group variance in the informativeness rates, which may have contributed to the null results for the correlation analysis. We would welcome further investigation of the role of linguistic and visual search skills in referential tasks designed to elicit more variable rates of informativeness in older groups, e.g., referential communication tasks that require two modifiers for unique disambiguation. Additionally, the use of computational cognitive models that specify the relationships between linguistic and cognitive processes would also be a productive means of investigating the interplay of these factors, as well as the role of individual differences (for example in ACT-R; Hendriks, Reference Hendriks2016).
Although we didn't measure our participants’ executive functioning skills, an interesting future direction would be to assess whether executive functioning moderates the relationship between contrast fixations and informativeness of the referential phrase. That is, it may be the case that only those children with good executive functioning are able to make use of the information gleaned from the contrast object.Footnote 6 Executive functioning is a set of cognitive skills which has been frequently linked to performance in referential tasks, e.g., the ability to mentally maintain or manipulate information (i.e., working memory), to withhold a dominant response (inhibitory control), or to shift representations (i.e., cognitive flexibility) (see De Cat, Reference De Cat, Serratrice and Allen2015, for a review). Studies by, e.g., Bacso and Nilsen (Reference Bacso and Nilsen2017), Nilsen and Graham (Reference Nilsen and Graham2009), and Nilsen, Varghese, Xu, and Fecica (Reference Nilsen, Varghese, Xu and Fecica2015) suggest that greater working memory enables children to more effectively hold features of a target object in mind and compare them with contrasting objects (see also Hendriks, Reference Hendriks2016, for supporting evidence from cognitive modelling). Similarly, previous research has implied that stronger cognitive flexibility enables children to notice multiple dimensions of an object (e.g., that a sock is both long and stripy) and to produce an expression that captures the critical dimension(s) (Bacso & Nilsen, Reference Bacso and Nilsen2017). Inhibitory control has also been found to relate to referential informativeness (Wardlow, Reference Wardlow2013), and although the current study does not have data to corroborate this, it is feasible that the see-it-say-it strategy mentioned above might be minimised with better inhibitory control as children get older. An age-related boost in executive function skills might help children scan the critical objects, hold them in mind, suppress prepotent responses, and then consistently encode relevant information to produce felicitous expressions.
Like many referential interactions, our task required use of a communicative partner's perspective. The interactive experimental set-up was designed to encourage participants to describe the target object for the addressee rather than merely describing the scene generally, e.g., the imperative sentence frame that the child was instructed to use (“click on the X”), the presence of a live addressee, instructions emphasising that the child's job was to help the addressee, information about what the addressee could and couldn't see, and the addressee's clear motivation to find the correct object in response to the child's instructions. Despite these aspects of the design, the children may not have realised that the identity of the target object was unknown to the addressee before they produced their referring expression. Indeed, the high frequency of under-informativeness by the younger children in our sample accords with other work finding that children overuse forms that imply accessibility of the referent to their addressee (De Cat, Reference De Cat, Serratrice and Allen2015, p. 278). However, children may make these apparent mis-estimates of accessibility, or fail to take their addressee's perspective into account, not for reasons of erroneous higher-level situation modelling, but due to problems in integrating discourse information at a more basic level. That is, they may realise that their partner needs a modified description, but are simply unable to maintain activation of contrast information while planning their utterances. Consequently, they fail to meet the pragmatic expectation and end up describing the target in absolute terms. This may be exacerbated in situations where communicative demands are higher, e.g., novel scenarios with less supportive contexts and more aspects to integrate (Allen et al., Reference Allen, Hughes, Skarabela, Serratrice and Allen2015, p. 134). Experimental situations involve many of these demands; testing between these artificial vs. more naturalistic contexts may reveal further executive function-related explanations for children's referential inadequacy.
One potential limitation of our study is that participants received no feedback other than a mouse-click, regardless of the referential form they produced, to signal that a referent had been found and that they could move on to the next item. This liberal acceptance of any utterance they produced might have particularly encouraged the resource-poorer younger speakers to use unmodified expressions over the course of the experiment, because the addressee seemed to be satisfied with the given descriptions. However, there was no difference in rates of unmodified expressions between items in the first and in the second half of the experiment for either the four-year olds (t(26) = 0.47, p = .65) or the seven-year-olds (t(29) = –0.36, p = .72), suggesting that lack of feedback was not a contributing factor in rates of under-informativeness. Nevertheless, if we reframe informative reference as the avoidance of misunderstanding (Hendriks, Reference Hendriks2017) instead of the avoidance of ambiguity, children's under-informative behaviour in this task starts to appear more rational than it initially appears. Further, since participants were always in the speaker role, they did not receive effective models, or experience what it is like to receive inadequate expressions. This is not just a methodological point. It has been shown that children learn to avoid ambiguity from precise (caregiver) feedback (Abbot-Smith et al., Reference Abbot-Smith, Nurmsoo, Croll, Ferguson and Forrester2016; Bacso & Nilsen, Reference Bacso and Nilsen2017; Matthews et al., Reference Matthews, Lieven and Tomasello2007, Reference Matthews, Butcher, Lieven and Tomasello2012; Wardlow & Heyman, Reference Wardlow and Heyman2016), so even within the course of a single experiment that includes feedback and/or modelling, increased rates of informativeness can emerge, mediated by executive function skills. Such a paradigm could produce a rather different picture with regard to the link between contrast fixations and informativeness. However, despite the lack of incentive to be maximally informative and the lack of effective modelling, the older children's drive to be informative did not appear to be compromised in our study (cf. Varghese & Nilsen, Reference Varghese and Nilsen2013). Participants were instructed that their role was to help a real, physically co-present addressee to find the objects, which may have compensated for the lack of feedback, at least for the older children.
There is a trend in the results which calls into question the assumption that the contrast object must be fixated for an informative expression to occur. As reported in our second eye-movement analysis, 96% of the younger children's and 63% of the older children's trials without a contrast fixation were under-informative. This means that 4% of the younger and 37% of the older children's trials were in fact informative despite not having fixated the contrast object in either the preview or pre-utterance temporal region. This suggests that, at least for the older children, it is possible to produce an informative referring expression without having directly checked the contrast before articulation. This pattern is even more pronounced for the adult comparison group at 62% informativeness without a prior contrast fixation (discussed in depth in Davies & Kreysa, Reference Davies and Kreysa2017). This ability may be due to either (i) extrafoveal processing of the contrast object or (ii) late fixations to it during articulation. Whilst beyond the scope of the current paper, this line of reasoning points to a further age-related difference in the use of contrast information, i.e., that contrast fixations are helpful but not essential for full informativeness as speakers mature.
It has been repeatedly shown that young children are frequently under-informative in their referential behaviour. At the same time, there is ample evidence that composite skills for informative reference are in place from an early age. For example, 22-month-olds react to newness and communicate more about what is new (O'Neill & Happé, Reference O'Neill and Happé2000); two-year-olds adapt their communicative behaviour depending on their assessment of the knowledge of others (O'Neill, Reference O'Neill1996) and can be trained to produce fully informative expressions (Matthews et al., Reference Matthews, Lieven and Tomasello2007); and five-year-olds can track what is accessible to their interlocutor (Nadig & Sedivy, Reference Nadig and Sedivy2002). The current study has extended this list of prerequisite skills by showing that, by four years of age, children are able to engage in comprehensive visual scanning. However, it may take another three years for them to manage these skills in unison and alongside fully-fledged linguistic output.
Acknowledgements
We thank the children, families, and staff of Oakwood Acorns and Holly House nurseries, Ducklings childcare, Kerr Mackie Primary School, and Children's Corner's Chillout Club (all of Leeds) for their participation. We gratefully acknowledge assistance from Clara Andrés-Roqueta for creating the stimuli (originally used in Davies, Andrés-Roqueta, & Norbury, Reference Davies, Andrés-Roqueta and Norbury2016), Tara Evans for data collection, transcription, and preparation, Jessica Dealey for data transcription and preparation, and Chris Norton for preparing the eye-tracking data. Many thanks to Pirita Pyykkönen-Klauck and Gerry Altmann for guidance during the early stages of this study, Cécile De Cat for discussion and comments on earlier drafts, and to two anonymous reviewers for their helpful comments. The study was funded by a British Academy Quantitative Skills grant awarded to the first author (grant reference SQ120012).
Appendix: images used in the object recognition task