INTRODUCTION
Human campylobacteriosis represents an important public health issue and it has been notifiable in Denmark since 1980. Raw chicken meat is considered one of the most important risk factors for human infections with Campylobacter in Denmark (Wingstrand et al. Reference Wingstrand, Neimann, Engberg, Nielsen, Gerner-Smidt, Wegener and Mølbak2006). A risk profile for pathogenic Campylobacter was conducted in 1998 (Forsythe Reference Forsythe and Forsythe2002) and ever since broiler flocks have been tested for Campylobacter at slaughter. The first Danish Action plan against Campylobacter in broilers was established in 2003 (Christensen et al. Reference Christensen, Sommer, Rosenquist and Nielsen2001). A more recent action plan to control Campylobacter in broilers and broiler meat was implemented in Denmark in 2008. Between 2001 and 2009, Campylobacter prevalence in Danish broiler flocks before slaughter decreased from around 0.4 to about 0.3 (Boysen Reference Boysen2012). A recent report from the European Food Safety Authority stated an average prevalence of 0·192 for Campylobacter in Danish broiler flocks (EFSA Panel on Biological Hazards 2011). Nevertheless, Campylobacter prevalence in broiler flocks during the summer months in Denmark can be as high as 0·514 (Hald et al. Reference Hald, Sommer and Skovgard2007). Researchers have reported several risk factors significantly associated with Campylobacter infection of broilers in Denmark such as late introduction of whole wheat in the chickens' diet, improper storage of whole wheat, age of birds at slaughter, old broiler houses, number of chimneys on the broiler house, improper rodent control, number of broiler houses on farm and the location of the poultry farm in relation to cattle farms (Heuer et al. Reference Heuer, Sommer, Wong, Patrick, Wainø, Wedderkopp and Madsen2007; Sommer & Heuer Reference Sommer and Heuer2007; Sommer et al. Reference Sommer, Heuer, Sørensen and Madsen2013). Chowdhury et al. (Reference Chowdhury, Sandberg, Themudo and Ersbøll2012) found that season, increasing age of the birds and several factors related to biosecurity (age of the poultry houses, previous Campylobacter positive flocks in the same houses and the number of persons entering the houses) were significantly associated with Campylobacter infection of broilers. Field trials conducted in Denmark showed that the use of fly screens in broiler houses during the summer can reduce the prevalence of Campylobacter in Danish broilers (Hald et al. Reference Hald, Sommer and Skovgard2007; Boysen et al. Reference Boysen, Vigre and Rosenquist2011). A recommendation to use fly-nets in all the houses on a farm has been made because transmission of Campylobacter from the non-netted houses to the netted houses has been considered probable (Hald et al. Reference Hald, Skovgard, Bang, Pedersen, Dybdahl, Jespersen and Madsen2004; EFSA Panel on Biological Hazards 2011). In fact, the use of fly screens on farms may decrease Campylobacter prevalence in broilers by 10–30% (Hald et al. Reference Hald, Sommer and Skovgard2007), which in turn may translate to a significant reduction of human campylobacteriosis cases.
Campylobacter control measures that can reduce the numbers in already infected chickens, such as vaccination strategies, might also be considered. Effective vaccination is highly desirable; however, a cost-efficient vaccination strategy against Campylobacter in poultry is not yet commercially available. Garcia et al. (Reference Garcia, Bahrndorff, Hald, Hoorfar, Madsen and Vigre2012) conducted investigations into a vaccination strategy against Campylobacter in poultry aiming to reduce the numbers of Campylobacter in chickens. In addition, decision support tools have been developed to assist poultry producers to make complex decisions under conditions of uncertainty for the control of Campylobacter in poultry flocks (Madsen et al. Reference Madsen, Karlsen, Barker, Garcia, Hoorfar and Jensen2012; Garcia et al. Reference Garcia, Madsen and Vigre2013).
The main objective of the present work was to develop a decision support system to assist poultry farmers in the control of Campylobacter (at farm level) using data from Denmark. The model presented is constructed as a probabilistic graphical model (PGM) which integrates prior knowledge related to the farm as well as the expected cost-effectiveness of two different Campylobacter controls on-farm: hypothetical Campylobacter vaccines and/or the use of fly screens. The integration of prior knowledge (prior probabilities) can be used to infer the probabilities of other variables that are not known (posterior probabilities) using a Bayesian approach. The prior probability distributions should integrate knowledge obtained from diverse reliable sources such as epidemiological data, empirical observations and expert knowledge in order to obtain reliable outcomes from the models. Epidemiological data, microbiological considerations, financial information and diverse control strategies have been integrated in the model. The present work aimed to provide the decision support system and solutions derived from the model such as posterior probabilities related to expected Campylobacter levels in chickens before and after implementation of controls and a cost–benefit balance for each control strategy considered. Poultry producers can adapt the model to real-life conditions and decide if/when to use fly screens and/or vaccines (if they were commercially available) selecting the most beneficial decision/s in every real-life situation.
MATERIALS AND METHODS
Probabilistic graphical models
The PGM presented in the present paper has been designed using the HUGIN tool, a commercial software package from Hugin Expert (http://www.hugin.com/). Briefly, PGMs include prior knowledge and uncertainties using a number of variables and probabilistic dependence relationships between the variables (Madsen et al. Reference Madsen, Karlsen, Barker, Garcia, Hoorfar and Jensen2012; Garcia et al. Reference Garcia, Madsen and Vigre2013). The PGMs formed by a set of variables have two components: a qualitative and a quantitative part. The qualitative part includes diverse ‘nodes’ such as variables, decision nodes and utility functions and arcs representing relationships between them (as exemplified in Fig. 1). A chance node (an oval in Fig. 1) represents a random variable, while a decision node (a rectangle in Fig. 1) defines decision alternatives at a specific point in time and a utility node (a diamond in Fig. 1) represents a reward or cost function. The relationships of dependence or independence between the variables included in the models can be represented and the strength of the relationships can be defined using conditional probability distributions (Heckerman et al. Reference Heckerman, Mamdani and Wellman1995). The quantitative part of the models includes the mathematical expressions and probability distributions. The results from the models comprise posterior probability distributions (for every strategy) related to expected Campylobacter numbers in the flock (in logs) before and after the implementation of the decision(s) and the expected cost–benefit balance associated with each decision.
The Commercial Broilers in Denmark (ComBDK) model designed based on epidemiological and financial data from Denmark.

Prior knowledge related to poultry production management factors
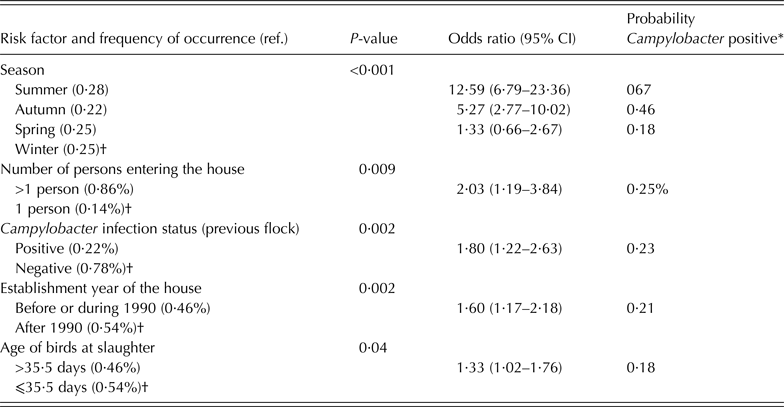
The developed decision support model (Fig. 1) integrates epidemiological data from a study on risk factors potentially associated with Campylobacter infection in Danish broiler flocks (Chowdhury et al. Reference Chowdhury, Sandberg, Themudo and Ersbøll2012). These authors investigated >1700 variables and found the following risk factors to be significantly associated with Campylobacter positive flocks: season, increasing age of the birds, the age of the poultry houses, previous Campylobacter positive flocks in the same houses and the number of persons entering the poultry houses (Chowdhury et al. Reference Chowdhury, Sandberg, Themudo and Ersbøll2012). Odds ratio (OR) values were used to represent the concept of ‘increased risk’ due to the factor(s) considered in their research. To integrate this information into the PGM, the significant risk factors were included in the model (Fig. 1) and the OR values were transformed to a probability of infection with Campylobacter at varying states of the risk factor (P(s)) using the following formula:
Significant risk factors, frequency of occurrence and associated probability of Campylobacter introduction in broiler flocks in Denmark (Chowdhury et al. Reference Chowdhury, Sandberg, Themudo and Ersbøll2012)
* Based on a basic level of Campylobacter of 14% (Chowdhury et al. Reference Chowdhury, Sandberg, Themudo and Ersbøll2012).
† Reference category.
 $$P{\rm (}s{\rm )} = \displaystyle{{\exp (\ln ({b_{\rm p}}/1 - {b_{\rm p}}) + \ln ({\rm ORs}))} \over {1 + \exp (\ln ({b_{\rm p}}{\rm /}1 - {b_{\rm p}}) + \ln ({\rm ORs}))}}$$
where b p is the baseline Campylobacter flock prevalence and ORs is the odds ratios (Table 1). In addition, Campylobacter introduction in the flock due to the presence of risk factors was assumed to be conditional to a baseline Campylobacter flock prevalence (b p: lowest level of Campylobacter in broilers close to slaughter time found in the literature) of 0·14 (Chowdhury et al. Reference Chowdhury, Sandberg, Themudo and Ersbøll2012).
The ‘Commercial Broilers in Denmark’ (ComBDK) model: design and assumptions
The ComBDK model (Fig. 1) was developed to assist poultry producers in Denmark to make decisions regarding Campylobacter controls in commercial broilers based on the following assumptions:
(i) A microbiological detection level of Campylobacter was considered to be 2 logs colony forming units (CFU)/g or ml of sample while the maximum colonization level was assumed to be 10 logs CFU/g or ml of sample. Thus, in this model, a Campylobacter level of 0–2 logs will produce a negative result while a positive result suggests Campylobacter numbers present in the samples from 2 to 10 logs. Intervals for bacterial concentration with two log widths (e.g. 0–2 logs, 2–4 logs, 4–6 logs, 6–8 logs and 8–10 logs) were considered.
(ii) The contributions from different risk factors to the level of Campylobacter are independent.
(iii) The ‘measured Campylobacter numbers at slaughter’ will depend on the microbiological quantitative methods used and the ‘true numbers’ of Campylobacter in chickens. In the model, a hypothetical nearly perfect quantitative method has been considered.
(iv) The Campylobacter controls included in the model are: the use of fly screens and hypothetical Campylobacter vaccines A and B. Fly screens are used during the summer but the costs associated with the use of fly screens are always considered (Lawson et al. Reference Lawson, Jensen and Lund2009).
In this model, data related to the influence of the risk factors on the expected Campylobacter status of the flock were based on a positive (2–10 logs)/negative (0–2 logs) result while data related to the effect of interventions were based on a log-scale because the objective was to develop a control strategy (e.g. vaccination strategy) able to reduce the numbers of Campylobacter in commercial broilers. Data must be on the same scale to obtain reliable results from the model. For this reason, a mathematical transformation from positive/negative to the diverse Campylobacter levels (in logs)-scale was performed. Figure 2 illustrates the mathematical transformation used to translate results from a positive/negative format (‘Campylobacter slaughter time without vaccine’) to a log scale format (‘Campylobacter slaughter time logs without vaccine’). A flat distribution was selected to transform a general expected posterior probability of a Campylobacter flock (e.g. 0·72) into a distribution of equal probabilities (0·18) for the different levels of Campylobacter considered in the model (Fig. 2).
Illustration showing the part of the model where a mathematical transformation is performed to translate results from a positive/negative format (‘Campylobacter slaughter time w/o vaccine’) to a log scale format (‘Campylobacter slaughter time logs w/o vaccine’).
The effectiveness of Campylobacter controls and cost–benefit functions included in the model
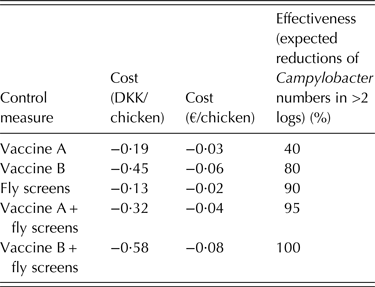
The use of a cost-effective vaccine against Campylobacter in chickens is desirable; however, no commercial vaccine is presently available. Based on prices of other vaccines used to control diseases in poultry (Dianova 2013), a hypothetical price can be considered to be around 0·15–0·50 Danish Kroners (DKK), equivalent to €0·02–0·07. Two hypothetical vaccines (A and B) were incorporated in the model with different vaccine effectiveness and costs (Table 2). The use of fly screens in poultry houses in order to control Campylobacter has been recommended (Hald et al. Reference Hald, Skovgard, Bang, Pedersen, Dybdahl, Jespersen and Madsen2004, Reference Hald, Sommer and Skovgard2007; Bahrndorff et al. Reference Bahrndorff, Rangstrup-Christensen, Nordentoft and Hald2013). The average cost (including capital costs that cover long-term investments and variable expenses) of implementing fly screens on broiler farms was calculated to be 0·13 DKK/chicken (Lawson et al. Reference Lawson, Jensen and Lund2009), equivalent to approximately €0·02, and included in the model (Table 2). The impact of interventions and the cost–benefit functions were based on a log-scale because the objective was to develop a control strategy that could reduce the numbers of Campylobacter in already infected chickens. The use of fly screens can reduce the prevalence of Campylobacter in broiler flocks significantly; therefore, it was assumed in the model that the effectiveness of fly screens was 0·90 (expected reduction of Campylobacter numbers in more than 2 logs).
Costs and effectiveness related to control measures included in the model
DKK, Danish Kroners.
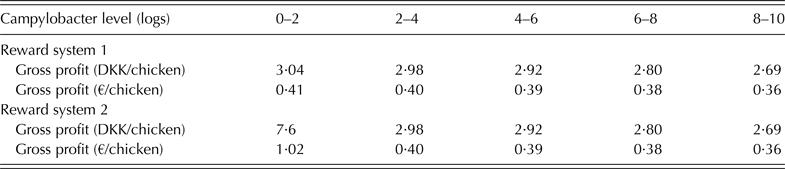
Two reward systems (Table 3) were designed based on an ‘average’ gross profit (for Danish farmers producing chickens carrying an ‘average’ number of Campylobacter) considered to be DKK 2·92/chicken (equivalent to €0·39/chicken) based on financial data from 2013 (Farmtal Online 2013). It was assumed that an average broiler chicken from a positive flock in Denmark will carry Campylobacter in a concentration of 4–6 logs CFU/g or ml of sample (from the digestive tract). The reward system 1 was designed based on a system implemented in Denmark where poultry producers get an extra payment when the flock is identified as Campylobacter negative before slaughter (Marianne Sandberg, personal communication, 2013). In the model, an extra payment (between DKK 0·02 and 0·04) is given to farmers producing chickens carrying Campylobacter in numbers <4 logs and a reduced payment (between 0·04 and 0·08 less) is established for farmers producing poultry flocks that carry Campylobacter in numbers >6 logs before slaughter (Table 3). A different reward system 2 was designed based on an extra payment of 2·5 times the normal price for chickens testing negative for Campylobacter before slaughter in order to test the sensitivity of the reward variable in the model.
Reward systems 1 and 2
DKK, Danish Kroners.
Sensitivity analyses
Three different types of sensitivity analyses were performed on the model. Firstly, parameter sensitivity analyses were conducted (using the Hugin Expert software) in order to determine which parameters in the model had the strongest influence on final outcomes (Nielsen & Jensen Reference Nielsen and Jensen2003), for example, the effect of vaccination impact (in logs reduction) on measured Campylobacter at slaughter (Fig. 3). Furthermore, the impact of changes in parameters related to the reward system was investigated such as the effect of changes in ‘p’ (increased/decreased payment based on numbers of Campylobacter in commercial chickens) on the cost–benefit balance (or expected utility) of different control measures (Fig. 4). Secondly, an evidence- (or scenario-) driven sensitivity analysis was performed in order to determine the sensitivity of the decisions considered in the model under diverse evidence scenarios (Jensen Reference Jensen1996). For this purpose, different scenarios (e.g. best/worst case scenarios) and the two different reward systems previously described were used. Thirdly, a sensitivity analysis using a number of control measures including a third hypothetical vaccine C (with an effectiveness level of 0·90 and a cost of DKK 0·26/ chicken equivalent to €0·04 was conducted.
Results from sensitivity analyses performed to investigate the effect of vaccination impact (in logs reduction when using Vaccine A) on measured Campylobacter at slaughter.
Results from sensitivity analyses in terms of changes of the expected utility (cost–benefit balance) when selecting some decisions (no controls and using vaccines A or B) as a function of ‘p’ (decreased/increased payment considered in reward system 1).
RESULTS
Interpretation of results obtained from the Commercial Broilers in Denmark model
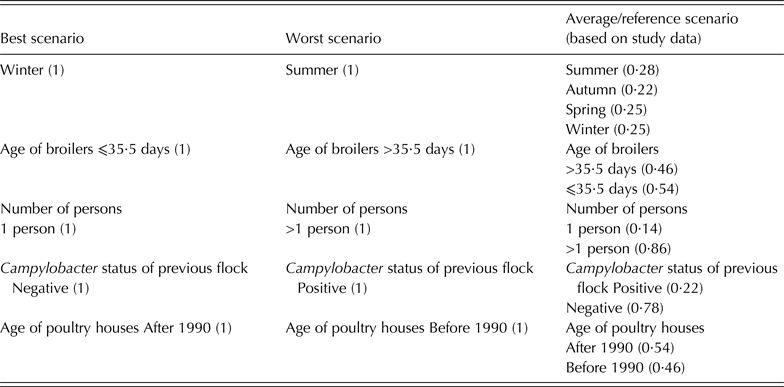
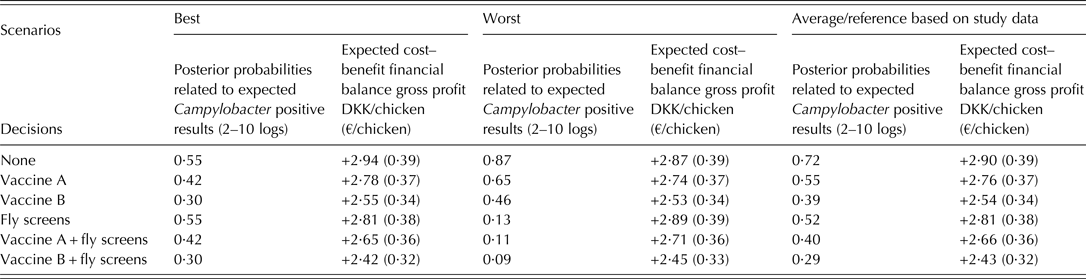
A high number of the diverse risk factors’ states and combinations or scenarios can be considered in the model and therefore it is up to the user to select the most adequate combination for the real-life problem under investigation. Three combinations are described in Table 4 in order to illustrate the potential outputs of the model in terms of expected posterior probabilities related to Campylobacter numbers in chickens and associated expected cost–benefit analyses (or expected utilities) when implementing reward system 1 (Table 5).
Risk factors and frequency of occurrence in every scenario
Results from ‘Commercial Broilers in Denmark’ model using reward system 1
DKK, Danish Kroners.
Results obtained from the model based on the previously described assumptions suggested that the best solution in financial terms would be to use the fly screens alone in the worst case scenario and not to implement the controls under the assumed conditions in the ‘average’ and best case scenarios. Nevertheless, the best solution from a public health point of view would be the use of fly screens and vaccine B synergistically. Based on the results from the model, this strategy (fly screens and vaccine B) could significantly decrease the posterior probability related to expected Campylobacter positive results in all scenarios (from 072 to 0·29 in the average scenario; from 0·55 to 0·30 in the best scenario and from 0·87 to 0·09 in the worst case-scenario) although the implementation of this strategy would translate into a decrease of expected gross profit (around DKK 0·50/chicken equivalent to €0·07). During the summer, the use of fly screens alone and/or synergistically with vaccines A or B may be able to reduce the posterior probability related to expected Campylobacter positive results below the considered ‘baseline level of 0·14’. In fact, using fly screens alone during the summer would reduce the posterior probability related to the expected Campylobacter positive results from 0·87 to 0·13, resulting also in a small increase of the expected gross profit (based on the cost–benefit balance).
Results from sensitivity analyses
The parameter sensitivity analyses performed showed that the financial variables (cost–benefit functions) and to a lesser extent the effectiveness of the control measures (e.g. vaccination impact) were driving the model's results (Figs 3 and 4). Figure 3 shows how the posterior probability of ‘Measured Campylobacter’ in the range ‘0·01–2’ changes as a function of the probability of vaccine A producing a 6–8 logs reduction. The relationship is a linear function in the parameter (i.e. the impact of vaccine A producing a 6–8 logs reduction) with a constant of 0·88 and a coefficient of 0·05. It is possible to observe that the posterior probability of ‘Measured Campylobacter’ equal to ‘0·01–2’ does not change much. However, this change was more pronounced when using hypothetical vaccines B and C because they were considered to be more effective than vaccine A in reducing Campylobacter numbers in infected chickens.
Figure 4 shows how the expected utility (cost–benefit balance) of some decisions (no controls and using vaccines A, B) changes as a function of ‘p’ (decreased/increased payment considered in reward system 1): for low values of ‘p’, no vaccine produces the highest expected utility. Figure 4 shows that vaccine A produces the highest expected utility (cost–benefit balance) only when ‘p’ (increase in payment in reward system 1) is in the order of 0·09 and the value of ‘p’ has to be even higher for vaccine B to result in the highest expected utility (cost–benefit balance).
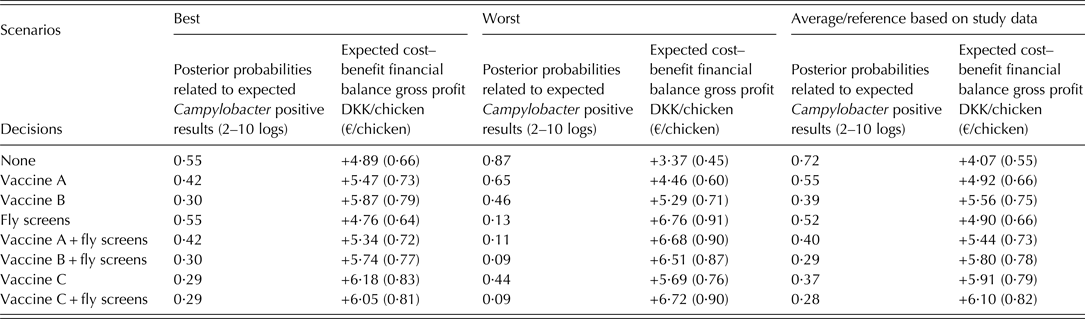
Results from the model when using reward system 2 (based on an extra payment of 2·5 times the normal price for chickens testing Campylobacter negative before slaughter) and the diverse control options (including vaccine C) are presented in Table 6.
Results from the model when considering reward system 2 and an additional vaccine C
DKK, Danish Kroners.
The results presented in Table 5 (reward system 1) and Table 6 (reward system 2) indicate that the posterior probabilities related to expected Campylobacter positive results are the same but the financial results (cost–benefit balances) are very different. As a result of implementing reward system 2, the farmers would potentially obtain higher payments and the differences between implementing diverse controls are more pronounced.
The effectiveness of hypothetical vaccines B and C are very similar but vaccine C is more cost-effective and desirable for this reason. From a public health perspective, the best Campylobacter control strategy would be the use of fly screens together with vaccine B or C. However, from an economic or financial point of view, the best solution would depend on the scenario considered, for example, in the average/reference scenario, the best solution would be using fly screens and vaccine C while in the worst case scenario (during the summer) the use of fly screens alone would be financially most rewarding. The use of vaccine C alone in the best case scenario would seem to be the most cost-effective strategy based on the results from the model.
DISCUSSION
Poultry producers need to make decisions and sometimes expensive investments to control Campylobacter before they even know for sure if the flock will become infected or challenged with Campylobacter. For this reason, poultry producers might benefit from the use of decision support systems such as the one presented in the present paper. Furthermore, the integration of increasing amounts of knowledge from diverse sources makes the decision process complex but if done properly, the accuracy of the results will increase and there will be less uncertainty surrounding the decision-making process. Bayesian inference is used when decisions have to be made under conditions of uncertainty and statistical inference is required (Greenland Reference Greenland2006). Nevertheless, there will always be a degree of uncertainty surrounding Bayesian networks and their outputs. In this regard, uncertainty analyses of Bayesian networks may prove useful to provide information in relation to how uncertainties surrounding the parameter probabilities may affect the output/s; such uncertainty analyses of Bayesian networks are under development (Van der Gaag et al. Reference Van Der Gaag, Kuijper, Van Geffen, Vermeulen, Hindriks, de Weerdt, van Riemsdijk and Warnier2013).
In order to predict the presence and numbers of Campylobacter in poultry flocks, a variety of potential risk factors for the introduction of Campylobacter may be considered in predictive models increasing their complexity (Garcia et al. Reference Garcia, Madsen and Vigre2013). Moreover, the development of a generic global model would be almost utopic because risk factors may vary between geographical regions as well as between production systems (Barrios et al. Reference Barrios, Reiersen, Lowman, Bisaillon, Michel, Fridriksdóttir, Gunnarsson, Stern, Berke, McEwen and Martin2006; Guerin et al. Reference Guerin, Martin, Reiersen, Berke, McEwen, Bisaillon and Lowman2007; Lyngstad et al. Reference Lyngstad, Jonsson, Hofshagen and Heier2008). For this reason, it seems useful to include risk factors found to be statistically significant for the introduction of Campylobacter in poultry flocks under specified conditions. A specific model for the control of Campylobacter in poultry based on data from the UK and considering only one control strategy (the use of hypothetical vaccines against Campylobacter in poultry) has been previously published (Garcia et al. Reference Garcia, Madsen and Vigre2013). The model presented in the present paper has been adapted to Danish poultry production conditions and includes more than one control strategy and their combinations. Thereby, in this way it is possible to compare the effect of very different control options (reducing the probability of introduction of Campylobacter into the flock by using fly screens v. reducing the amount of Campylobacter in the gut of the chickens in the flock if the flock is infected using hypothetical vaccines) in the same model. The risk factors incorporated in the model presented in the present paper (ComBDK model) were those found to be significant for the presence of Campylobacter in Danish broilers in a recent study by Chowdhury et al. (Reference Chowdhury, Sandberg, Themudo and Ersbøll2012). Other studies have also found a clear correlation between biosecurity-related risk factors and flock infection with Campylobacter (Cardinale et al. Reference Cardinale, Tall, Gueye, Cisse and Salvat2004; Johnsen et al. Reference Johnsen, Kruse and Hofshagen2006).
One of the objectives of the present paper was to illustrate the increased complexity of the model when including more than one control strategy. More Campylobacter controls could be incorporated in the model presented in this paper but the complexity will increase accordingly. For example, hygiene barriers have been suggested as the most important biosecurity measures to produce Campylobacter-free chickens (Berndtson et al. Reference Berndtson, Emanuelson, Engvall and Danielsson-Tham1996; Van de Giessen et al. Reference Van De Giessen, Bloemberg, Ritmeester and Tilburg1996; Hald et al. Reference Hald, Wedderkopp and Madsen2000; Johnsen et al. Reference Johnsen, Kruse and Hofshagen2006). In the present model, the use of fly screens was included because their use has been recommended for the control of Campylobacter in Danish broiler systems (Hald et al. Reference Hald, Skovgard, Bang, Pedersen, Dybdahl, Jespersen and Madsen2004, Reference Hald, Sommer and Skovgard2007; EFSA Panel on Biological Hazards 2011; Bahrndorff et al. Reference Bahrndorff, Rangstrup-Christensen, Nordentoft and Hald2013). The effectiveness of the use of fly screens against Campylobacter in poultry has been reported in terms of decreased Campylobacter prevalence in broiler flocks in Denmark. The experimental use of fly screens during the 2006 summer (June–October) produced a statistically significant decrease from 0·514 to 0·154 of Campylobacter positive flocks in comparison with control houses (Hald et al. Reference Hald, Sommer and Skovgard2007). A recently published study (Bahrndorff et al. Reference Bahrndorff, Rangstrup-Christensen, Nordentoft and Hald2013) reports data related to the long-term effect of the use of fly screens on the prevalence of Campylobacter in broiler flocks in Denmark collected over the years 2006–09. Bahrndorff et al. (Reference Bahrndorff, Rangstrup-Christensen, Nordentoft and Hald2013) reported a statistically significant decrease in Campylobacter prevalence from 0·414 in 2003–05 (before the use of fly screens) to 0·103 in 2006–09. The use of fly screens was tested on poultry farms in Iceland during the summer of 2008 and significant reductions on Campylobacter prevalence were observed (Lowman et al. Reference Lowman, Reiersen, Jónsson, Gunnarsson, Bisaillon and Daoadottir2009). Results from the experimental studies previously mentioned relate to average Campylobacter prevalence values obtained from diverse farms and flocks and therefore different farming conditions. Comparison of the results related to the use of fly screens on broiler farms previously reported (Hald et al. Reference Hald, Sommer and Skovgard2007; Lowman et al. Reference Lowman, Reiersen, Jónsson, Gunnarsson, Bisaillon and Daoadottir2009; Bahrndorff et al. Reference Bahrndorff, Rangstrup-Christensen, Nordentoft and Hald2013) with the results from the ComBDK model presented here are not straightforward. Results from the ComBDK model are based on one flock level and the expected posterior probability related to a Campylobacter positive result for that flock under specific conditions. Even more, a ‘nearly perfect’ quantitative microbiological test has been incorporated in the model and consequently results related to the expected probability of a Campylobacter positive result might be higher than the actual result if a quantitative Campylobacter test was performed in that particular flock (considering that the detection limit of most microbiological test are around 2 logs).
The model presented in the present paper has been designed for specific poultry farming conditions in Denmark; however, since the poultry industry is becoming more and more integrated and standardized it is possible that the model could be applied to farming conditions in other areas of the world. Nevertheless, the model (qualitative and/or quantitative parts) should be adjusted to other situations in order to design useful tailor-made models (Garcia et al. Reference Garcia, Madsen and Vigre2013). The flexibility of the model allows the user to test diverse controls, different farming conditions, microbiological protocols and cost–benefit systems. Sensitivity analyses performed indicated that the factors that influenced the results to a greater extent were the financial variables (cost–benefit functions) and the effectiveness of the Campylobacter control strategies. The assessment of the effectiveness of control strategies might prove challenging in some cases e.g. the assessment of vaccine effectiveness (Garcia et al. Reference Garcia, Bahrndorff, Hald, Hoorfar, Madsen and Vigre2012). The effectiveness of fly screens was assumed to be 0·90 but they were only used during the summer. The financial impact of the implementation of disease control strategies needs to be considered in disease control programmes.
In conclusion, the financial results obtained seemed to be highly dependent on the reward systems and the scenarios considered. From a public health perspective, the best Campylobacter control strategy will be the use of fly screens alone or synergistically with hypothetical vaccines B or C. In some occasions, the financial results obtained from the model indicated that the expected financial gains might be too small to justify the implementation of controls. Nevertheless, this type of information might prove very valuable and it is likely that producers will find this decision making tool more beneficial at times when the consequences from implementing alternative decisions for the control of Campylobacter are not so obvious. In contrast, when considering the most cost-efficient choices (e.g. reward system 2 and the use of vaccine C) significant reductions in expected Campylobacter levels and substantial expected financial gains were obtained. Clearly, cost-effective control measures will be preferred by poultry producers and a reward system that can translate on an attractive cost–benefit balance will be a good incentive for producers to implement Campylobacter control strategies in poultry production. The implementation of cost-effective control strategies during primary poultry production will potentially translate into a decrease of Campylobacter prevalence in chickens, a reduction of Campylobacter numbers in poultry products and in turn, a potential decrease of human campylobacteriosis cases. From a public health perspective, a Campylobacter prevalence level of 0·10 in broilers could potentially result in a reduction of human cases by nearly 50% (Nauta et al. Reference Nauta, Hill, Rosenquist, Brynestad, Fetsch, Van Der Logt, Fazil, Christensen, Katsma, Borck and Havelaar2009; EFSA Panel on Biological Hazards 2011).
This work was supported by The Danish Council for Strategic Research project CamVac (contract 09-067131).