
Introduction
Li-ion batteries have high-energy and -power density in comparison with standard batteries since they can be charged and discharged many times.[Reference Scrosati, Hassoun and Sun1, Reference Whittingham2] However, when the number of charge–discharge cycles increases, battery capacity performance decreases over time. It is known that this reduction in performance is caused by the deterioration of the electrode structure due to the ion transfer between the electrodes and the reduction of the electrolyte solution leading to the formation of the decomposition product that deposits on the electrode surface. This layer is called solid electrolyte interphase (SEI).[Reference Kim, Kim, Kim, Park, Kim, Jeon and Kang3, Reference Shi, Guo, Corr, Shi, Hu, Heier, Chen, Seshadri and Stucky4] The cornerstone of making high-performance Li-ion batteries is to produce electrode materials with enhanced charge–discharge capacity that is retained after a high number of cycles. Thus, there has been a growing interest to improve the performance of Li-ion batteries.[Reference Waller, Lai, Rainwater and Liu5–Reference Büyükyazi and Mathur8]
In recent years, nanocomposites of carbonaceous materials coated by either MoO2 or MoS2 have been the scope of the intensive investigations since they have enhanced cycling performance as Li-ion battery anodes due to their high conductivity, large contact area, and good chemical stability.[Reference Chen, Di, Ma, Zhu, Gao, Li, Sun and Ouyang9] Although MoO2 and MoS2 have higher electrochemical activity and high capacity (838 mAh/g for MoO2 and 670 mAh/g for MoS2) than that of graphite electrode (372 mAh/g), their poor cycling stability still remains a problem when they are used alone as the anode material. Thus, many approaches have been extensively done by assembling MoO2 or MoS2 on the different forms of carbon such as graphene, carbon nanotubes, and graphite oxide.[Reference Chen, Di, Ma, Zhu, Gao, Li, Sun and Ouyang9–Reference Liu, Chen, Deng, Su, Guo and Zhu12] However, it is worth mentioning that the processes for the synthesis of these carbon materials result in high production cost.[Reference Agostini, Brutti and Hassoun7, Reference Cohn, Oakes, Carter, Chatterjee, Westover, Share and Pint13] Therefore, hydrothermal carbons (HTCs) can be substituted with aforementioned carbon materials as HTCs have several advantages compared to the former carbon materials for several reasons: (i) they can be prepared from different types of biomass at mild conditions in water at low temperatures (130–220 °C) under autogenic pressures; (ii) the feedstock does not need any drying process as the process is carried out in water. Thus, the HTCs obtained by any type of feedstock including the material that has high moisture content do not require any drying process for the feedstocks; (iii) the process is simple and the reaction medium is water thus it is cheap in comparison with other processes for the preparation of carbon materials. Because of these advantages, they have been studied intensively for their potentials in a number of applications including energy and environment. To the best of our knowledge, the electrochemical performance of the molybdenum supported-HTCs as the hybrid nanocomposites for Li-ion batteries have not been reported. Therefore, the objectives of this work were to synthesize HTC and its molybdenum supported hybrid materials, investigate their performance in Li-ion battery anodes, and compare their cyclic performance characteristics with each other. For this purpose, three different anodes were prepared: HTC obtained from glucose, its MoO2 hybrid derivative (HTC–MoO2) obtained by coating MoO2 on HTC surface, and HTC–MoS2 hybrid derivative obtained by coating MoS2 on HTC surface. The synthesized materials were characterized by elemental analysis, scanning electron microscopy (SEM), transmission electron microscopy (TEM), x-ray diffraction (XRD), and x-ray photoelectron spectroscopy (XPS). The electrochemical measurements (galvanostatic charge–discharge and cyclic voltammograms) of the Li-ion batteries obtained from these anodes were carried out and their anode performance in Li-ion batteries were compared and discussed as well.
Experimental
Synthesis of HTC
1.5 g of glucose [D-(+), Sigma-Aldrich] and 20 mL of deionized water were placed into a Teflon-lined stainless steel autoclave. The autoclave was then sealed and placed in an oven which was set to 200 °C for 48 h. After the autoclave was cooled down, obtained carbons were washed with deionized water several times, filtered, and dried at 105 °C for 4 h.
Synthesis of active materials
40 mg HTC from glucose and 120 mg (NH4)6Mo7O24.4H2O (Sigma-Aldrich) were added in 10/10 mL distilled water/ethanol solution. After stirring for 30 min the mixture was transferred into the autoclave, and it was placed into an oven which was set to 200 °C for 18 h. After filtration, the product was dried at 105 °C for 12 h, and then calcined at 600 °C for 6 h in an argon atmosphere. The hybrid material was labeled HTC–MoO2. Another active material was obtained by using 40 mg HTC of glucose, 120 mg (NH4)6Mo7O24.4H2O, and 120 mg (NH2)2CS (Merck) with the same procedure and it was labeled HTC–MoS2. The last active material was obtained by just calcinating HTC from glucose at 600 °C for 6 h in an argon atmosphere, and it was labeled HTC.
Materials characterization
The morphology of the carbon materials was characterized by SEM (Nova Nano SEM 430, FEI) and TEM (Philips CM 300 FEG/UT, 300 kV). For elemental analysis, Hekatech CHNS EuroEA 3000 Analyzer was used. Hybrid materials were analyzed by XRD (STOE STADI MP) using Cu Ka radiation (λ = 1.5406 Å). XPS was performed with an ESCA M-Probe (Al Kα rays, λ = 8.33 Å). Survey scans were performed with a detector pass energy of 158.9 eV, high-resolution spectra were recorded with a pass energy of 22.9 eV. All spectra were referenced to adventitious carbon signal at 284.8 eV. All spectra were fitted using GL(30) line shape with CasaXPS software from Casa Software Ltd.
Cell fabrication and electrochemical measurements
For the electrochemical measurements, three different active materials (HTC, HTC–MoO2, HTC–MoS2) were separately prepared in vials. Active material, graphite (Super P Li, Timcal) and polyvinylidene fluoride (PVDF, Alfa Aesar) were added in a weight ratio of 70:20:10. After addition of several drops of N-methyl-2-pyrrolidione (NMP, Sigma-Aldrich) on this solid mixture, a viscous slurry was obtained and stirred at the room temperature for 48 h. Thus, the slurry was spread on copper foil using doctor blade and dried in a vacuum oven at 110 °C for 6 h, to construct anodes for battery testing.
Coin half-cell batteries were prepared inside of an argon-filled glove box (O2 and H2O levels <1 ppm, MBraun) using anodes, 1 M LiPF6 in a mixture of ethylene carbonate (EC), ethyl methyl carbonate (EMC), and diethyl carbonate in a weight ratio of 37:46:17 (BASF), a polyethylene separator membrane and lithium metal foil (99.9%, Sigma-Aldrich) as a counter electrode. The galvanostatic measurements were performed with current density of 0.1 A/g and within a potential range of 0.01–3.00 V. The cyclic voltammetry measurements were performed with 0.1 mV/s scan rate and within 0.01–3.00 V potential limits. For the cyclic voltammetry, we use the Metrohm Autolab PGSTAT 101. Galvanostatic measurements were performed with the MTI Corp. BST8-MA battery analyzer.
Result and discussion
Structural characterization of carbon materials
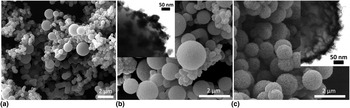
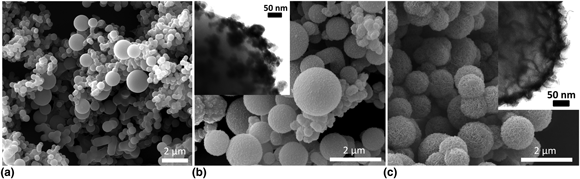
The morphology of the as-prepared HTC derivatives was studied with SEM and TEM. Figure 1 shows that the HTC particles are spherical in shape [Fig. 1(a)]. Calcination of HTC samples did not show any significant changes on the particle morphology based on our previous records.[Reference Simsir, Eltugral and Karagoz14] The size of most spheres was in the range of 300–400 nm. Besides, particles with sizes about 700–800 nm and over 1 µm were observed which are in the form of hard spheres as defined previously.[Reference Wang, Li, Chen and Huang15, Reference Titirici, White, Brun, Budarin, Su, del Monte, Clark and MacLachlan16]
Representative SEM and TEM images (the insets) of (a) HTC, (b) HTC–MoO2, and (c) HTC–MoS2.

It can be seen from the SEM and TEM images given as the inset in Fig. 1(b) that MoO2 nanocrystals are aggregated with irregular shape and size on the carbon spheres. Judging from this image, the thickness of the MoO2 coating is about 25 nm. As it can be seen from the images, MoO2 nanocrystals do not cover the whole surface as a shell with a uniform coating, instead, they are aggregated in the nodular form. Similar results were recorded elsewhere as well.[Reference Chen, Di, Ma, Zhu, Gao, Li, Sun and Ouyang9, Reference Zeng, Zheng, Deng, Ding and Wei10, Reference Ihsan, Wang, Majid, Yang, Kennedy, Guo and Liu17] On the other hand, it was observed that MoS2 nanocrystals were uniformly distributed in HTC without having any uncoated space over the HTC surface. SEM photo depicts that the morphology of the MoS2 aggregation in HTC can be described as a uniformly dispersed wormlike structure with a coating thickness, judging from SEM image, about 46 nm making the HTC–MoS2 sphere core–shell structures [Fig. 1(c)]. TEM image of this structure revealed coating of MoS2 as nanosheet on HTC.
Table I shows the elemental compositions of the glucose (starting material) and its hydrothermal derivatives before and after calcination. The carbon ratio which was 39.64 wt% initially increases to 66.80 wt% with lowered hydrogen content as the hydrothermal carbonization occurs at 200 °C. After the calcination of as prepared HTCs, carbon content further increases to a level of 92.06 wt%.
Elemental composition (wt%) of glucose and HTCs.

a By difference.
b Atomic ratio.
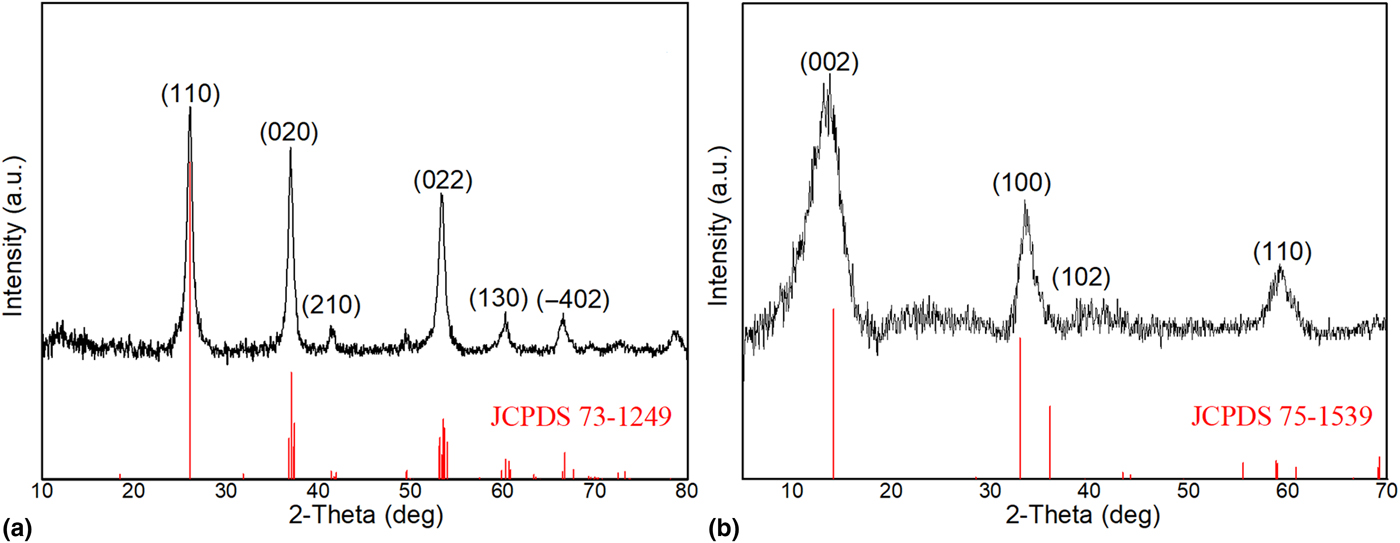
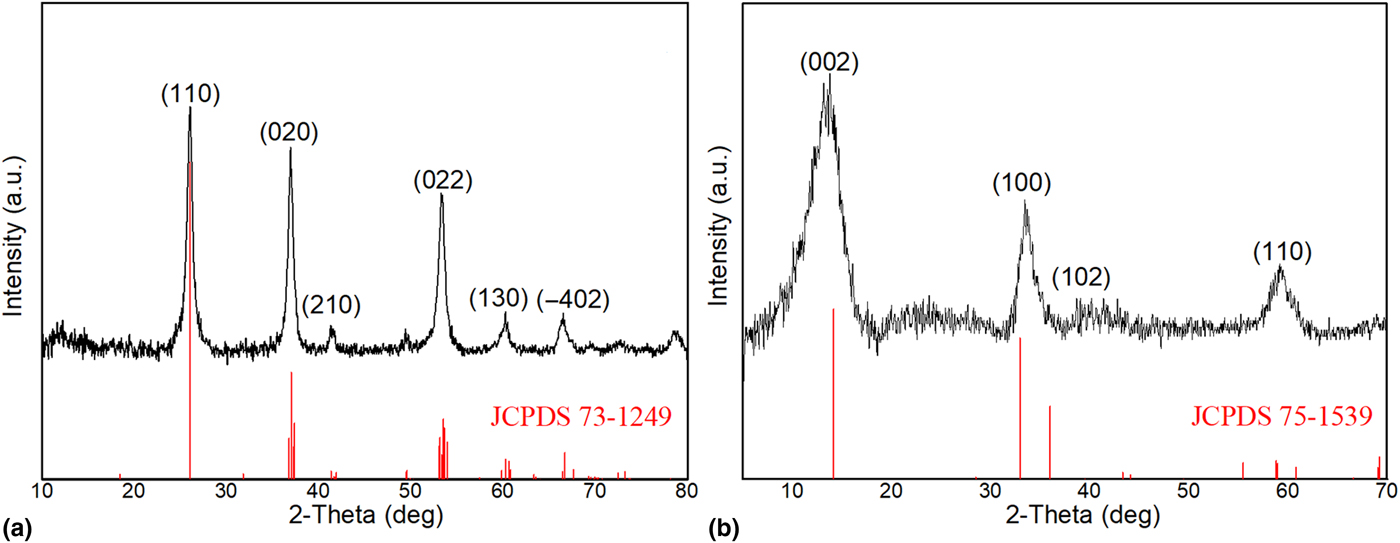
Furthermore, XRD analysis also supports the results obtained from SEM analysis. In Fig. 2(a), all the peaks, 26°, 37°, 53°, 60°, and 66° of the MoO2 (JCPDS 73-1249) are observed in the XRD pattern of the HTC–MoO2 sample. Similarly, looking at the HTC–MoS2 XRD pattern [Fig. 2(b)], all reflections at 14°, 33°, 36°, and 58° of the MoS2 (JCPDS 75-1539) are clearly visible in the structure. However, at 14°, 33°, and 36° are shifted compared with the reference. This may be due to the formation of thin MoS2 nanosheets, as seen from the corresponding TEM image.[Reference Liu, Chen, Deng, Su, Guo and Zhu12] The XRD analysis revealed that HTCs were coated with MoO2 and MoS2 nanocrystals, respectively.
XRD patterns of (a) HTC–MoO2, (b) HTC–MoS2.
XPS measurements were carried out for HTC–MoO2 and HTC–MoS2 samples to investigate the composition of the sample surface. The XPS spectra were given in the Supplementary Material section. The results for HTC–MoO2 are shown in Fig. S1. In the survey spectrum carbon (63.51%), oxygen (25.17%), molybdenum (10.53%), and minor amounts of sulfur (0.70%) were detected [Fig. S1(a)]. The high-resolution spectrum of the O 1s region showed signals for molybdenum trioxide at 530.72 eV as well as for hydroxides, organic oxygen species and defect oxide at 531.84 eV [Fig. S1(b)]. Contrary to the results from the bulk analysis via XRD the Mo 3d/S 2s region revealed that only MoO3 with its components at 232.62 and 235.77 eV was present on the surface of the sample, which was mainly due to sample storage under ambient conditions [Fig. S1(c)]. The position of the S 2s peak at 229.7 eV indicated that trace amount of sulfur detected in its elemental form and not bound to molybdenum. The most probable explanation for this contamination was the usage of the same teflon vessels for the hydrothermal reactions of HTC–MoS2 and HTC–MoO2 samples.
The results for HTC–MoS2 are shown in Fig. S2. The survey spectrum showed also the presence of carbon (19.28%), oxygen (16.18%), molybdenum (26.37%), and sulfur (38.17%) [Fig. S2(a)]. In comparison with HTC–MoO2, the significantly lower amount of carbon could be explained by the much higher surface coverage of the MoS2 sheets according to the SEM results. The O 1s region contained again a peak for molybdenum oxide (MoO3 and Mo2O5) at 530.75 eV, which was an evidence for the oxidation of the particle surface under ambient conditions [Fig. S2(b)]. Next to the oxide peak also signals for the hydroxides, organic oxygen, and defect oxides at 531.60 eV on the one hand, and adsorbed water and further organic oxygen species at 532.66 eV one the other hand could be observed. The S 2p peak showed components for sulfides (63.36%) at 162.57 and 163.75 eV as well as for elemental sulfur (36.64%) at 164.20 and 165.38 eV [Fig. S2(c)]. The sulfides could be related to the duplet for MoS2 at 229.98 and 233.13 eV in the Mo 3d/S 2s region and again be confirmed by the position of the sulfidic S 2s component at 227.34 eV. In addition, the S 2s component for the elemental sulfur could be found at 229.72 eV [Fig S2(d)]. Due to surface oxidation under ambient conditions, further duplets for Mo2O5 at 231.59 and 234.74 eV and MoO3 at 233.5 and 236.65 eV, respectively, were present in the sample. The ratio between the MoS2, Mo2O5, and MoO3 was observed to be nearly 2:2:1.
Electrochemical performance of carbon anodes
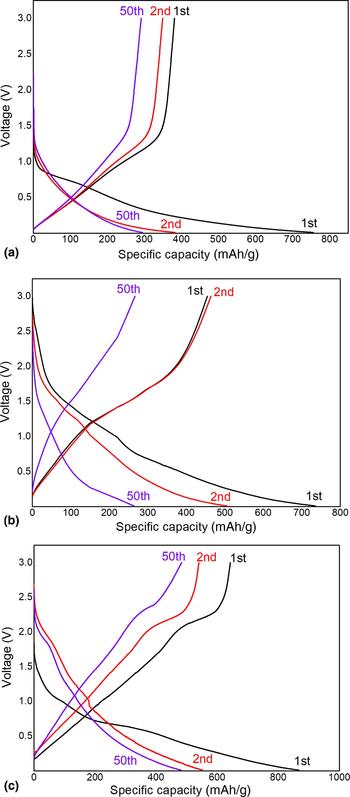
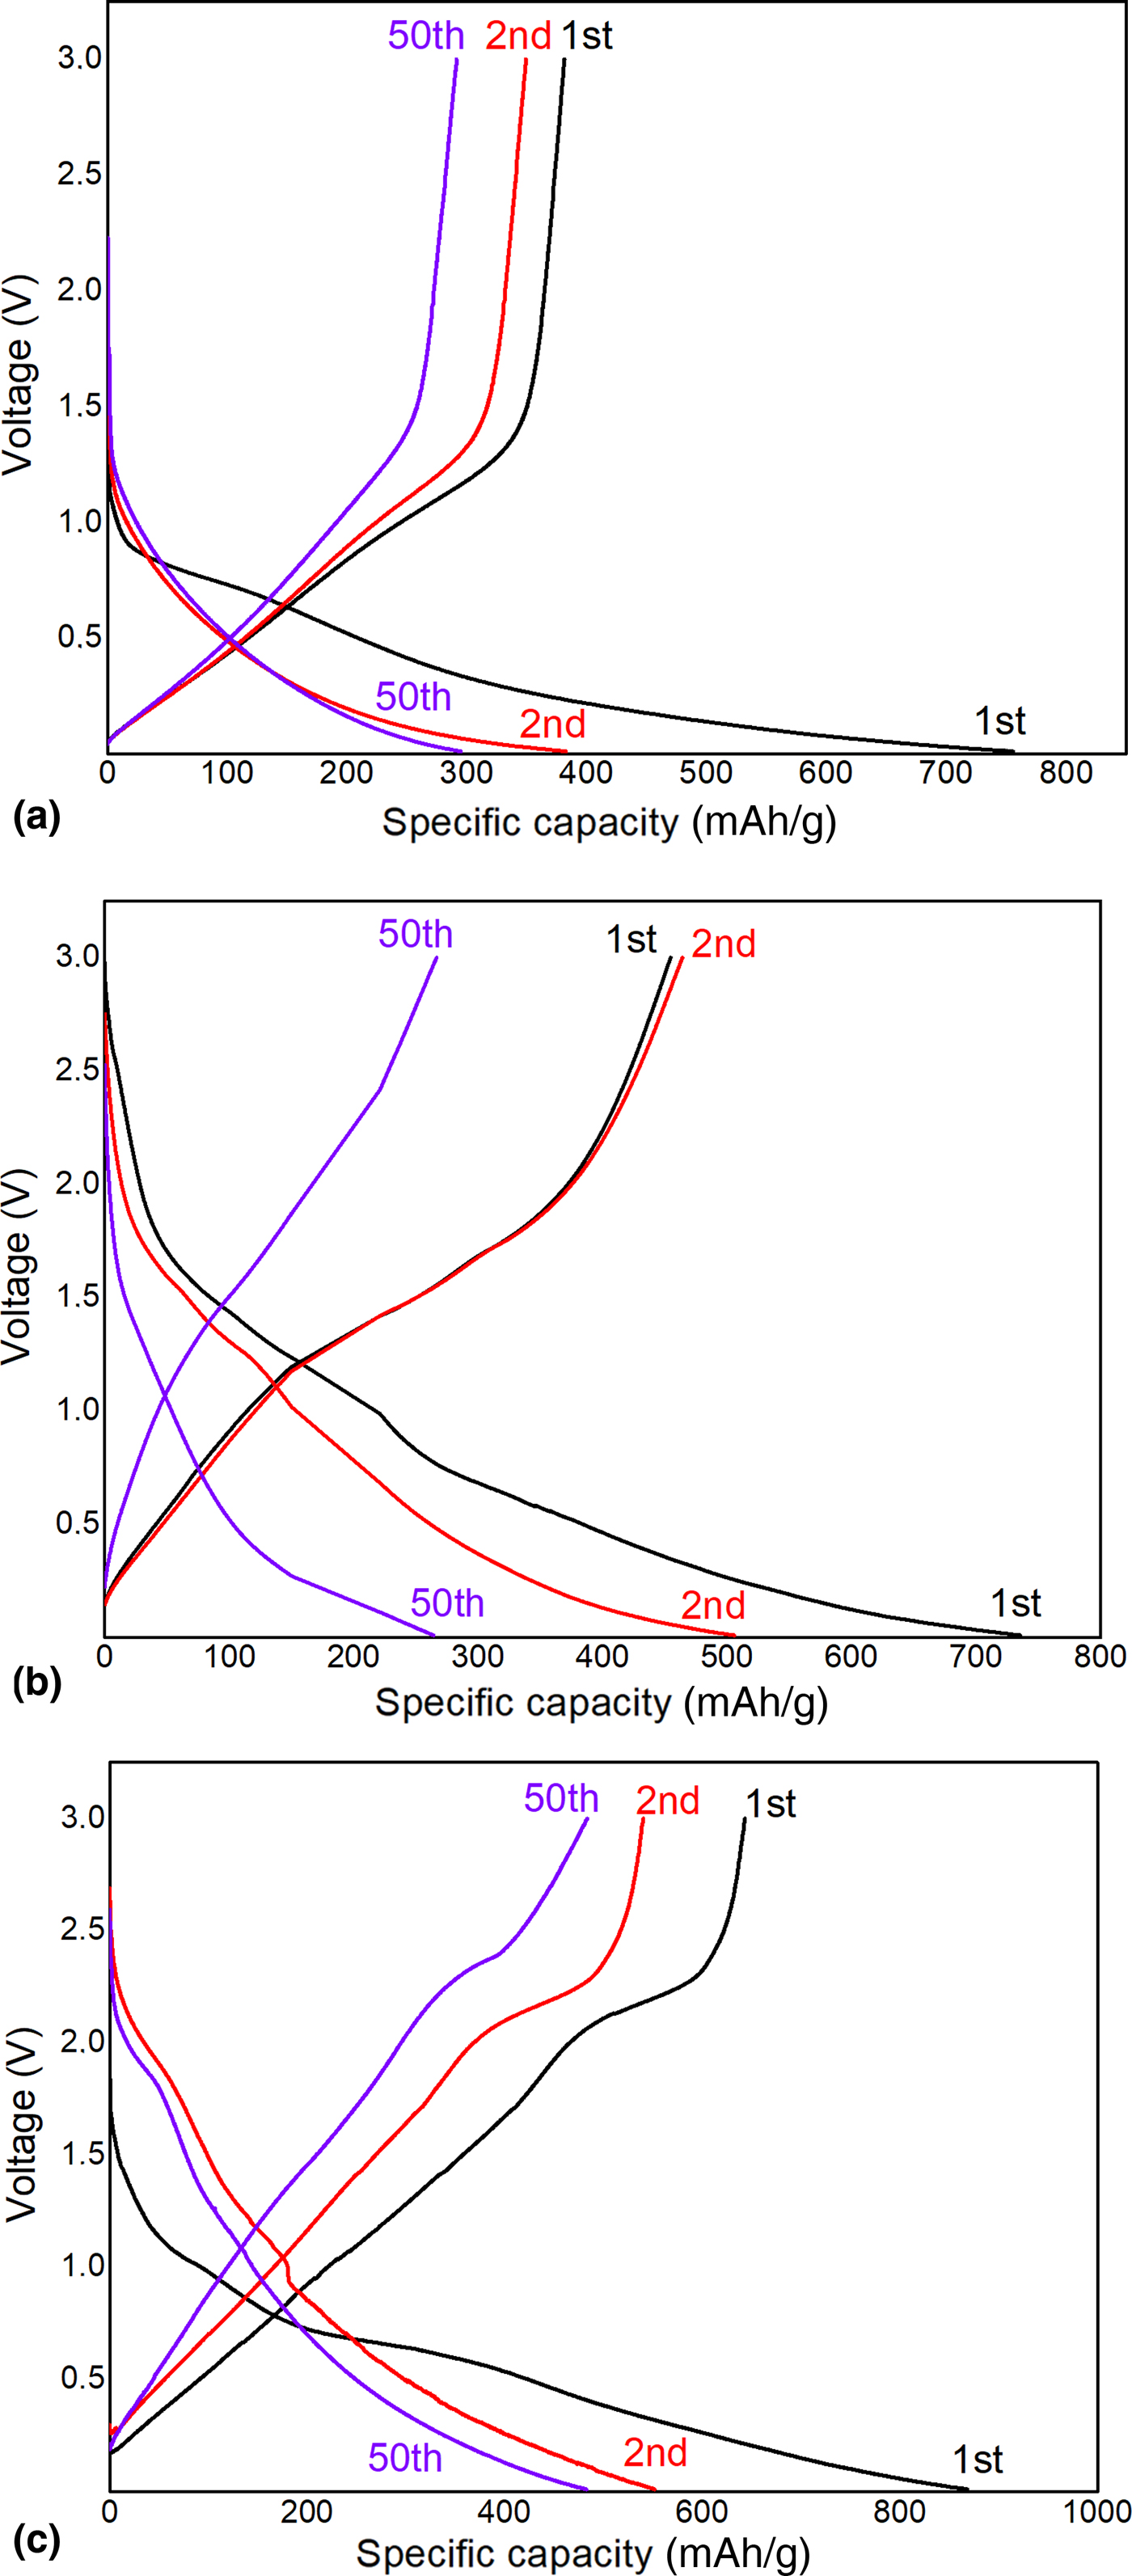
The charge–discharge measurements of the prepared Li-ion batteries were made at potential values between 0.01 and 3.00 V, at a current density of 100 mA/g. It was observed that in the 1st cycle the Li-ion battery using HTC as the anode material has discharge and charge capacities in the 1st cycle of 755 and 381 mAh/g, respectively. The irreversible capacity loss is 49%. In the 2nd cycle, those capacities become 382 and 348 mAh/g, respectively, resulting in a much higher coulombic efficiency of 91% which reaches up to 98% at the end of the 50th cycle [Fig. 3(a)]. In the case of the Li-ion battery prepared by using HTC–MoO2 anode material, the initial discharge and charge capacities are 734 and 454 mAh/g, respectively. In the 2nd cycle, these capacities become 462 and 505 mAh/g, respectively. The coulombic efficiency is 89%, which goes up to 98% at the end of the 50th cycle with the discharge, and charge capacities of 266 and 263 mAh/g, respectively [Fig. 3(b)]. HTC–MoO2 was found to have better cyclic performance than that of bulk MoO2 at similar conditions from the previous reports where bulk MoO2 was shown to have the initial discharge capacity of 543 mAh/g and then decreases to 73 mAh/g at the end of 50 cycles.[Reference Zeng, Zheng, Deng, Ding and Wei10, Reference Sun, Hu, Luo and Huang18, Reference Yang, Liu, Zhu, Wang and Wu19] On the other hand, the discharge capacity of the Li-ion battery made by using HTC–MoS2 material is 868 mAh/g, while the charge value is 642 mAh/g in the 1st cycle. They are 551 and 540 mAh/g, respectively, in the 2nd cycle. The coulombic efficiency is 98%, and it goes up to 99% at the end of the 50th cycle with the discharge and charge capacities of 484 and 483 mAh/g, respectively [Fig. 3(c)]. From previous reports, initial discharge and charge capacities of pure MoS2 were given as 451 and 400 mAh/g, respectively. However, its capacity sharply drops to 110 mAh/g after 60 cycles.[Reference Liu, Chen, Deng, Su, Guo and Zhu12] Therefore, our results indicate that HTC–MoS2 shows improved specific capacity compared with the pure MoS2.
Charge–discharge curves of (a) HTC, (b) HTC–MoO2, (c) HTC–MoS2.
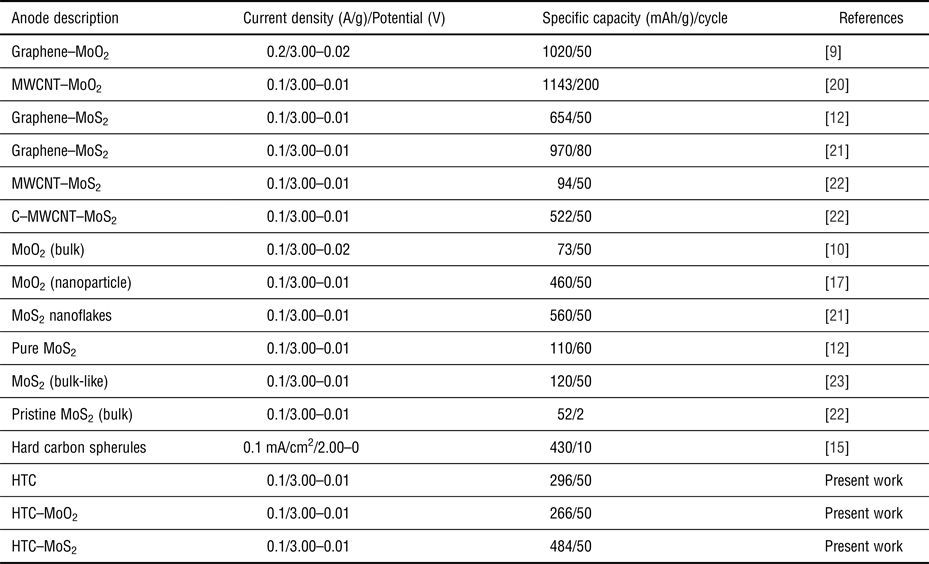
The electrochemical performance of the molybdenum-supported hybrid composites of the HTC was comparable with those reported in the literature as shown in Table II. The specific capacities of synthesized HTC hybrid composites seemed to be lower than that of the composites of graphene or multiwalled carbon nanotubes (MWCNT). Notably, HTC can be prepared from any type of biomass with a green and simple process. Hence, it is more likely in the industrial area of applicability of such material.
Electrochemical performance comparison of the present work with some previously published reports

The irreversible capacity loss is due to the irreversible reaction of Li-ions and formation of SEI layer that deposits on the anode surface.[Reference Whittingham2–Reference Shi, Guo, Corr, Shi, Hu, Heier, Chen, Seshadri and Stucky4] By observing the charge–discharge measurement, the irreversible capacity loss appears to be the largest at HTC. This effect was reduced when the HTC surface was coated with MoO2 or MoS2. For all measurements, a very high coulombic efficiency value was obtained after the 2nd cycle. Particularly, in the HTC–MoS2, 98% efficiency was obtained at the 2nd cycle. Our findings indicate that all the tested anode electrodes exhibited good cycling performance at a current density of 100 mA/g. HTC and HTC–MoO2 exhibited similar reversible discharge capacities of 296 and 266 mAh/g, respectively after 50 cycles. Furthermore, the reversible discharge capacity of the tested anode material, HTC–MoS2 at the same condition was 484 mAh/g which is higher than that of graphite. When we switch from HTC to HTC–MoS2 anode material, the reversible capacity increases from 296 to 484 mAh/g and the capacity value is retained for 50 cycles. The reason for this can be attributed to the fact that MoS2 in the form of nanosheets is dispersed uniformly all around the carbon surface and they offer more sites for Li-ion intercalation. This intrinsic structure provides a more facile Li-ion storage as well as shortened pathways for efficient diffusion of the ions and transportation of the electrons.[Reference Zeng, Zheng, Deng, Ding and Wei10, Reference Liu, Chen, Deng, Su, Guo and Zhu12]
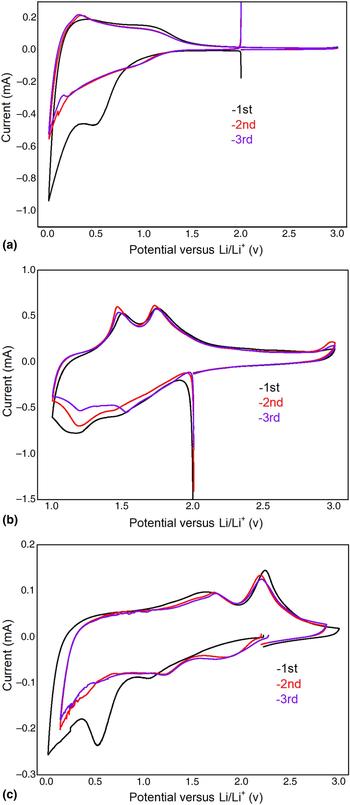
CV measurements of (a) HTC, (b) HTC–MoO2, (c) HTC–MoS2.
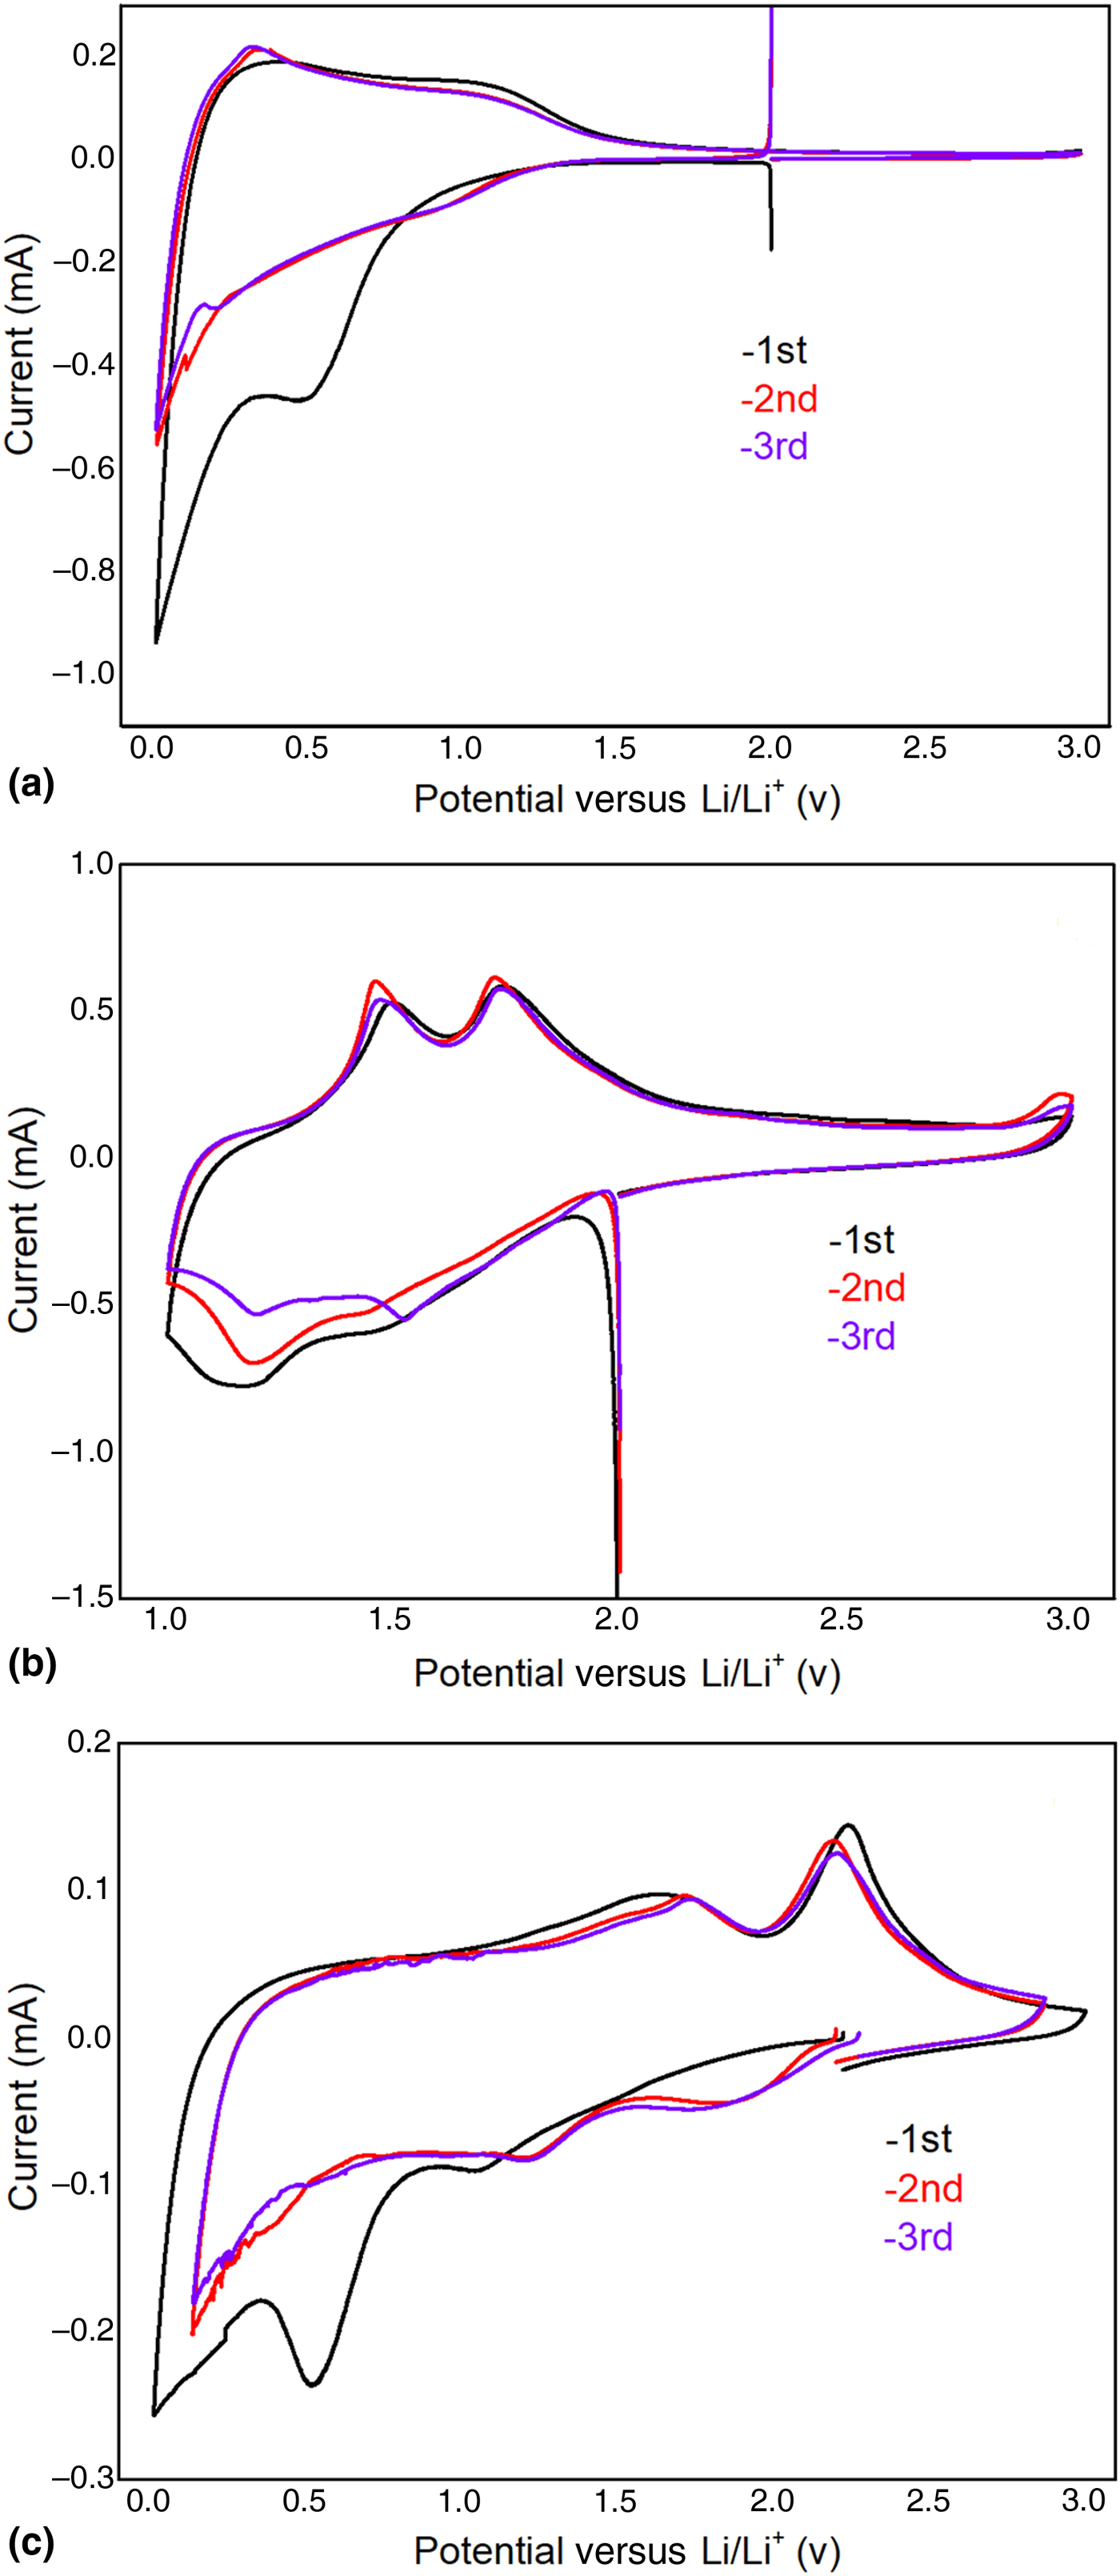
We investigated the electrochemical changes in the structure during the charge–discharge of the Li-ion battery obtained by using the HTC anode with the cyclic voltammetry measurements [Fig. 4(a)]. According to the results obtained from these measurements, the peaks observed between 0.10 and 0.21 V are due to the electrolyte deterioration. The peak at 0.50 V seen in the 1st cycle and not visible in the other cycles is due to the solid–electrolyte interaction.[Reference Liu, Chen, Deng, Su, Guo and Zhu12, Reference Li, Xu, Tan, Wang, Holt, Stephenson, Olsen and Mitlin24] The peaks observed at 0.96 and 1.14 V[Reference Xing, Ju, Zhao, Wan, Zhu, Qiang and Qian25] correspond to reduction and oxidation of Li-ion, respectively, on the electrode surface. Lithium insertion/extraction at carbon structures can be written as Eq. (1).
 $${\rm Li} + 6{\rm C}\; \leftrightarrow \; {\rm Li}{\rm C}_6. $$
The Li-ion battery obtained using the HTC–MoO2 anode shows two reduction/oxidation peak pairs at about 1.20/1.52 and 1.46/1.73 V which are attributed to the phase transition of partially lithiated LixMoO2 during insertion/extraction of lithium at the anode side [Fig. 4(b)].[Reference Auborn and Barberio26] At potential values below 1.00 V, it is known that peaks arise from electrolyte depletion and solid–electrolyte interaction. Therefore, the potential values between 1.00 and 3.00 V were measured.[Reference Liu, Chen, Deng, Su, Guo and Zhu12, Reference Li, Xu, Tan, Wang, Holt, Stephenson, Olsen and Mitlin24] There are some differences in the intensity of the peaks obtained at the end of the ongoing conversions. These differences are due to the degradation of the anode which is caused by lithium insertion and extraction. Lithium insertion/extraction on the MoO2 structure can be written as Eq. (2).[Reference Zeng, Zheng, Deng, Ding and Wei10]
 $$x{\rm L}{\rm i}^ + + xe^ - + {\rm Mo}{\rm O}_2\; \leftrightarrow {\rm L}{\rm i}_x{\rm Mo}{\rm O}_2. $$
Figure 4(c) shows the first three discharge/charge profiles of the HTC–MoS2. In the first cathodic scan, the peak at 1.22 V can be ascribed to the phase transformation of MoS2 from trigonal prismatic (2H) to octahedral (1T) structure. This peak was observed at 1.22 V shifts to 1.33 V in the following cycles.[Reference Wang, Wei, Ozawa, Cai, Cheng and Kimura23, Reference Ma, Zhou, Xu, Xu, Zhang and Chen27] Continuously, the peak at 0.52 V can be assigned to the formation of SEI. Furthermore, this peak was absent in the subsequent cycles. In the 2nd and 3rd cycles, a broad new peak at 1.84 V shows that MoS2 is reduced to Mo metal and Li2S according to the following reaction [Eq. (3)].[Reference Yuan, Wang, Wang and Bai21]
 $${\rm Mo}{\rm S}_2 + 4{\rm Li}\; \leftrightarrow {\rm Mo} + 2{\rm L}{\rm i}_2{\rm S}{\rm.} $$
The peaks at 1.71 and 2.21 V potential values are oxidation peaks and can be attributed to the oxidation of Mo to form MoS2 and oxidation of Li2S to S, respectively.[Reference Xiao, Choi, Cosimbescu, Koech, Liu and Lemmon28, Reference Liu, Su, Zhou, Sun, Wang and Qiao29] Lithium insertion/extraction on MoS2 structure can be written as Eq. (4).[Reference Wang, Wei, Ozawa, Cai, Cheng and Kimura23]
 $${\rm Mo}{\rm S}_2 + x{\rm L}{\rm i}^ + + xe^ - \leftrightarrow \; {\rm L}{\rm i}_x{\rm Mo}{\rm S}_2. $$
Conclusions
HTCs prepared from the decomposition of glucose at low temperature (200 °C) were studied as anode materials for Li-ion batteries. The HTC samples showed good electrochemical properties that could be improved by fabricating HTC–MoO2 and HTC–MoS2 nanocomposites, which can be considered as anode materials for Li-ion batteries due to their high reversible capacities of 266, and 484 mAh/g, respectively after 50 cycles, when compared with pristine HTC (296 mAh/g). These values comparable with the theoretical capacity of graphite (372 mAh/g) and since HTCs were synthesized from glucose at lower temperatures and under milder conditions, this approach can be considered as a green and versatile strategy for both preparation and further modification of enhanced hybrid carbon architectures suitable for anode materials in Li-ion batteries.
Supplementary material
The supplementary material for this article can be found at https://doi.org/10.1557/mrc.2018.71
Acknowledgments
The financial support by the Karabuk University (Project ID number: KBU BAP-17-DR-047) and the University of Cologne is gratefully acknowledged. S. M. acknowledges a strategic collaboration between the Christiansen research group at Helmholtz-Zentrum Berlin für Materialien und Energie and the Research Group Mathur.