I. INTRODUCTION
The deployment of advanced nuclear energy systems depends critically on the development of advanced high performance materials that can tolerate extreme environments of intense radiation fields, high temperature, stress, and corrosion. Life extension of existing nuclear power plants relies on understanding irradiation-induced material degradation after long-term service. Designing radiation, heat, and corrosion-resistant materials and predicting the response of materials in extreme nuclear environments are two grand challenges for future growth of nuclear energy.
Irradiation generates a large population of point defects and their complexes in a crystalline solid. Further evolution of these defects leads to formation of extended defect structures, such as dislocation loops, stacking fault tetrahedra, voids, and helium bubbles. In certain cases, irradiation can also introduce second-phase precipitation and phase transformations in the parent (matrix) phase. The formation of a given type of defect structure is dependent on material chemistry, microstructure, irradiation temperature, dose, and dose rate. Uniformly distributed dislocation loops are typically formed at low doses and low temperatures (T < 0.3T m, where T m is the melting point). Reference Zinkle and Singh1 Heterogeneous dislocation loop structures and dislocation networks are observed at intermediate and high doses. Reference Singh and Evans2 Significant void and helium bubble formation occurs at higher irradiation temperatures (0.3T m < T < 0.5T m). Reference Trinkaus, Singh and Foreman3 Phase transformations have been observed in various alloys under irradiation due to ballistic transport and radiation-enhanced diffusion. Reference Wollenberger4
Each of these microstructural changes can affect the physical and mechanical properties of a material and severely degrade the reliability and lifetime of nuclear reactor components. Common degradation phenomena in nuclear reactor materials include low-temperature embrittlement, void swelling, irradiation creep, high-temperature grain boundary helium embrittlement, and irradiation-induced stress corrosion cracking. Reference Zinkle and Busby5 Characterization and quantification (number density, mean size, size distribution, etc.) of these irradiation-induced defects and understanding their effects on macroscopic mechanical properties are of fundamental importance for addressing the two grand challenges.
The macroscopic mechanical response of a material is a result of many competing dynamic processes originating from atomic and microscopic length scales. At the current stage, however, the relationship between these dynamic processes and resulting macroscopic mechanical response has relied largely on phenomenological or empirical models. These models are not particularly effective in providing a good description of material behavior beyond the testing conditions and do not truly capture the fundamental physics of these dynamic processes. To describe the macroscopic material behavior under any external conditions (such as temperature and strain rates), multiscale modeling that captures the fundamental physics at the smaller length scales combined with appropriate linking assumptions is necessary. Furthermore, such modeling efforts must be closely coupled with in situ experiments at appropriate length scales.
Third-generation synchrotron sources produce high-brilliance, hard x-rays, which allow nondestructive in situ measurements with high spatial and temporal resolution. For example, the internal stresses in a polycrystalline material were determined to elucidate the behaviors of constituent phases in the material during tensile, compressive, and/or cyclic loading. Reference Haeffner, Almer and Lienert6 Strain and texture mapping around a crack tip by in situ synchrotron x-ray diffraction provided a better understanding of deformation and crack propagation mechanisms under static and fatigue loading. Reference Daymond, Young, Almer and Dunand7 Combined imaging studies, such as grain structure mapping by diffraction contrast tomography and crack mapping by synchrotron x-ray microtomography in corrosive environments, have provided insight into the dynamic interaction of a growing crack with crystal structure and the contribution of different boundary types to cracking resistance. Reference King, Johnson, Engelberg, Ludwig and Marrow8 These studies point to critical and available tools which can be used to understand the micromechanical behavior of materials relevant to nuclear energy. Information obtained from these experimental techniques is crucial for multiscale modeling efforts.
In this study, we demonstrate the application of two high energy x-ray techniques to study nuclear-relevant materials. The first is simultaneous small-angle and wide-angle x-ray scattering (SAXS/WAXS) with in situ thermo-mechanical loading. Here, the grain ensemble average information on a polycrystalline material is obtained, over a wide range of size scales ranging from 0.1 to 100 nm. The second is far-field high-energy diffraction microscopy (FF-HEDM) where information about individual grains in a polycrystalline material is obtained. Reference Poulsen9 FF-HEDM is distinguished from a related technique of near-field HEDM, in that the former provides high resolution information on lattice parameters, orientations, and center-of-mass positions within grains, while the latter provides detailed information on grain shapes. Reference Suter, Hennessy, Xiao and Lienert10 Data from these techniques can provide critical tests to existing micromechanical models, enable more accurate predictions of mechanical performance of nuclear reactor materials subjected to extreme environments and, in doing so, facilitate the development of new reactor materials.
II. METHODS
A. Oxide dispersion-strengthened (ODS) steels measured with SAXS/WAXS
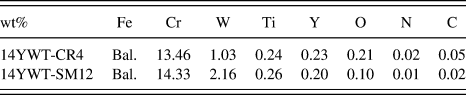
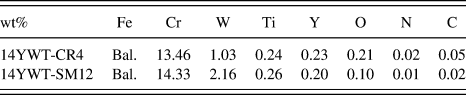
The 14YWT samples investigated are nanostructured ferritic alloys. They contain ultrafine grains and high densities of nanometer-sized oxide particles. These nanometer-sized oxide particles are also referred to as Y-, Ti-, and O-enriched nanoclusters and provide excellent high-temperature strength and creep properties, good low-temperature fracture toughness, and high resistance to neutron irradiation. Two heats of 14YWT were examined, namely, 14YWT-CR4 and 14YWT-SM12. Their chemical compositions are listed in Table I. The 14YWT-CR4 heat was made from argon gas atomized prealloyed powders made by Crucible Research. It was extruded at 850 °C, heat-treated at 1000 °C for 1 h, and rolled parallel to the extrusion direction at 600 °C to 40% reduction in thickness (RIT). The 14YWT-SM12 heat was produced by a mechanical alloying process using gas-atomized powder produced by Special Metals Inc. It was extruded at 850 °C, annealed at 1000 °C for 1 h followed by rolling parallel to the extrusion direction at 1000 °C to 50% RIT. Due to improved mechanical alloying conditions, SM12 has significantly lower C, N, and O levels than CR4. For both heats, miniature sheet-type tensile samples were machined, with the rolling direction parallel to the loading axis. The nominal yield strength of heat SM12 is approximately 1100 MPa at room temperature and decreases continuously with increased temperature; at 800 °C, its yield strength is 250 MPa. Reference Hoelzer, Unocic, Manneschmidt and Sokolov11 The nominal dimensions of the gauge section of these samples were 5 mm × 1.2 mm × 0.75 mm.
The chemical compositions of the two heats of 14YWT examined in this work.
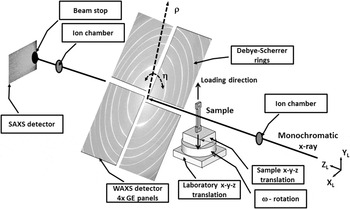
Simultaneous SAXS/WAXS measurements were conducted on the 14YWT samples using the setup shown in Fig. 1 at the 1-ID beamline of the Advanced Photon Source (APS). Four GE-RT41 panels recorded the WAXS signals at a sample–detector distance (Z WAXS) of 2103 mm and were arranged to form a hole in the center through which the transmitted direct beam and the SAXS signals could pass. The transmitted direct beam and SAXS signals were recorded downstream using an ion chamber and Scint-X DXI-11000 camera (Scint-X, Kista, Sweden) (Z SAXS = 3800 mm), respectively. Each GE detector had 2048 × 2048 pixels2 and a 0.2 mm pixel pitch, while the ScintX detector consisted of 2012 × 1340 pixels2 and a 0.018 mm pixel pitch (2x binned mode). The x-ray energy was 70 keV and vertically focused at the SAXS detector position using refractive lenses Reference Shastri, Almer, Ribbing and Cederstrom12 located approximately 20 m upstream of the SAXS detector, with an effective beam size at the sample of 0.1 × 0.05 mm2 (H × V). A NIST standard CeO2 powder 13 was measured prior to sample measurements to refine the WAXS instrument parameters including sample–detector distances, beam position, and detector distortions. As discussed for the FF-HEDM data below, calibrations were accurate to ∆d/d < 10−4 for all CeO2 rings recorded. SAXS data were similarly calibrated using a glassy carbon standard. Reference Zhang, Ilavsky, Long, Quintana, Allen and Jemian14 Typical WAXS and SAXS images for the ODS steel are shown in the figure, along with the definition of detector azimuth angle, η (X L is along η = 0°), and radial distance, ρ. The SAXS detector was offset from the direct beam to maximize the Q-space coverage.
Schematic of SAXS/WAXS measurements, including actual images from an ODS sample and definitions of laboratory coordinates X L–Y L–Z L and detector coordinates η and ρ.

In addition to ex situ measurements, the SM12 samples were also subjected to in situ thermo-mechanical deformation, using a MTS servo-hydraulic machine and a clamshell design IR furnace, as described by Wang et al. Reference Wang, Li and Almer15 The sample was first heated from room-temperature to 800 °C, at 0.9 °C/s, while under load control (85 MPa) to account for thermal expansion of the sample and grips. The sample was then deformed in displacement control at 5 × 10⁻⁵ mm/s until nonuniform deformation along the gauge section (necking) was observed. During the entire process, both SAXS and WAXS signals were recorded at 10 s intervals.
B. High-temperature ultrafine-precipitate-strengthened (HT-UPS) steels measured with FF-HEDM
HT-UPS austenitic stainless steels are candidates for structural and cladding applications in the next-generation advanced nuclear reactors because of improved creep resistance and irradiation tolerance over traditional 316 stainless steel. Reference Busby16 The nominal composition of the HT-UPS stainless steel samples examined in this work is shown in Table II.
The chemical compositions of the HT-UPS stainless steel examined in this work.

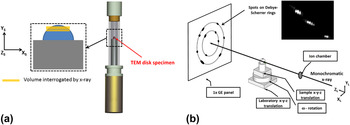
The samples were solution annealed at 1200 °C for 1 h. A set of transmission electron microscopy (TEM) disk samples (3 mm diameter × 0.2 mm thick) were extracted from a single batch of HT-UPS steel. A subset of these was neutron-irradiated to 3 dpa at 500 °C at the Advanced Test Reactor at the Idaho National Laboratory. When measured at the APS, the activity of a sample was less than or equal to 50 μSv/h at a distance of 30 cm. Both neutron-irradiated samples and nonirradiated control samples were individually mounted in a double-contained Kapton sample holder [Fig. 2(a)] and sealed at the Irradiated Materials Laboratory at Argonne National Laboratory (ANL). The double-contained samples were then transferred to the APS 1-ID beamline for ex situ FF-HEDM experiments where several layers of the irradiated and control samples were interrogated with high energy x-rays by translating the sample with respect to the x-ray beam [Fig. 2(b)].
(a) Schematic of the irradiated HT-UPS sample measured, with the disk-shaped sample sitting on a sample holder and encapsulated in two layers of Kapton tube. An enlarged view of the sample illustrates the volumes interrogated by the x-rays. (b) Schematic showing full FF-HEDM setup, along with actual diffraction spots.

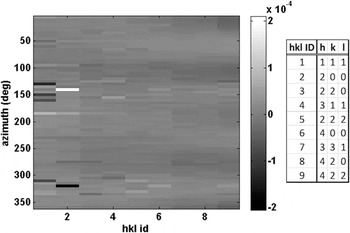
FF-HEDM measurements were conducted as illustrated in Fig. 2(b), with a x-ray beam energy of 65.351 keV and beam size of 2 × 0.2 mm2 (H × V). A single panel GE-RT41 detector was placed approximately 909 mm downstream of the sample and nominally centered on the incident beam. As opposed to the smoothly varying intensities associated with the fine-grained ODS steel samples (Fig. 1), the coarser-grained HT-UPS samples produced spotty diffraction patterns which ensured that individual grains could be measured using the FF-HEDM technique. Datasets were obtained by taking a series of GE detector images at 0.5° intervals in ω over a range of −180° to +180°, where ω is the rotation about Y L and defined such that at ω = 0° the sample S and laboratory L coordinate systems are identical. Three sample layers were measured by translating the sample along Y L a distance of 0.2 mm/layer. NIST CeO2 powder patterns were measured at ω = 180° and −180° to determine the instrument parameters. The residuals between the fitted and expected d-spacings, as expressed as pseudo-strains, were on the order of 1 × 10⁻⁵ establishing the instrumental uncertainty (Fig. 3). Furthermore, diffraction spots from a single crystal standard such as the ruby standard from NIST 17 are used to determine the angular orientation of the detector with respect to the direct beam.
Instrument parameter optimization results for the CeO2 powder for single-panel GE used for FF-HEDM, showing pseudo-strains for different families of crystallographic planes and η (binned in 5° segments). Color bar denotes the pseudo-strains. The mean value is 1 × 10⁻⁵ with standard deviation on the same order.

To obtain grain-resolved information from the FF-HEDM data, the diffraction spots for the {111} and {200} crystallographic planes emanating from individual grains in the illuminated volume were identified using intensity thresholding. Their positions (or the associated scattering vectors) were corrected for systematic distortions using the instrument parameters obtained from CeO2 data. These spots were then indexed Reference Sharma, Huizenga and Offerman18,Reference Sharma, Huizenga and Offerman19 to obtain the center of masses (COMs), crystallographic orientations, and elastic strains of the constituent grains in the illuminated volume.
III. RESULTS
A. SAXS/WAXS measurements on ODS steels
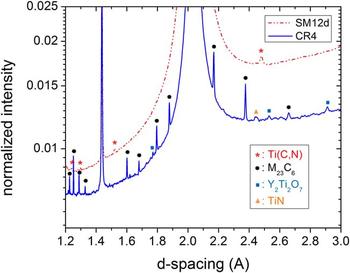
Figure 4 shows a portion of the η-integrated WAXS diffraction pattern for the as-received SM12 and CR4 samples, magnified to emphasize the minor phases. The higher content of C and O in CR4 leads to extensive precipitation of primarily the M23C6 phases. Here, we employ a general notation, M23C6 for carbides with crystal lattice of Cr23C6 where Cr is often replaced with Ni, Mo, Fe, and W. Traces of TiN and Y2Ti2O7 are also present. In contrast, the SM12 diffraction pattern is much cleaner, with Ti(C,N) as the only identifiable precipitate phase with a lattice parameter of 4.298 Å. Since the lattice parameter is 4.327 Å for TiC and 4.242 Å for TiN, the precipitate composition is calculated to be TiC0.66N0.34 assuming Vegard's law. There are no visible diffraction peaks from Yi–Ti–O phases in SM12, which is attributed to the small volume fraction and small sizes of the oxide particles (4–5 nm on average observed in TEM) which leads to substantial peak broadening.
WAXS diffraction pattern (over partial d-spacing range) of the as-received SM12 and CR4 samples with precipitate peaks labeled. The intensity is normalized to a value of 1 for the strongest reflection in both samples, Fe {110}, which is located at d = 2.03 Å.

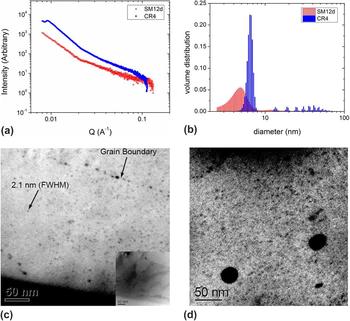
Figure 5(a) shows the azimuthally averaged SAXS intensity profiles for the SM12 and CR4 samples. The small volume fraction and sizes of the Y–Ti–O particles make them unresolvable by WAXS. SAXS provides an opportunity to make up the missing information. As seen in Fig. 5(a), there are significant differences between the alloys: at high Q values, the intensity extends to higher Q for SM12 than for CR4, which indicates that the smallest features in SM12 are smaller than those in CR4; at lower Q values, CR4 shows a transition from the Porod regime to the Guinier regime while SM12 does not (due to the Q-min limitation of the experimental setup), which indicates that there are features of tens of nanometers in size in CR4 while not in SM12. The volume distributions of the scattering domains, obtained from those Q-plots by using the software Irena, Reference Ilavsky and Jemian20 are shown in Fig. 5(b). The majority of the particles in SM12 have an average size of 4–5 nm, which is smaller than those in CR4 which have an average of 6–7 nm. As seen in Figs. 5(c) and 5(d) for the SM12 and CR4 samples respectively, the energy filtered TEM Fe M-jump ratio observations reveal that these particles are Y–Ti–O. In CR4, there is a significant group of particles with sizes of tens of nanometers. These large particles contribute to the diffraction signal observed in Fig. 4.
Results for ODS as-received samples. (a) Azimuthally integrated SAXS intensity versus Q for the as-received SM12 and CR4 samples. (b) Derived particle volume distributions from the SAXS data in (a). (c) EFTEM image of as-received SM12 showing the oxide particles, and (d) EFTEM image of as-received CR4 showing the precipitate particles.

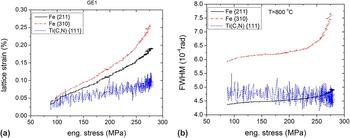
The phase-specific response of the SM12 sample to applied deformation at 800 °C was quantified by fitting pseudo-Voigt functions to diffraction peaks from each phase, and the results are shown in Fig. 6. Lattice strains were computed from diffraction peak shifts, using
 ${\varepsilon _{nn}} = {{\mathop {{d_0}}\nolimits^n - {d^n}} \over {\mathop {{d_0}}\nolimits^n }}$
, where ε
nn
is the lattice strain measured along measurement direction,
n
,
 $\mathop {{d_0}}\nolimits^n$
is the reference d-spacing measured along
n
in the unloaded condition at a given temperature and d
n
is the d-spacing measured along
n
at load at the same temperature. The lattice strains are presented as a function of applied stress in Fig. 6(a) for the Fe matrix grains, whose {211} planes or {310} planes are parallel to the loading axis, and the Ti(C, N) precipitate grains, whose {111} planes are parallel to the loading axis. The lower intensity of the precipitate peaks leads to higher scatter in the data, but trends between phases can still be delineated. In particular, while the slope of the Ti(C, N) {111} strain is small but constant versus applied stress, those from the Fe {211} and {310} reflections change slope at a value of about 230 MPa. Figure 6(b) shows the corresponding full width at half maximum (FWHM) values. The Fe matrix peaks, particularly the {310}, broaden significantly above 230 MPa while the precipitate peak is essentially constant.
Phase-specific response of SM12 specimen to applied stress at 800 °C: (a) lattice strain of Fe {211}, {310}, and Ti(C,N) {111} along the loading direction. (b) FWHM of the same reflections.

B. HEDM measurements on HT-UPS
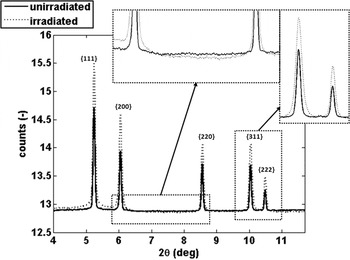
Before presenting individual grain data, the “powder average” scattering patterns of HT-UPS samples are shown in Fig. 7. These patterns were computed for both control and irradiated samples, by summing images from all ω orientations (−180° – +180°). Noteworthy is the absence of secondary phases in either the initial or irradiated specimens, indicating phase-stability under the irradiation and both a broadening and slight shift to higher 2θ values (corresponding to smaller d-spacings) after irradiation for the austenite Fe-peaks.
Integrated “powder” lineouts for the HT-UPS samples in irradiated and control states. Counts are in a logarithmic scale. The peak widths in the irradiated sample are larger than those in the control sample, and shifted to slightly larger values of 2θ. Note the absence of secondary phases in both samples.

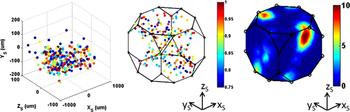
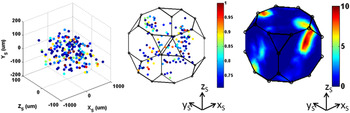
Diffraction spots from {111} and {200} planes were used in the FF-HEDM analysis as their intensities were well above the background levels of the area detector. Through the FF-HEDM analysis, 979 grains were indexed in the control sample for all three layers, and 1075 grains in the irradiated sample for all three layers with a completeness of 0.7 or higher. The completeness of a grain is defined as the number of measured diffraction spots divided by the number of expected diffraction spots. For a particular grain in the aggregate, 28 diffractions spots were anticipated and at least 19 diffraction spots were required. The volume of a grain is estimated by enforcing that the diffraction spots that belong to a grain have matching intensities and normalizing the diffraction spot intensities with the incident flux. Reference Offerman, Sharma, Kannengiesser, Babu, Komizo and Ramirez21 Figures 8 and 9 show the COMs and crystallographic orientations of the grains found in one of the three layers in the control and irradiated samples, respectively. Rodrigues parameterization is used to represent the crystallographic orientation of the grains with respect to the sample. Reference Kocks, Tomé, Wenk and Mecking22 While there are a few outliers, the majority of grain COMs are within the sample dimensions. These outliers were removed for subsequent analyses. It is also worthwhile to note that the completeness is, in general, lower for the irradiated sample. This may be attributed to the fact that the diffraction spots from the irradiated sample are smeared significantly compared to those obtained from control sample, which is further discussed below. Also plotted in the figures are the orientation distribution functions (ODFs) for the two states computed from the crystallographic orientations of individual grains. The initial crystallographic texture is significant, with a maximum multiple of uniform distribution (MUD) of about 10 and attributed to directional thermo-mechanical deformation (rolling) during material processing. As anticipated, this initial crystallographic texture does not evolve with irradiation.
Grain COMs (left) and crystallographic orientations (center) obtained from HEDM measurements of a layer of the control sample. Colors denote completeness. ODF computed from the crystallographic orientations of the constituent grains in the layer (right). Color denotes MUDs.

Grain COMs (left) and crystallographic orientations (center) obtained from HEDM measurements of a layer of the irradiated sample. Colors denote completeness. ODF computed from the crystallographic orientations of the constituent grains in the layer (right). Color denotes MUDs.

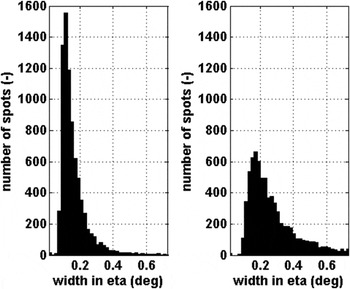
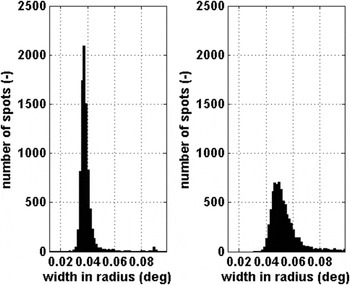
The smearing of diffraction spots from individual grains after irradiation has been observed by x-ray Laue micro-diffraction techniques Reference Mieszczynski, Kuri, Degueldre, Martin, Bertsch, Borca, Grolimund, Delafoy and Simoni23,Reference Specht, Walker and Liu24 which are similar, but distinct from HEDM. In these studies, changes in the state of the materials due to irradiation were observed in the limited number of grains that these techniques can interrogate. In the present case, to quantitatively determine differences between the irradiated and control samples, results from two-dimensional Gaussian fits to individual diffraction spots were compiled for the two specimens for a statistically significant number of grains. Figures 10 and 11 show the histograms of the FWHM values in the radial (ρ) and azimuthal (η) directions. These figures show that the FWHM values from an irradiated sample are broader on average, and have a broader distribution, than those from the control sample, in both directions measured. This indicates that irradiation may have introduced significant modifications at the grain and subgrain scale. The accumulation of irradiation induced defects such as point defect, clusters, voids, and dislocation loops can contribute to such peak broadening or peak splitting. Reference Peisl25–Reference Hofmann, Keegan and Korsunsky28 Furthermore, irradiation-induced recrystallization Reference Vaidya and Ehrlich29,Reference Rest30 can also lead to the formation of subgrains, which would also increase the FWHM of the diffraction spots consistent with these observations.
The FWHM of the diffraction spots from Fe {111} and {200}, along η for the nonirradiated (left) and irradiated (right) samples.

The FWHM of the diffraction spots from Fe {111} and {200}, along ρ for the nonirradiated (left) and irradiated (right) samples.

IV. DISCUSSION
FF-HEDM and SAXS/WAXS are two distinct, but related, x-ray techniques which can reveal key aspects of nuclear-relevant materials. Both use high-energy x-rays to penetrate samples that are 1 mm or thicker and generate forward scattering which can be efficiently collected with area detectors. This provides a rich set of microstructural information on crystalline materials, even for low volume fraction phases.
In the case of the fine-grained materials like the ODS steels presented, grain-averaged (“powder”) SAXS/WAXS can be used to evaluate even nanophased materials, including their response to applied stress and temperature. When above a sufficient size such that size-induced broadening is not too dominant, WAXS information can be obtained even for minor phases, to evaluate intraphase composition (as in the case of Ti(C,N)) and strains. The ability to distinguish a nanophase using WAXS is a function of both its volume fraction and size-induced broadening. Here, we estimate the broadening by considering only the domain size effect (neglecting microstrain contributions): for 70 keV x-rays (λ = 0.0177 nm), the broadening α (in radians) for a feature size b (in nm) can be estimated by:
 $$\alpha = {{0.9\lambda } \over {b\cos \theta }}\quad {\rm{,}}$$
where the cos θ is approximately 1 for the experimental geometry used in this work. Reference Stokes and Wilson31 Instrumental broadening is assumed to be negligible. Using this equation, α is 1.6 × 10⁻³ radians for a feature size of 10 nm (an upper limit for the nanophased oxides given by the SAXS results). The FWHM values for Fe {211}, Fe {310}, and Ti(C,N) {111} peaks measured at room temperature are 4.1 × 10⁻⁴ radians, 5.1 × 10⁻⁴ radians, and 5.2 × 10⁻⁴ radians, respectively. These values are over four times larger than that anticipated for the nanophases with a 10 nm feature size. Furthermore, the volume fraction for the nanophase oxides is on the order of only 1% (0.3 wt% total Y2O3 added for alloying) and can be in amorphous state. Reference Hsiung, Tumey, Fluss, Serruys and Willaime32 These effects push the features like nanophases below the WAXS sensitivity limit of even high-flux synchrotron sources.
For smaller particles and clusters, SAXS provides the ability to capture features on the nanometer level. It should be noted that any inhomogeneous feature on this size-scale may be studied, with the sensitivity proportional to the feature volume and square of the electron-density contrast between the feature and average sample density. For this reason, voids and bubbles provide a particularly high contrast and may be studied at lower concentrations than equivalent amounts of (higher density) precipitate phases. Reference Pan, Wu, Mo, Chen, Almer, Ilavsky, Haeffner and Stubbins33,Reference Wang, Li and Almer34
The in situ loading results of SM12 from WAXS in Fig. 6 show the complex nature of the micromechanical stress state and its evolution with applied load. Figure 6(a) shows that the lattice strain measured along the loading direction for {211} and {310} in the Fe matrix shows an inflection at an applied stress of 230 MPa while the strain {111} in the Ti(C,N) phase does not. In fact, the {111} in the Ti(C,N) continues to increase steadily up until ∼280 MPa where the experiment was terminated. Meanwhile, in Fig. 6(b), the FWHM values of Fe {211} and Fe {310} again show a large inflection near 230 MPa while Ti(C,N) {111} remains constant. These inflection points in lattice strains and FWHM indicate that the Fe matrix has yielded. While the relative strength to stiffness ratios can lead to the stronger and stiffer phase to yield first in a multiphase material, Reference Wong and Dawson35 it is more likely that the state of stress in the Fe-matrix is reorienting to a yield vertex such that polyslip can occur. Reference Kocks36–Reference Ritz, Dawson and Marin38
The distinction between WAXS and HEDM methods lies in the ability to separate the individual spots on the diffraction patterns. This will in turn depend on the state of the material and the number of grains in the volume illuminated by x-ray crystallography of the material, fidelity of the instrument, and analysis software. For cubic materials as measured in this work, and the experimental approach utilized, HEDM can be used for up to approximately 10,000 grains, although changes in the state of the material induced by irradiation or applied plastic deformation can reduce this number significantly. It is also worthwhile to note that the WAXS setup used for the SAXS/WAXS measurements can be used for the FF-HEDM measurements, possibly pushing the upper limit even higher.
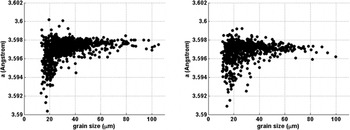
Unlike the “powder” WAXS method where grain-averaged data are collected, the FF-HEDM method preserves the spatial information and neighborhoods of the individual grains in an aggregate. This opens new opportunities for studying materials relevant to nuclear applications; the effect of irradiation can be investigated on a grain-by-grain basis and individual diffraction spots that belong to a particular grain. To illustrate this point, we examine lattice constants in more detail. Comparing the two states of HT-UPS, the powder pattern averages (Fig. 7) in the control and irradiated states are 3.597 Å and 3.595 Å, respectively, indicating a small but measurable change in the average microstructure. Using HEDM data, the lattice constants of the indexed grains can be plotted against the relative grain radii (Fig. 12) to reveal the distribution of lattice constants.
Lattice constant versus grain radii for control (left) and irradiated (right).

For the control sample, the distribution is relatively constant with radius, with some smaller grains showing some decrease. One possibility for this decrease is the presence of significant grain-boundary solute segregation, which has been observed in such alloys. Such segregation could shift average peak positions (due to intragrain compositional changes) preferentially in the smallest grains with highest grain boundary/bulk fractions. The distribution in lattice parameters in the irradiated sample is considerably broader and with a volume-weighted reduction in lattice parameter of ∼4.7 × 10⁻⁴ Å. This reduction is consistent with the powder-average results, providing a check on the overall statistics. While a full explanation of this result requires a detailed knowledge of the defect structures, which cannot be obtained by the x-ray techniques alone, some general points can be made. The reduction suggests that there is a substantial amount of vacancy types of defects present, and/or the average chemistry in the matrix has changed to decrease the lattice parameter, since a net accumulation of interstitial types of defects will expand the lattice. Reference Rest30,Reference Stoller, Walker, Specht, Nicholson, Barabash, Zschack and Ice39–Reference Spino and Papaioannou41 The variation among the grains suggests that the size, dislocation structure, and orientations of the grains could all matter for defect accumulation/recovery as well as for solute segregation in alloy systems under irradiation. Reference Song, Wu, Chen, Wang, Sun, Yu, Chen, Shao, Yang, Hartwig and Zhang42–Reference Han, Demkowicz, Mara, Fu, Sinha, Rollett, Wang, Carpenter, Beyerlein and Misra45 Further investigations, including measured grain orientations and direction-dependent broadening, are planned to investigate these possibilities more fully.
V. OUTLOOK
The data presented here illustrate how high-energy x-rays can be used to nondestructively study the nuclear energy-relevant materials on a wide-range of length scales; from mm down to µm in real-space and down to the atomic level in reciprocal space. The microstructural effects of irradiation can be studied in great detail. In particular, the grain-scale HEDM data provide an opportunity to reveal irradiation-induced defects in new ways. Unlike the WAXS method, the HEDM data are no longer subject to crystallographic fiber averages; spatial information about individual grains and their neighborhoods are preserved. For example, Figs. 10 and 11 illustrate that unlike the conventional line profile analysis commonly applied to WAXS data, Reference Williamson and Hall46–Reference Ungár and Borbély48 we can study the evolution of individual spots that belong to a particular grain to investigate the relationship between irradiation-induced damage in the grain and its crystallographic orientation or neighborhood. A promising approach would be developing forward-modeling approaches, in which a “virtual” sample is instantiated with a defined population of defects and defect types. Diffraction spots are then projected to the detector and compared with the measured results. Reference Wong, Park, Miller and Dawson49,Reference Obstalecki, Wong, Dawson and Miller50 This would in turn allow material models at such length scales to be examined and calibrated Reference Barton, Arsenlis and Marian51,Reference Lebensohn and Tomé52 so that prediction of bulk properties does not have to rely only on empirical correlations. Reference Dawson, Miller, Han and Bernier53,Reference Efstathiou, Boyce, Park, Lienert, Dawson and Miller54 Such a virtual sample can then be subjected to irradiation and/or thermo-mechanical loads, to further compare against experimental data as presented here.
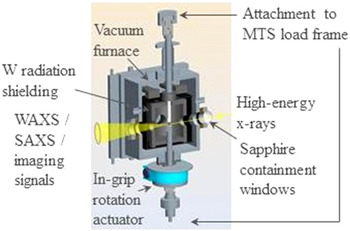
Finally, we note that the ability to apply these x-ray techniques in concert with in situ environments on irradiated samples is crucial if such an approach is to be undertaken. One example of such an approach is a thermo-mechanical setup shown in Fig. 13, developed at ANL. This device will allow for simultaneous loading up to 2.5 kN and temperatures to 1200 °C on irradiated samples, with an internal rotation mechanism to permit FF-HEDM and tomography experiments. After commissioning in 2015, it is anticipated that other users may use this device for their own experiments.
Schematic of an in situ thermo-mechanical environment for studying irradiated materials with high-energy x-ray techniques.

ACKNOWLEDGMENTS
The research was sponsored by the U.S. Department of Energy, Office of Nuclear Energy, for the Nuclear Energy Enabling Technology (NEET) Program under Contract No. DE-AC02-06CH11357. This research used resources of the Advanced Photon Source, a U.S. Department of Energy (DOE) Office of Science User Facility operated for the DOE Office of Science by Argonne National Laboratory under Contract No. DE-AC02-06CH11357. Neutron-irradiated specimens were provided by the ATR National Scientific User Facility (NSUF) at the Idaho National Laboratory (INL). The authors would like to thank Collin Knight, Brandon Miller, and James Cole at the ATR NSUF, INL. The authors also would like to thank Loren A. Knoblich, Jakub P. Dobrzynski, Yiren Chen at the Irradiated Materials Laboratory, Brent A. Finney at Special Materials, John Vacca at Health Physics, Environment, Safety, and Quality Assurance, APS Radioactive Sample Safety Review Committee at ANL. Erika Benda and Ali Mashayekhi at the APS, ANL are thanked for designing and fabricating the specimen holders for the irradiated TEM specimen.