1 Introduction
The first step in the phonological and phonetic analysis of any language is to determine its inventory of phonemes or contrastive units. For instance, the illustrations of the IPA published in JIPA typically start with the phonemic inventory of the language, before discussing aspects of distribution and phonetic realization. Instances where this is not a straightforward matter are thus of great theoretical and practical interest.
In some North American varieties of English, the diphthong /aɪ/ has developed two distinct variants [aɪ] and [ʌi], where the latter, more raised, variant is mostly found in stressed syllables before a voiceless consonant (Joos Reference Joos1942; Chambers Reference Chambers1973, Reference Chambers1989, Reference Chambers2006; Kilbury Reference Kilbury, Agard, Gerald, Adam and Makkai1983, among others). The two variants are in phonological contrast before a coronal flap [ɾ], where the realization of the diphthong appears to be conditioned by the underlying or phonological voicing of the following consonant, so that there is a higher diphthong before underlying /t/ even if it is produced as a voiced flap. Examples illustrating this distribution are given in (1):
-
(1) Idealized allophonic distribution
a. [ʌi] before a voiceless consonant: pipe, light, like, life, lice, writer [ɹʌiɾɚ]
b. [aɪ] elsewhere: bribe, side, dive, lies, lime, pine, buy, rider [ɹaɪɾɚ]
Although sometimes the phenomenon is described as one of contextually conditioned complementary distribution of allophones (see e.g. Farris-Trimble & Tessier Reference Farris-Trimble and Tessier2019), the situation is more complex, at least in some geographical varieties. The complication for the phonological analysis of the distribution is that the higher diphthong may also occur in additional contexts besides those illustrated in (1a). It has been reported that some speakers have [ʌi], in some words where a morpheme-internal flap corresponds to orthographic <d>, as in the words spider and cider, and also before word-final /r/ (e.g. fire [fʌiɚ], hire [hʌiɚ]), but not across a morpheme boundary (e.g. higher [haɪɚ]). The higher diphthong may also occur before some other voiced consonants in a rather unpredictable way and subject to much variation, e.g. in tiger (see Kilbury Reference Kilbury, Agard, Gerald, Adam and Makkai1983, Vance Reference Vance1987, Graham Reference Graham, Sasha, Paola, Marija and Paul2019, among others). Since, outside of the canonical contexts in (1a), the distribution of the higher diphthong is subject to inter-speaker variation and individual speakers may also be uncertain regarding the pronunciation of specific items, the situation may be described as a marginal contrast (Hualde, Luchkina & Eager Reference Hualde, Luchkina and Eager2017; see also Davis, Berkson & Strickler Reference Davis, Berkson and Strickler2020). Two phonological units, [aɪ] and [ʌi], are mostly in complementary distribution, but contrast with each other in one specific context (before a flap, for some speakers also before word-final /r/) and variably show unpredictability in a few specific lexical items. In perception, speakers are able to identify members of minimal pairs such as writer and rider with better than chance accuracy, but much less accurately than in the case of clearly contrasting segments (Hualde et al. Reference Hualde, Luchkina and Eager2017, Strickler Reference Strickler, Sasha, Paola, Marija and Paul2019). The two diphthongs are thus ‘just barely contrasting sounds’, in Goldsmith’s (Reference Goldsmith and Goldsmith1995) classification.
The raising of the nucleus of /aɪ/ and /aʊ/ before a voiceless consonant is usually referred to as ‘Canadian Raising’, after Chambers (Reference Chambers1973) (see also Chambers Reference Chambers1989, Reference Chambers2006), and the theoretical interest of this phenomenon for phonological analysis was first pointed out with respect to Canadian English by Joos (Reference Joos1942). However, this raising pattern was first described for eastern Virginia (Shewmake Reference Shewmake1925, Reference Shewmake1943)Footnote 1 and this phenomenon is also found in a number of varieties spoken in the US, especially in northern regions of the Midwest (Milroy Reference Milroy1996, Dailey-O’Cain Reference Dailey-O’Cain1997, Thomas Reference Thomas2000, Moreton & Thomas Reference Moreton, Thomas, Jennifer and Hualde2007, Rankinen Reference Rankinen2014, Berkson, Davis & Strickler Reference Berkson, Davis and Strickler2017, among others), but also in Philadelphia (Fruehwald Reference Fruehwald2013, Reference Fruehwald2016). A well-known case, described in Labov’s classic sociolinguistic study, is Martha’s Vineyard, Massachusetts (Labov Reference Labov1972). In many US varieties, including the one that we are studying in this paper, /aɪ/ undergoes raising but /aʊ/ does not.Footnote 2
Hualde et al. (Reference Hualde, Luchkina and Eager2017) conducted production and perception studies of /aɪ/-raising in Chicagoland (the name commonly given to the Chicago metropolitan area, including the city of Chicago and its suburbs). The production data were analyzed on the basis of formant measurements at two points: the point within the diphthong where F1 reaches its maximum, corresponding to the position of greatest aperture within the nucleus, and the point where F2 has its greatest value, which corresponds to the offset. Formant values at two points in the diphthong, one at the nucleus and one at the offglide, have also been used in other acoustic work on this topic (Moreton Reference Moreton2004, Moreton & Thomas Reference Moreton, Thomas, Jennifer and Hualde2007, Rosenfelder Reference Rosenfelder2007, Freuhwald Reference Fruehwald2016, Pycha & Dahan Reference Pycha and Dahan2016, Graham Reference Graham, Sasha, Paola, Marija and Paul2019).
Wieling (Reference Wieling2018) remarks that analyzing dynamic data such as diphthong formants on the basis of just two points may miss important aspects of the contrast of interest. Whereas taking formant measurements at only two chosen points in a diphthong is a sensible strategy given the statistical tools available for acoustic phonetic research until recently, the development of Generalized Additive Mixed Modeling (GAMM), allows the statistical comparison of full formant trajectories, which can potentially give us a much richer view of the contrast under study. A GAMM is a generalized linear model in which the dependent variable is modeled on a set of smooth functions of independent variables. (For details see Wood Reference Wood2017, Clark Reference Clark2019.)
In this paper, we use GAMM to reanalyze the acoustic data on /aɪ/-raising in Chicagoland that were analyzed in Hualde et al. (Reference Hualde, Luchkina and Eager2017), together with data from a larger set of additional speakers from the same demographic group, obtained using the same methodology, in order to establish a more robust empirical foundation for generalizations that may be made regarding acoustic differences across contexts. We consider to what extent these methodological improvements contribute to a better understanding of the /aɪ/-raising phenomenon.
It should be noted that, to the extent that the results obtained through the statistical analysis of full trajectories differ from those obtained from the comparison of formant values at only two points in the diphthong in Hualde et al. (Reference Hualde, Luchkina and Eager2017) in important respects, this would force us to question not only the interpretation of the results of that previous study (of a subset of the same data), but also that of much previous work on diphthongs based on only two points or even a single point. We also consider the issue of inter-speaker variation and different ways to classify speakers with respect to the phenomenon at hand. In the next section we compare GAMM with other methodologies that have been used in the analysis of diphthong dynamics.
2 Methodological considerations: Diphthong dynamics and statistical analysis. Why GAMM?
Analyses of differences between vowels and diphthongs based on measurements taken at only one or two points are common. This methodology was employed for the analysis of /aɪ/ in American English in Moreton (Reference Moreton2004), Moreton & Thomas (Reference Moreton, Thomas, Jennifer and Hualde2007), Rosenfelder (Reference Rosenfelder2007), Pycha & Dahan (Reference Pycha and Dahan2016) and Hualde et al. (Reference Hualde, Luchkina and Eager2017). However, more complex approaches are also found in the literature.
The importance of considering dynamic information for the accurate classification of English vowels, and especially diphthongs, has long been recognized (Zahorian & Jagharghi Reference Zahorian and Amir1993, Hillenbrand et al. Reference Hillenbrand, Getty, Clark and Wheeler1995, Watson & Harrington Reference Watson and Harrington1999, Hillenbrand, Clark & Neary Reference Hillenbrand, Clark and Nearey2001, among others). For instance, Watson & Harrington (Reference Watson and Harrington1999) demonstrate that an analysis based on discrete cosine transform coefficients of formant trajectories results in a better classification of several vowels in Australian English than an analysis based on vowel targets and duration. What GAMM analysis adds is the possibility of determining where exactly in their formant trajectories two vowels or diphthongs differ from each other in a statistically significant way, and what the magnitude of this difference is at different points in the trajectories.
Some studies on English vowels and diphthongs over the last decade or so have considered measurements taken at more than two points. In particular Fox & Jacewicz (Reference Fox and Jacewicz2009) and Jacewicz, Fox & Salmons (Reference Jacewicz, Fox and Salmons2011) measure five points at 20%, 35%, 50%, 65% and 80% of F1 and F2. This allows for a much better visualization of differences in formant trajectories than with only two points. For statistical comparison (ANOVA), however, they reduce the number of values per token using several techniques. One such technique is what they call trajectory length (TL). To calculate TL, a single data point per vowel or diphthong token is obtained by calculating differences in Euclidean distances in the F1 by F2 plane between two adjacent points at which formant measurements were taken (i.e. 20%–35%, 35%–50%, 50%–65% and 65%–80%) and summing up the values.
Besides TL, Fox & Jacewicz (Reference Fox and Jacewicz2009) propose other additional techniques to assess dynamic variation in formants, which they refer to as vector length (VL) and spectral rate of change (ROC, which integrates TL and duration). Jacewicz et al. (Reference Jacewicz, Fox and Salmons2011), in addition to TL, use the F1 and F2 centroids, defined as the unweighted mean of all five measurements, for each of the two formants. They point out that, compared to a single value for each formant, taken approximately in the center of the vowel, the centroid takes into account spectral contributions at other points in the duration of the vowel.
Clearly, obtaining five points per formant is visually more informative of the dynamics of formant trajectories than having measurements at only two points. However, the reduction of differences to a single value per vowel or diphthong token that this method requires for statistical analysis does not give a clear sense of where the differences in formant trajectories may lie or what the magnitude of these differences may be at different points in time, although, to some extent, the combination of different calculations that Fox & Jacewicz (Reference Fox and Jacewicz2009) propose compensates for it. GAMM has the important advantage over this method in that it allows for a single higher-dimensional analysis that includes differences in both the magnitude of change and timing in formant trajectories.
Farrington, Kendall & Fridland (2018) use four different metrics to capture vowel dynamics. Three of them, trajectory length, vector length and spectral rate of change, are adapted from Fox & Jacewicz (Reference Fox and Jacewicz2009). To calculate TL, they take measurements at three points (vowel onset, midpoint and glide), instead of five, and, as in Fox & Jacewicz (Reference Fox and Jacewicz2009), VL is based only on two points. In addition, they introduce a new metric, Vector Angle, which offers a quantification of glide directionality. The inputs for this calculation are F1 and F2 values at vowel onset and offset. Whereas the authors show the usefulness of Vector Angle to compare the dynamics of different vowels or the same vowel in different dialects, the results of this measurement require interpretation. The authors find, for instance, that there is a difference in Vector Angle for /eɪ/ between speakers from the US South vs. West and conclude that ‘it is likely related to a lowered and retracted nucleus’ (Farrington et al. 2018: 213). A GAMM allows a more direct analysis of differences in timing and magnitude of formant change in original units, thus making the interpretation of the results more straightforward.
Related to the specific diphthong that is the focus of this paper, in Berkson et al.’s (Reference Berkson, Davis and Strickler2017) analysis of /aɪ/-raising in Indiana, full formant trajectories are also considered for visual examination, but without performing inferential statistics on them. Recently, Strelluf (Reference Strelluf2018: 136–155) applies trajectory length (as in Fox & Jacewicz Reference Fox and Jacewicz2009) to study /aɪ/ monophthongization in Kansas City English. In addition to calculating TL, he plots five-point trajectories for individual Kansas City speakers in order to determine possible Canadian Raising effects, but performs statistical analysis of only one point at the nucleus (in addition to carrying out regression analysis of TL).
A different approach is found in Koops (Reference Koops2010). In this study, the author extracted formant values at 100 equidistant points using Praat’s linear predictive coding (LPC) formant tracker, and used a script to model formant trajectories as polynomial equations with up to nine coefficients. Mean normalized formant trajectories were then plotted with 95% confidence intervals. In these plots, lack of overlap indicates statistical significance. This visualization is similar to that of GAMM, which also relies on 95% confidence interval plotting to determine where significant differences lie. However, GAMM is more flexible in that it does not constrain the researcher to a set number of polynomial coefficients. It also allows a more flexible random effects structure, compared to the method used in Koops (Reference Koops2010), which relied on multiple methods of formant normalization to compare across speakers.
We conclude that, at present, GAMM appears to be the most advanced statistical model for the statistical analysis of diphthongs. The fact that GAMM can appropriately handle time series data makes it an ideal technique for analyzing dynamic changes in diphthong formants. Recent work that applies GAMM to the study of English diphthong dynamics includes Cole & Strycharczuk (Reference Cole, Patrycja, Sasha, Paola, Marija and Paul2019), on diachronic changes in formant trajectories of diphthongs in price and mouth words in a variety of Southern British English, and Sóskuthy, Hay & Brand (Reference Sóskuthy, Hay, Brand, Sasha, Paola, Marija and Paul2019), on changes in the formant structure of the same two diphthongs in New Zealand English.
The remainder of this paper is organized as follows. In Sections 3 and 4, we present, respectively, the methodology and the results of our experiment on the realization of /aɪ/ preceding phonologically voiced vs. voiceless consonants in Chicagoland English. Finally, in Section 5, we compare our results with those of Hualde et al. (Reference Hualde, Luchkina and Eager2017) and discuss further consequences.
3 Method
3.1 Participants
We have analyzed production data from 58 speakers of American English from Illinois, including the data from the 17 speakers analyzed in Hualde et al. (Reference Hualde, Luchkina and Eager2017). All speakers were recruited among undergraduate students at the University of Illinois at Urbana-Champaign. The age range of the participants at the time of the recording was 18–22 years old. Forty-nine speakers were female and nine were male. We have excluded from the statistical analysis the data of five speakers whose speech could be expected to correspond to the central Illinois dialect, rather than that of the Chicago region, since both their place of birth and their place of residence fell outside of the Chicagoland area. Their formant data are nevertheless shown in the Appendix for comparison. The total number of speakers whose data have been included in the analysis to be presented in the body of this paper is thus 53 (43 female, 8 male). For this study, Chicagoland was defined as the area of Illinois north of Interstate Highway 80.Footnote 3
3.2 Production task
The production task was as in Hualde et al. (Reference Hualde, Luchkina and Eager2017). Participants performed a self-paced reading task. They were shown 145 sentences in Powerpoint, each on a separate screen, and were asked to read each sentence twice, wearing a head-mounted microphone. The target word always appeared on the same position in the sentence, towards the beginning. Two illustrative examples are given in (2), in which the target word is in boldface (the examples were the same as in Hualde et al. Reference Hualde, Luchkina and Eager2017 which may be consulted for the complete list):
-
(2) Examples of written stimuli
The word provided in English means ‘made available’
The word invite in English means ‘to request participation’
The list of target words that we have analyzed for this paper is the same as in Hualde et al. (Reference Hualde, Luchkina and Eager2017) and is given in (3). Notice that the consonant following the diphthong is always alveolar or postalveolar. Some words whose final consonant was labial (pipe) or velar (like) were also recorded, but have been excluded from the analysis to avoid effects on vowel formants due to differences in the place of articulation of the following consonant.
-
(3) /aɪ/ words
-
a. before /d/-flap: bider, biding, cider, collider, colliding, glider, insider, outsider, provided, provider, rider, riding, spider, tidal, wider (N = 15)
-
b. before /t/-flap: biter, biting, citing, copyrighted, copyrighter, delighted, fighter, fighting, ignited, ignitor, inciter, inviting, lighter, mighty, sighter, sighting, spiter, tighter, title, whiter, writer, writing (N = 22)
-
c. before a word-final voiced coronal obstruent: bide, bride, buys, eyes, hide, lies, oblige, ride, rise, side, slide, tide, wide, wise (N = 14)
-
d. before a word-final voiceless coronal obstruent: bite, bright, ice, incite, invite, kite, lice, nice, night, rice, cite, twice, vice (N = 13)
-
The contexts in (3a) and (3b) are ‘contexts of flapping’. In the English variety that our participants speak, flapping is essentially obligatory in these contexts in conversational speech. On the other hand, in the rather formal situation of reading a list of sentences containing minimal pairs in a laboratory while wearing a head-mounted microphone, it is likely that some participants may suppress flapping in at least some tokens of /t/. We will consider the possibility that /t/ and /d/ were not always neutralized in this context in the discussion of the results.
The list in (3a) includes the words cider and spider, which, as mentioned in Section 1, have been reported exceptionally to have the higher diphthong for some speakers in several varieties with /aɪ/-raising. Notice that, to the extent that for some of our speakers in our sample one or both of these words are exceptional in this way, this would result in a smaller difference between (3a) and (3b). In the analysis of the results we will also examine these two words separately to determine to what extent they are different from other words in the set.
As is well known, in English, vowels are considerably longer before voiced than before voiceless consonants, and this also results in differences in vowel quality (House & Fairbanks Reference House and Fairbanks1953, Raphael Reference Raphael1975, Raphael, Dorman & Liberman Reference Raphael, Dorman and Liberman1980). Differences in the realization of syllable nuclei before voiced and voiceless consonants are thus to some extent predictable and affect all vowels in English. For this reason, understanding the Canadian Raising phenomenon requires comparison of /aɪ/ with other diphthongs or vowels. As in Hualde et al. (Reference Hualde, Luchkina and Eager2017), for this comparison we consider the realization of the diphthongizing vowel /eɪ/, as perhaps the most comparable element in the vowel system of the language. We note, nevertheless, that the difference between the articulatory gestures of nucleus and offglide in this diphthongizing vowel is much smaller than for /aɪ/, which requires a dorsum-lowering gesture before its raising and fronting.
A smaller set of words containing the diphthongizing vowel /eɪ/ in all four relevant contexts was recorded and analyzed, in order to have a sense of possible contextually conditioned variation in the absence of any phonologization of the contrast. These words are listed in (4).
-
(4) /eɪ/ words
-
a. before /d/-flap: trader, trading, wading (N = 3)
-
b. before /t/-flap: traitor, waiter, waiting (N = 3)
-
c. before a word-final voiced coronal obstruent: bade, grade, made, trade, wade (N = 5)
-
d. before a word-final voiceless coronal obstruent: bait, great, mate, trait, wait (N = 5)
-
For /eɪ/, any differences in formant trajectories between the contexts in (4c) and (4d) could be assumed to be a purely phonetic consequence of differences in duration between tokens preceding voiced vs. voiceless obstruents. On the other hand, no differences are expected between the two pre-flap contexts (4a) and (4b) to the extent that the consonants are actually neutralized. That is, words like wading and waiting are expected to be true homophones when the intervocalic stop is flapped. If any differences are found, these would most likely be due to incomplete neutralization between /d/ and /t/ in the experiment.
For the interpretation of the results, the fact that the data are from a reading task and not from naturalistic interaction should obviously be taken into account. Nevertheless, it should be noted that the raising of /aɪ/ does not appear to be either prestigious or stigmatized for speakers of this variety. It is not something of which most speakers appear to be aware, unlike some other aspects of variation in vowels that are identified with a ‘Chicago accent’ in popular perception.
3.3 Acoustic analysis
The target word and, within it, the target diphthong or diphthongized vowel were manually segmented on two separate tiers in Praat (Boersma & Weenink Reference Boersma and Weenink2019). For formant extraction, the default values in Praat for female and male speakers were used.
Within each segmented token of /aɪ/ or /eɪ/, we extracted F1 and F2 values at 20 equally spaced points with a script in R (R Core Team 2018). Spacing was done relative to each interval’s duration, so that we could do comparisons of temporally dependent landmarks across conditions. Formant values were obtained by interfacing between R and Praat, using functions from the phonTools (Barreda Reference Barreda2015), PraatR (Albin Reference Albin2014) and rPraat (Bořil & Skarnitzl Reference Bořil, Radek, Petr, Ales, Ivan and Karel2016) packages. Duration values from vowel onset of offset were also obtained.
3.4 Statistical analysis
For the statistical analysis of the formant data, we utilize GAMM, a non-linear regression method. As was discussed in Section 2, GAMM has certain advantages over statistical analysis methods traditionally used for phonological research on vowel formants and other dynamic elements, as these methods generally reduce time-varying spectral changes down to a single point. GAMM is a flexible modeling method that allows analysis of patterns seen in time-dynamic trajectories (Wieling Reference Wieling2018). In this study, we applied separate GAMMs to analyze the time-dynamic trajectories of F1 and F2.
Following the methods in Wieling (Reference Wieling2018), a series of GAMMs of increasing complexity were built by adding effects sequentially and compared using Akaike Information Criterion (AIC) values. We chose the model with the lowest AIC, as is common with model comparison. Models were built using the mgcv package (Wood Reference Wood2011, Reference Wood2017) in R. In both the cases of F1 and F2, the most complex models produced the lowest AIC values, and are therefore presented in this paper. The final models included a parametric main effect of following condition (i.e. whether the consonant following the diphthong is a d-flap – that is /d/ in the context of flapping – a t-flap, another voiced consonant or a voiceless consonant), a smooth over normalized duration by following condition, a factor smooth for following condition over the random effect of speaker, and a factor smooth for following condition over the random effect of word. An AR(1) term (an autoregressive parameter of lag 1) was included to account for autocorrelation. The value of this term was calculated using the acf_resid() function from the itsadug package (van Rij et al. Reference van Rij, Wieling, Baayen and van Rijn2017). The data was ordered using the start_event() function from the itsadug package.
Regarding the diphthong /aɪ/, we are interested in two comparisons. First, we compare the realization of /aɪ/ before a word-final voiced vs. voiceless consonant (items in (3c) vs. (3d) in Section 3.2 above). Secondly, we compare the production of /aɪ/ before /d/ and /t/ in the context of flapping ((3a) vs. (3b) above). This second comparison involves contexts where flapping of /d/ and /t/ is expected. We have not attempted to separate tokens where the contrast between /t/ and /d/ had not been completely neutralized. We will consider this point later in the analysis of the results.
The formant data were not normalized, as the GAMM is able to analyze the data in its original units (Hz). The use of the random factor smooths allows for the model to take into account time-dynamic differences in a range of values across speakers. These random factors account for individual differences in the trajectory and amplitude of differences in formants when determining the overarching patterns in the data. Because of this, any normalization done for the purpose of accounting for physiological differences is unnecessary.
4 Results
Although the main focus of this paper is on formant analysis, we report on duration differences first for completeness.
4.1 Duration
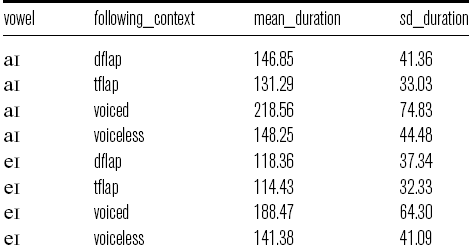
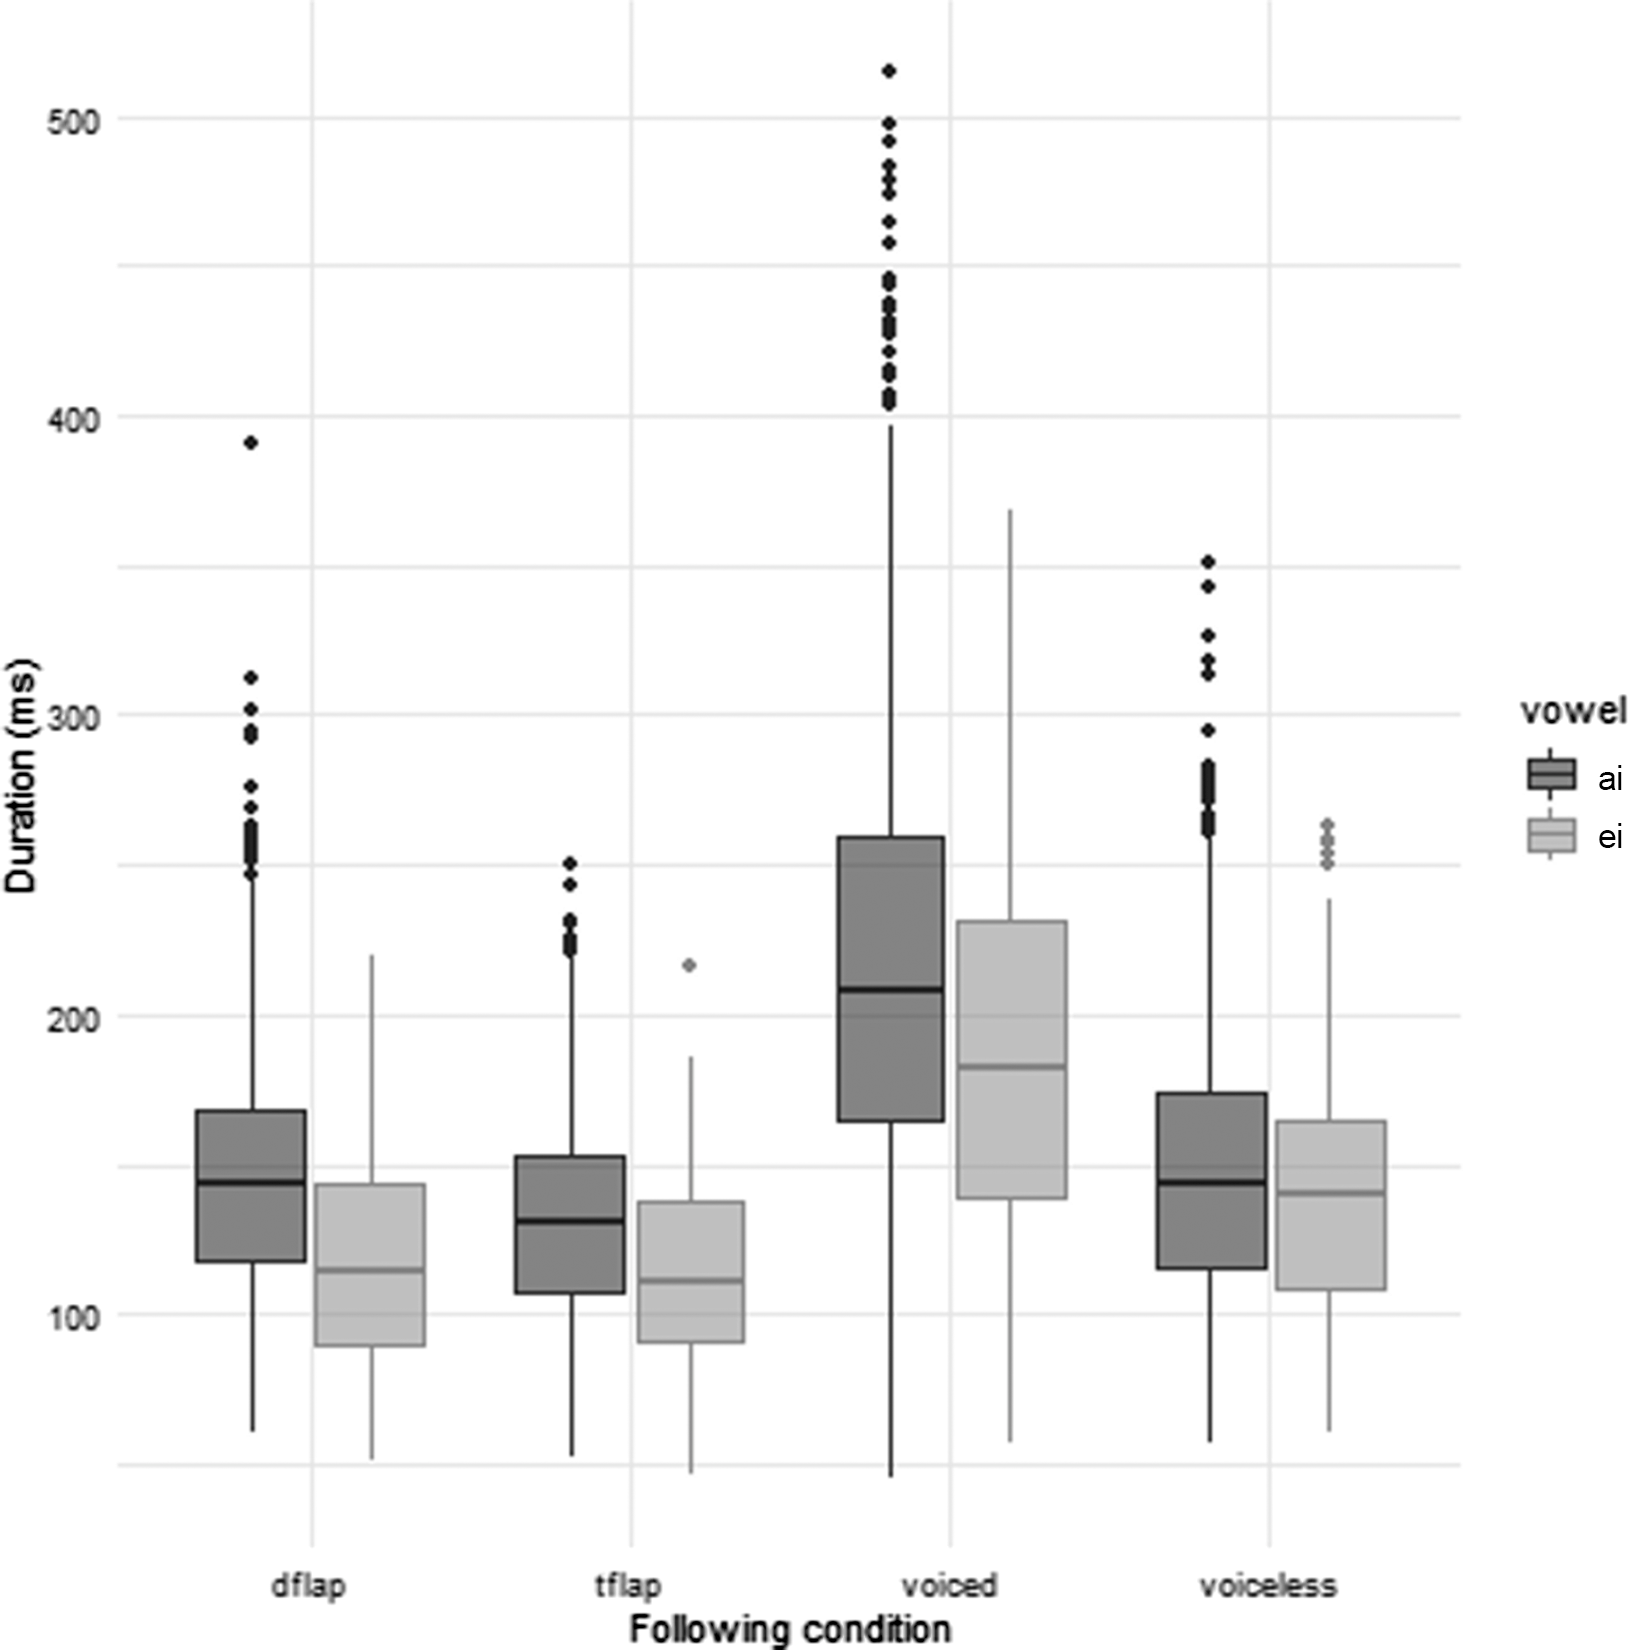
The duration of the segmented tokens of /aɪ/ and /eɪ/ separated by following context is shown in Table 1, where mean and standard deviation in ms are reported. The distribution of duration values is presented in boxplots in Figure 1.
Comparing /aɪ/ and /eɪ/ first, we may notice that /aɪ/ tends to be longer that /eɪ/, but the difference is very small before a word-final voiceless consonant. It is well known that lower vowels tend to be longer than higher ones (Peterson & Lehiste Reference Peterson and Lehiste1960). In addition, the longer duration of the diphthong /aɪ/ may also result from a longer trajectory in vowel space. Across conditions, both /aɪ/ and /eɪ/ are longest before a word-final voiced consonant and the longest diphthong is /aɪ/ in this context.
The small difference between /aɪ/ and /eɪ/ in the context before a voiceless consonant may be taken as an indication of the raising of /aɪ/ in this context.
For both /aɪ/ and /eɪ/ we find the same order regarding the effect of the following contexts. From longest to shortest, diphthong duration by following context is ordered in the following ranking: voiced > voiceless > dflap > tflap (although for /eɪ/ the difference between the two pre-flap contexts is very small).
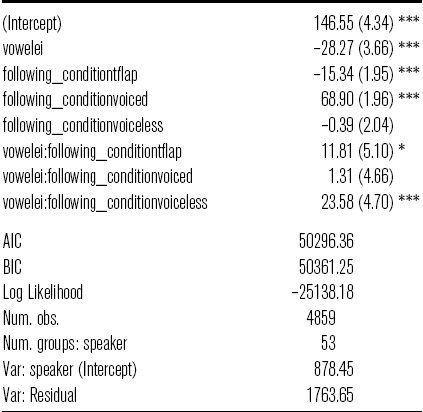
To determine statistical significance, we ran a mixed effects regression analysis, using the function lmer, in the package lme4 (Bates et al. Reference Bates, Maechler, Bolker and Walker2015) and with p-values obtained with the Satterthwaite approximation in lmerTest (Kuznetsova et al. Reference Kuznetsova, Brockhoff and Christensen2017). In this analysis, duration in ms was entered as the dependent variable, the interaction between vowel (/aɪ/ or /eɪ/) and following context (voiceless, voiced, tflap, dflap) as independent variable, and speaker as random factor (random intercept). The output of the model is shown in Table 2.
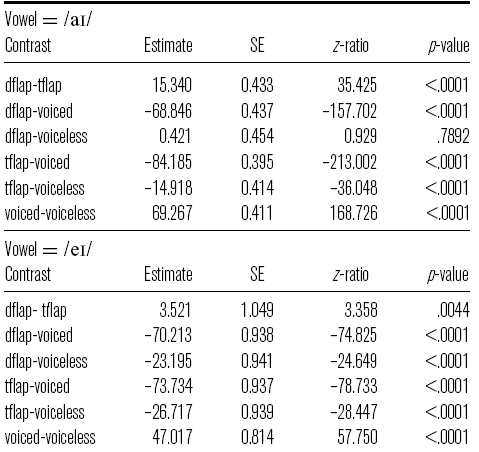
The model shows a significant effect of vowel (/aɪ/ vs. /eɪ/) and following context, for both vowels. Pairwise comparisons using the emmeans package (Lenth Reference Lenth2019), reported in Table 3, show that the diphthong /aɪ/ is significantly longer before word-final voiced consonants than before voiceless consonants (estimate 69.27 ms, p < .0001) and also preceding d-flap than t-flap (estimate 15.34 ms, p < .0001). A significant difference in vowel duration is also found for /eɪ/ when the two word-final contexts are compared (estimate 47 ms, p < .0001), but not in the comparison between the d-flap and t-flap conditions. Our results are compatible with those in Hualde et al. (Reference Hualde, Luchkina and Eager2017) for a smaller dataset, although in that paper inferential statistics were performed separately for /aɪ/ and /eɪ/.
Duration in ms by following context, mean and standard deviation.

Boxplots of duration in ms of /aɪ/ and /eɪ/ by following context. The thick horizontal line within each box is the median.

To summarize this section, for both /aɪ/ and /eɪ/ a following word-final voiced consonant conditions greater duration than a following voiceless consonant, but the difference between these two contexts is of a greater magnitude for /aɪ/. Comparing the contexts of flapping, a small but significant difference was found for /aɪ/ but not for /eɪ/. These results are compatible with greater context-conditioned allophonic differentiation for /aɪ/ than for /eɪ/.
Results of lmer on duration.

*** p <.001, ** p <.01, * p <.05
Pairwise comparisons of durations of tokens before d-flaps, t-flaps, other voiced consonants and other voiceless consonants, separately for /aɪ/ and /eɪ/.

4.2 Average formant trajectories
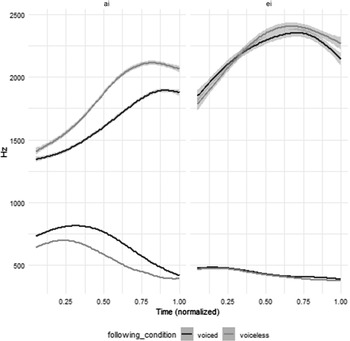
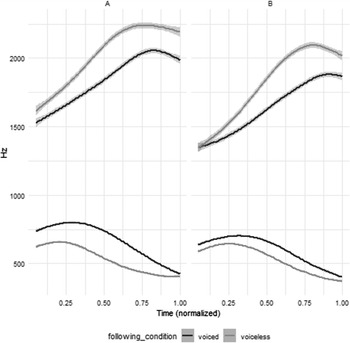
Figure 2 shows average F1 and F2 contours and confidence intervals for /aɪ/ (left panel) and /eɪ/ (right panel) before voiced vs. voiceless (post)alveolar consonants for 53 participants. As can be observed, the formant trajectories for /aɪ/ differ markedly between the two contexts. Before a voiceless consonant F1 is substantially lower in the first half of the diphthong, indicating a raised nucleus [ʌ] in this context. There is also a noticeable difference in F2 towards the end of the trajectory, which suggests a more fronted or extreme articulation of the offglide in the voiceless context. For /eɪ/, on the other hand, the differences between average realizations before voiced and voiceless consonant are much smaller or non-existent. Observation of Figure 2 shows that /aɪ/ has developed quite distinct contextually conditioned allophones. It seems appropriate to use the transcriptions [ʌi] vs. [aɪ], where different phonetic symbols are used for both nucleus and offglide, to indicate that there is a difference in the quality of both. This is not the case for /eɪ/. Notice, nevertheless, that Figures 2–4 are for data display purposes, not actual models. We are not drawing inferential conclusions from them.
Average F1 and F2 contours for /aɪ/ (left panel) and /eɪ/ (right panel) before voiced vs. voiceless consonants (53 speakers). The darker lines represent average values and the lighter ribbons are confidence intervals.

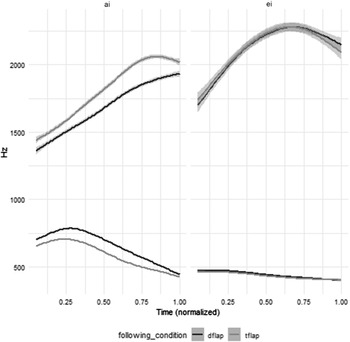
Average F1 and F2 contours for /aɪ/ (left panel) and /eɪ/ (right panel) before /d/ and /t/ in the context of the flapping rule (53 speakers).

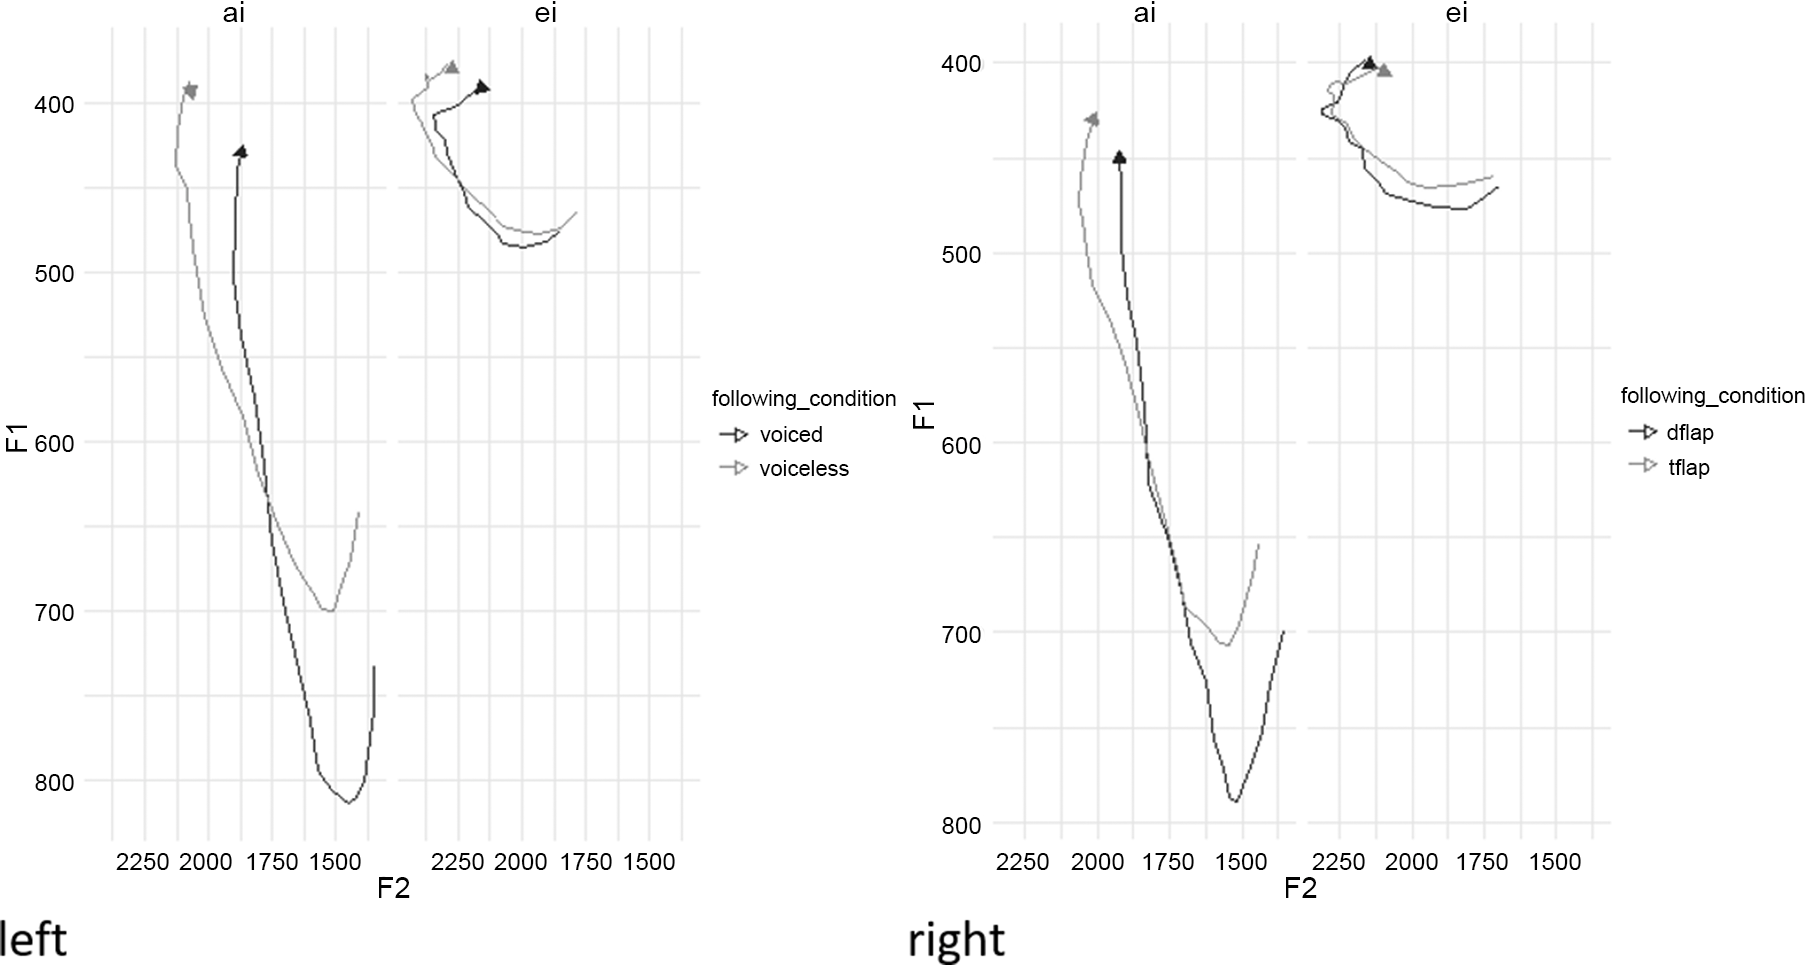
/aɪ/ and /eɪ/ plotted in the F1 by F2 plane. Left panel: tokens before word-final consonants. Right panel: tokens in flapping contexts. The arrow indicates the direction of the movement.

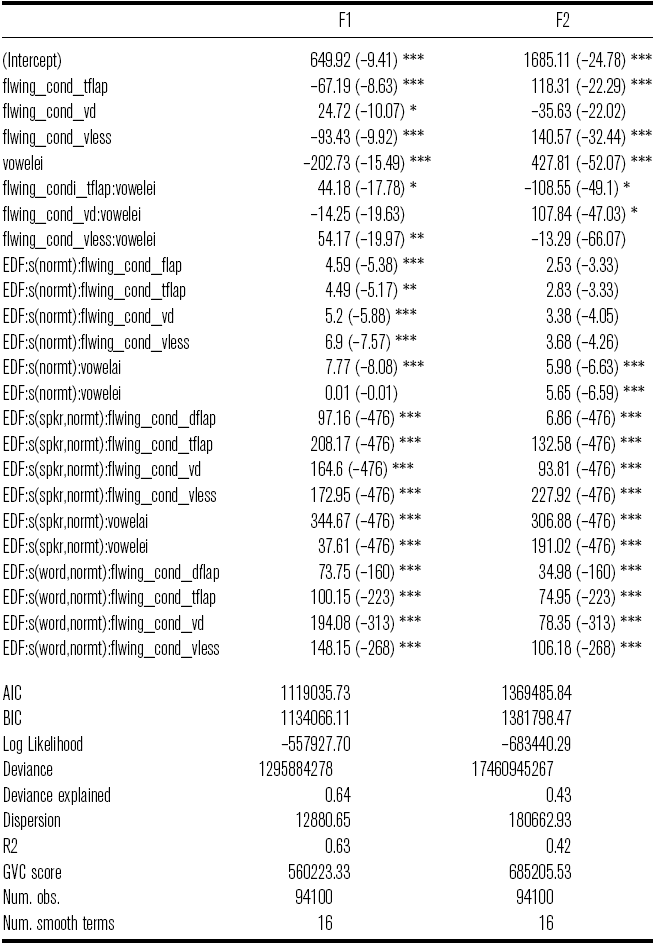
Results of GAMMs for F1 and F2. Formula. Formant∼following_condition*vowel+ s(normtime, by = following_condition) + s(normtime, by = vowel) + s(speaker, normtime, by = following_condition, bs=“fs”, m=1) + s(speaker, normtime, by = vowel, bs=“fs”, m=1)+ s(word, normtime, by = following_condition, bs=“fs”, m=1)

*** p <.001, ** p <.01, * p <.05
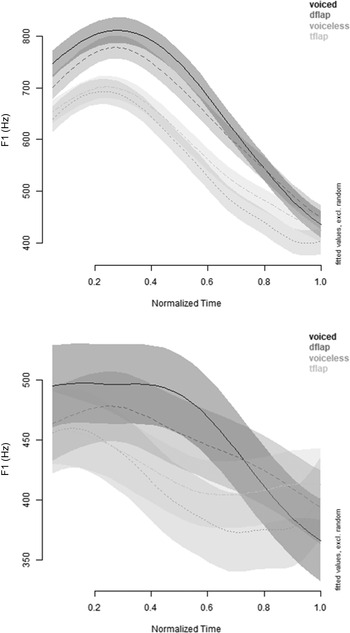
Results of GAMM analysis of F1 trajectories by following context for /aɪ/ (top) and /eɪ/ (bottom). The x-axis represents normalized time, and the y-axis F1 values in Hz. The dark lines are fitted average values of the models and the ribbons around them are confidence values. Lack of overlap in confidence intervals indicates significant differences.

We turn now to the comparison of pre-flap contexts. Figure 3 illustrates the difference between realizations of /aɪ/ and /eɪ/ before /t/ vs. /d/ in the context of flapping. In general, the facts for /aɪ/ are as in Figure 2, but with a smaller difference between the two contexts. For /eɪ/ there is no visible difference in formant trajectories in the two contexts.
Notice that the change in F1 within the entire duration of the segment is much greater for /aɪ/ than for /eɪ/, which should be taken into account in the interpretation of the statistical results. To make this difference visually clear, in Figure 4, mean movement contours for /aɪ/ and /eɪ/ (20 points per token) are plotted in F1 by F2 space.
To determine statistical significance in the differences across contexts shown by the visual inspection of the raw data, GAMMs with the structure outlined in Section 3.4 were run for both F1 and F2. As already mentioned, the data were not normalized, as the GAMM is able to analyze the data in its original units (Hz). The use of the random factor smooths allows for the model to take into account time-dynamic differences in a range of values across speakers, in order to determine the overarching patterns in the data, thus rendering normalization unnecessary. Table 4 shows the results of these models. Overall there were significant parametric differences for both t-flap and voiceless alveolar stops, compared to d-flap.
We show the output of the statistical models in figures. This output is different from the raw average values in Figures 2 and 3. All figures are produced for the fixed effects of following condition over time, cancelling out the random effects of speaker and word. Figure 5 shows the first formant trajectory for /aɪ/ (top) and /eɪ/ (bottom), across all four following conditions being compared. The figures show confidence intervals in ribbons around the mean. Lack of overlap can be interpreted as the trajectories being significantly different. As shown, for /aɪ/, there is a clear difference between vowels preceding consonants that are voiced (voiced stops and d-flap) and phonologically voiceless (voiceless stops and t-flap). Vowels preceding voiceless stops and t-flap show lower F1, particularly during the first half of their durations, indicating raising of the nucleus to [ʌ]. For /eɪ/, while there are differences in the shape of these formant trajectories across contexts, and these are generally consistent with those obervable for /aɪ/, there is more variation (indicated by the relative size of the confidence intervals). Furthermore, many of the confidence intervals overlap, indicating that significant differences are not present for /eɪ/. Notice that the scale on the y-axis is much larger for /aɪ/ than for /eɪ/, since the size of the F1 movement is much greater for /aɪ/ (as shown in Figure 4).
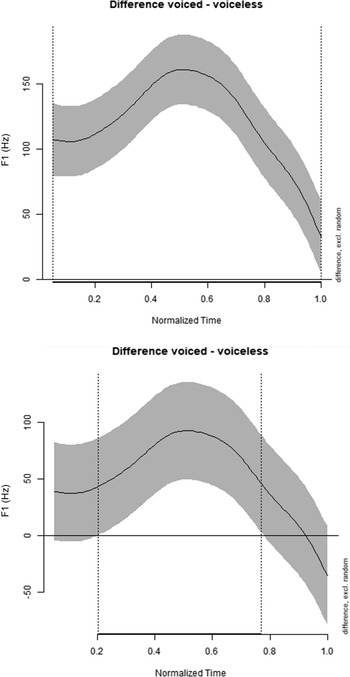
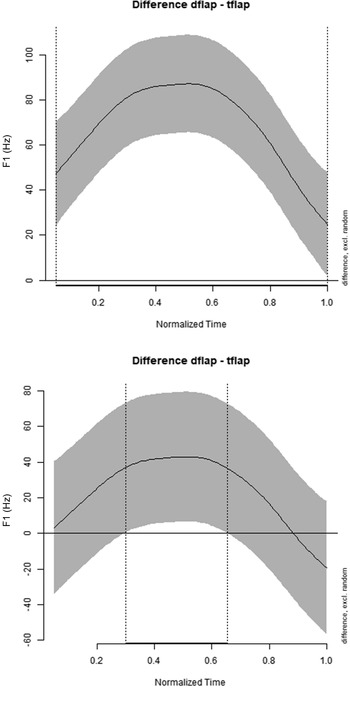
The magnitude of the differences in Figure 5 are seen in Figures 6 and 7, which show the non-linear difference between the conditions across time. Figure 6 shows the vowels preceding word-final voiced and voiceless stops, and Figure 7 shows the comparison between diphthong trajectories before /d/ and /t/ in the contexts of flapping.
Starting with diphthongs before a word-final consonant (Figure 6), for /aɪ/, the difference between trajectories in the two contexts persists across the entirety of the diphthongs’ normalized durations (as indicated by the thick line on the x-axis). For /eɪ/, a difference is found in only in the medial section of the vowel, and is much smaller than that for /aɪ/, with an average maximum magnitude of 100 Hz difference, as opposed to a 160 Hz difference for /aɪ/. For both vowels, the maximum difference is around the 40% mark in normalized duration.
This difference is also seen in the comparisons of the two pre-flap conditions (Figure 7), where /aɪ/ shows a much larger maximum difference compared to /eɪ/ (80 Hz for /aɪ/ vs. 30 Hz for /eɪ/). A significant difference is found across the whole trajectory for /aɪ/, but only in a small central region for /eɪ/.
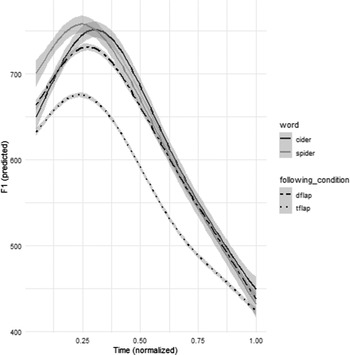
Our set of stimuli for the d-flap context contains two monomorphemic words cider and spider, which have been reported exceptionally to have the higher diphthong [ʌi] in some Canadian Raising varieties. To test the possibility that these words may be exceptional for our speakers as well, we have plotted formant trajectories for cider and spider separately from all other d-flap and t-flap words. As the F1 trajectories in Figure 8 show, for our speakers these two words turn out not to be exceptional undergoers of raising and behave together with d-flap words, rather than with t-flap words.
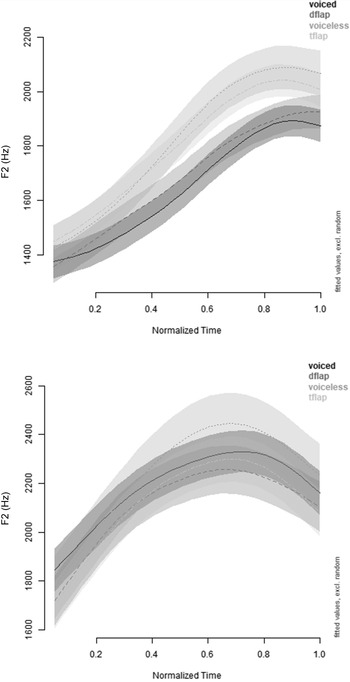
Regarding second formant trajectories now, Figure 9 shows F2 trajectories for /aɪ/ (left) and /eɪ/ (right), across all four following conditions. As shown for /aɪ/, there is a clear difference between vowels preceding consonants that are voiced (voiced stops and d-flap) vs. voiceless (voiceless stops and t-flap). In this case, vowels preceding voiceless segments show higher F2, particularly during the second half of their durations. For /eɪ/, while there are slight differences in the general shape of these formant trajectories, there is more variation (indicated by the relative size of the confidence intervals). Furthermore, the intervals overlap, indicating that a significant difference is not present.
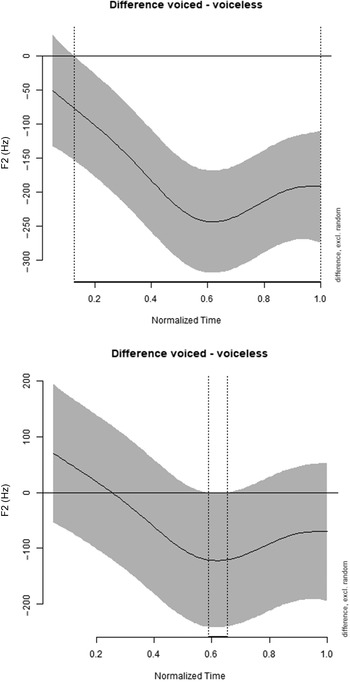
The magnitude of the differences in F2 across contexts can be seen in Figures 10 and 11, which show the non-linear difference between the conditions across time. Considering the difference in F2 trajectories before word-final voiced and voiceless consonants first (Figure 10), for /aɪ/, the difference can be seen to persist across the entirety of the diphthongs’ normalized durations (as indicated by the thick line on the x-axis). For /eɪ/, instead, a significant difference between the two contexts is found only in a very small portion of the trajectory, about the 60% mark.
Difference in F1 trajectories contexts preceding for word-final voiced vs. voiceless consonants for /aɪ/ (top) and /eɪ/ (bottom). The x-axis represents normalized time. The magnitude of the difference at a given point can be read on the y-axis. The thick line on the x-axis indicates the portion of the trajectory where a significant difference between the two contexts is found.

Difference in F1 trajectories in the d-flap and t-flap contexts for /aɪ/ (top) and /eɪ/ (bottom). The x-axis represents normalized time. The magnitude of the difference at a given point can be read on the y-axis. The thick line on the x-axis indicates the portion of the trajectory where a significant difference between the two contexts is found.

F1 trajectories of cider and spider compared to other d-flap and t-flap words.

Results of GAMM analysis of F2 trajectories by following context for /aɪ/ (top) and /eɪ/ (bottom). The x-axis represents normalized time, and the y-axis F1 values in Hz (normalized). Confidence intervals around the mean are shown in a lighter color. Lack of overlap in confidence intervals indicates significant differences.

Difference in F2 trajectories in contexts preceding word-final voiced vs. voiceless consonants for /aɪ/ (top) and /eɪ/ (bottom). The x-axis represents normalized time. The magnitude of the difference at a given point can be read on the y-axis. The thick line on the x-axis indicates the portion of the trajectory where a significant difference between the two contexts is found.

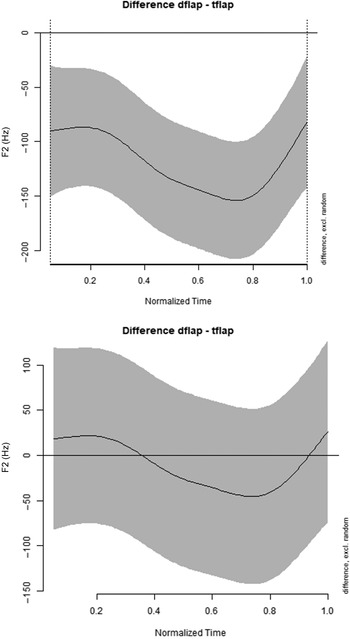
Difference in F2 trajectories in the d-flap and t-flap contexts for /aɪ/ (top) and /eɪ/ (bottom). The x-axis represents normalized time. The magnitude of the difference at a given point can be read on the y-axis. The thick line on the x-axis indicates the portion of the trajectory where a significant difference between the two contexts is found.

As for the pre-flap contexts (Figure 11), the results are rather different for /aɪ/ and /eɪ/. For /aɪ/ there is a significant difference between diphthongs preceding d-flaps and t-flaps across the entire trajectory. For /eɪ/, instead, no difference was found at all.
A question that arises regarding the realization of /aɪ/ in flapping contexts is whether /d/ and /t/ are completely neutralized in the flapping context in our experimental data. Whereas flapping in this context is virtually obligatory in conversational speech in this English variety, the style that we are testing in our study may be described as careful reading style, where flapping is not obligatory. From visual and auditory inspection of the data, it appears that, although most consonants in this context were realized as flaps, some were not. Since lack of neutralization between /d/ and /t/ may be manifested in differences in voicing, for d-flap and t-flap words, we have measured voicing using the ‘unvoiced frames’ report in Praat, in a 100 ms interval starting at the end of the diphthong. A linear mixed effects regression on the results, with the interaction between vowel type (/aɪ/ vs. /eɪ/) and consonant type (/d/ vs. /t/) as fixed effect and speaker as random effect returns a significant effect of consonant type, with /t/ conditioning greater devoicing than /d/ (p < .01). There was also an effect of vowel type, but only for d-flap words, /d/ following /aɪ/ showing less voicing than following /eɪ/ in this particular context. Given these results, we cannot exclude the possibility that some differences in formant values in flapping contexts may be due to incomplete neutralization between the following two consonants. Nevertheless, differences in formant values between the two flapping contexts are much larger for /aɪ/ than for /eɪ/, which is consistent with phonologization of the two allophonic variants [aɪ] and [ʌi].
To summarize this section: using GAMMs, we have compared F1 and F2 trajectories for /aɪ/ and /eɪ/ in four contexts: before a word-final voiced obstruent, before a word-final voiceless obstruent, before d-flap and before t-flap. For /aɪ/ the results of the analysis show that formant structures are significantly different across the entire F1 and F2 trajectory in the context before word-final voiceless consonants and t-flap, on the one hand, and before d-flap and word-final voiced consonants, on the other. For this group of speakers, as a whole, there are thus two distinct contextual variants of /aɪ/, a higher variant [ʌi] before voiceless consonants, including underlying /t/ in the context of flapping, and a lower variant [aɪ] in other contexts. Comparison with /eɪ/ has shown that the differences that are found are not reducible to a phonetic contextual effect. For the diphthongizing vowel /eɪ/, we found differences of much smaller magnitude for F1, in the central portion of the trajectory, and essentially no differences in F2. In Section 5 we will consider how these results compare to those in Hualde et al. (Reference Hualde, Luchkina and Eager2017).
In this section, we have reported on overall trends for all 53 Chicagoland speakers. All speakers in our sample, in fact, show the same trend, with a lower F1 (a higher vowel) before voiceless than before voiced consonants. Regarding F2, the general tendency is for F2 to be higher (more fronted) before voiceless consonants. There are, however, differences in the magnitude of these differences. In the next section, we explore individual differences among speakers.
4.3 Inter-speaker variation
Previous work on the phenomenon of Canadian Raising has remarked on the existence of individual variation. To get a sense of variation within our group of speakers, we implemented a k-means clustering analysis on three-dimensional longitudinal data using the kml3d package (Genolini et al. Reference Genolini, Alacoque, Sentenac and Arnaud2015) in R. The kml3d package is an extension of the kml package, which was designed to do cluster analysis on time-series and longitudinal data. The kml3d package allows clustering joint trajectories, so a multidimensional time-series clustering analysis is possible. The package includes tests to determine an ideal number of clusters in addition to showing group membership. It is therefore very useful for looking at linguistic data, as it allows clustering of data based on time-dynamic phonetic variables on different scales (see Chodroff & Cole Reference Chodroff and Cole2019, Im, Hualde & Cole Reference Im, Hualde and Cole2020, for applications to prosodic data).
Cluster analysis was run for the diphthong /aɪ/ by averaging formant trajectory values by following condition and speaker, so each participant had a representative F1 and F2 trajectory for each of the experimental cases. Two clustering analyses were run: one with only average F1 trajectories, and one with F1 and F2 trajectories. In both of these cases, separate clustering analyses were run for the voiced/voiceless stops conditions, and the d-flap/t-flap conditions, in order to determine whether similar groupings are obtained. For all analyses, clustering was done for two groups, to reflect the raiser/non-raiser distinction.
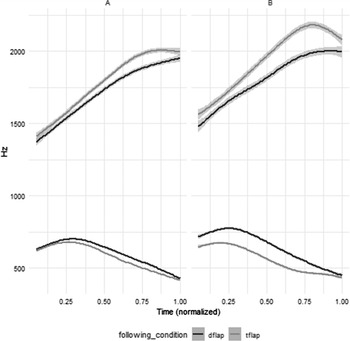
For the voiced/voiceless contexts, cluster analysis in kml3d based on F1 trajectories split the participant pool into groups of 31 (30 female, one male) and 22 speakers (15 female, seven male), respectively. Inspecting the two groups’ formant trajectories shows the first group as having a larger difference between /aɪ/ preceding voiced and voiceless segments, compared to the second group. Including both the F1 and F2 data shows a split into groups of 36 (33 female, three male; Group A) and 17 (12 female, five male; Group B) speakers, with Group A participants showing a larger distinction between conditions (in both F1 and F2; see Figure 12). This results in 90.6% agreement between the two methods, indicating that both F1 and F2 trajectories affect classification into the ‘raiser’ category.
F1 and F2 trajectories of /aɪ/ before voiced vs. voiceless consonants of our speakers split in two clusters taking into account both formants. Group A (larger difference) includes 36 speakers and Group B (smaller difference) includes 17 speakers.

F1 and F2 trajectories of /aɪ/ before d-flap and t-flap of our speakers split in two clusters taking into account both formants. Group B (larger difference) includes 31 speakers and Group A (smaller difference) includes 22 speakers.

For the d-flap/t-flap contexts, the F1 trajectories split the participant pool into groups of 27 (22 female, five male) and 26 (23 female, three male) speakers, respectively. Inspecting the two groups’ formant trajectories shows the first group as having a larger difference between /aɪ/ preceding d-flap and t-flap, compared to the second group. Including the F1 and F2 data shows a split into groups of 31 and 22 (22 female, one male), with the 31 participants (24 female, seven male) showing a larger distinction between conditions. Again, this distinction occurs in both the F1 and F2 trajectories; see Figure 13. This results in 92.5% agreement between the two methods.
Other studies have used a certain difference in nucleus F1 between contexts for determining the presence of Canadian Raising in the speech of an individual. In particular, Labov, Ash & Boberg (Reference Labov, Ash and Boberg2006: 206) take an F1 difference of 60 Hz or more in the nucleus of the diphthong between diphthongs before voiceless contexts vs. other contexts to be indicative of phonologization of raising (see also Rankinen Reference Rankinen2014, Berkson et al. Reference Berkson, Davis and Strickler2017, Strelluf Reference Strelluf2018). Classification of speakers as ‘raisers’ using Labov et al.’s (Reference Labov, Ash and Boberg2006) criterion is based on normalized formant values, reconverted to Hz.
We cannot apply Labov et al.’s (Reference Labov, Ash and Boberg2006) method directly, since we have analyzed data only for two vowels, which prevents us from using normalization based on speakers’ vowel space. With this caveat, applying the criterion of whether the difference in F1 between contexts is greater than 60 Hz to our unnormalized data, 46 out of 53 speakers in our sample show evidence of Canadian Raising before a word-final voiceless consonant (compared to the context before a voiced consonant), and 33 of 53 speakers also before /t/ (vs. /d/) in the context of flapping. Using this criterion, then, most, but not all, of our speakers are ‘raisers’ in the transparent context and a smaller majority have phonologized the contrast in the opaque context created by flapping. Nevertheless, it should be noticed that some speakers who show only a small difference in F1 when measured as a single point in the trajectory may have a larger formant difference at a different point or may implement the difference in F2.
5 Discussion and conclusion
Using Generalized Additive Modeling analysis, we have shown that 53 speakers of Chicago English, taken as a group, produce /aɪ/ with significantly different formant trajectories preceding voiceless vs. voiced word-final consonants, and also preceding /t/ vs. /d/ in the context of flapping. In the pre-voiceless context (including /t/ in the context of flapping), F1 is lower and F2 is higher. For both formants, a statistical difference was found for the entire duration of the diphthong. The formant differences across contexts that are found for /aɪ/ are much larger than those for the diphthongal vowel /eɪ/, and thus cannot be explained as a purely phonetic effect (nevertheless, we note that the production of /aɪ/ requires a dorsum lowering gesture that is not present in /eɪ/).
Let us consider to what extent our results differ from those in Hualde et al. (Reference Hualde, Luchkina and Eager2017), based on measurements at only two points (and for a smaller number of speakers). In Hualde et al. it was found that:
-
A. In the comparison of tokens of /aɪ/ before word-final voiced vs. voiceless consonants, there was a significant difference in both F1 and F2 values at both points where measurements were taken: nucleus and offglide.
-
B. In the comparison of tokens of /aɪ/ before intervocalic /t/ vs. /d/ in the context of flapping, there was a significant difference in F1 at both points and in offglide F2 values, but not in nucleus F2 values.
On the other hand, from our GAMM analysis we conclude that:
-
A. Tokens of /aɪ/ before word-final voiced vs. voiceless consonants have significantly different F1 trajectories from onset to offset and in F2 trajectories from about 10% of the duration to offset.
-
B. Tokens of /aɪ/ before intervocalic /t/ vs. /d/ in the context of flapping have significantly differences in F1and F2 trajectories from onset to offset.
The findings of both studies are for the most part compatible. In Hualde et al. (Reference Hualde, Luchkina and Eager2017), statistical comparisons of F1 values returned significant differences at both points that were measured for both comparisons. Our analysis in this paper has shown that, indeed, the complete F1 trajectories are different when we compare the contexts before word-final voiced vs. voiceless consonants and also when we compare the contexts before d-flap vs. t-flap.
Some differences between the two studies emerge, however, in F2 comparisons. In Hualde et al. (Reference Hualde, Luchkina and Eager2017), no difference in nucleus F2 was found between the d-flap vs. t-flap contexts. In our GAMM analysis, however, F2 differences between these two contexts were found for the whole formant trajectories, although of a smaller magnitude than in the comparison between the two word-final contexts (which is also true for F1).
Regarding /eɪ/ now, Hualde et al. (Reference Hualde, Luchkina and Eager2017) found an expected difference in duration between tokens before word-final consonants and other tokens, but no significant differences in formant values. Our GAMM analysis, on the other hand, did return significant differences in F1 trajectories, albeit of a smaller magnitude and for a smaller part of the trajectories than for /aɪ/. (A very small difference was also found for F2 in the two contexts before a word-final consonant.) These relatively small differences between contexts may be interpreted as a phonetic effect driven by differences in duration.
All 53 speakers in our sample show the same trend, but they differ in the magnitude of the contrast between contexts. Previous studies of Canadian Raising have, in fact, remarked on the existence of inter-speaker variation and criteria have been used for determining the presence of this phenomenon based on F1 measurements at a single point. In order to get a sense of inter-speaker variation in our sample we have used clustering analysis of whole formant trajectories to classify our speakers into two groups, with greater and smaller differences in formant structures between contexts. The results of this classification only partially coincide with those obtained by using other methods. Both F1 and F2 contribute to the clustering of speakers. More speakers make a relatively large contrast in formant structure before word-final voiced vs. voiceless consonants than when the d-flap and t-flap environments are compared.
Whereas our findings are consistent with the results in Hualde et al. (Reference Hualde, Luchkina and Eager2017) based on measurements at only two points for a sub-sample (of 17 speakers) of the data that we have analyzed here and with other reports in the literature, it seems fair to conclude that the statistical analysis of whole formant trajectories has enabled us to advance in the understanding of the /aɪ/-raising phenomenon, obtaining a considerably richer picture of the nature of the contrast. We have confirmed that diphthongs before voiced vs. voiceless consonants differ significantly in the formant values of both the nucleus and the offglide. In addition, thanks to the visualizations that GAMM analysis allows, we have been able to establish that formant trajectories in the contexts that we have compared are in fact significantly different from onset to offset. We thus find ourselves in agreement with Wieling (Reference Wieling2018) regarding the usefulness of GAMM for the statistical comparison of diphthongs.
A second contribution that we have tried to make in this paper is to the classification of individual speakers according to the presence of /aɪ/-raising in their speech (‘raisers’ vs. ‘non-raisers’). From our clustering analysis it appears that both F1 and F2 may contribute to the contrast.
We conclude with some considerations regarding the nature of Canadian Raising and its origin. An issue that arises in the study of the Canadian Raising phenomenon is that of its phonetic origins and subsequent phonologization. A diphthong such as /aɪ/ requires lowering of the dorsum followed by its raising and fronting. Given these conflicting gestures, Canadian Raising has commonly been understood as gestural undershoot in the shorter diphthongs conditioned by a following voiceless stop. This, however, does not explain why the offglide is higher before a voiceless consonant. Moreton & Thomas (Reference Moreton, Thomas, Jennifer and Hualde2007) instead propose that the peripheralization of the offglide before a voiceless consonant is the first step in the raising process, although they state that the phonetic reason for this is unknown. A subsequent phenomenon would be assimilation of the nucleus to the higher offglide.
An anonymous reviewer for this journal suggests that lengthening before a voiced coda allows for greater jaw lowering and that the slower rate of the diphthongal change leads to a lower final F2. Our data show that both F1 and F2 trajectories for /aɪ/ before both voiceless vs. voiced consonants are significantly different throughout the duration of the diphthong. In our view, the phenomenon of Canadian Raising can be conceptualized as having its origin in an exaggeration of differences in formant structures preceding voiced and voiceless consonants, with a lower trajectory for F1 and a higher trajectory for F2 before voiceless consonants.
Regarding the phonologization of Canadian Raising as a phonetically opaque process in the pre-flap context, Freuhwald (Reference Fruehwald2016) concludes that in Philadelphia there is no documentable historical stage when the process was purely phonetically conditioned. Berkson et al. (Reference Berkson, Davis and Strickler2017) and Davis et al. (Reference Davis, Berkson and Strickler2020), on the other hand, find evidence for such a stage in the speech of some speakers from the Fort Wayne area of northeastern Indiana. Although our study was not designed to answer diachronic questions, we note that, in our data, differences in formant trajectories are greater before word-final consonants than between the two pre-flap contexts. Furthermore, cluster classification shows that more speakers have a relatively large contrast between diphthongs preceding voiced vs. voiceless consonants than when the two pre-flap contexts are compared with each other. The contrast thus appears to be more robust in the transparent context before word final consonants than in the opaque pre-flap context.
It seems reasonable to assume that word-final flapping of /t/ creates the conditions for the appearance of [ʌi] before a flap. In the relevant varieties, depending on the following phrasal context, the same word, say write, can be pronounced both with a final voiceless consonant (as in write, write that) and with a voiced flap (write it, write again). This would favor analogical propagation of allophones between phrasal contexts under flapping: write [ɹʌit] → write it [ɹʌiɾɪt] vs. ride [ɹaɪd] → ride it [ɹaɪɾɪt]. A subsequent process would be analogical extension to morphologically related words, e.g. write it [ɹʌiɾɪt] → writing [ɹʌiɾɪŋ]. We leave the experimental testing of this hypothesis for further research.
Acknowledgments
We are very grateful to three anonymous reviewers for this JIPA for their very useful comments and suggestions, which have greatly helped us in improving the quality of this paper. We also want to thank our participants and our research assistants for help with data segmentation.
Appendix Central Illinois speakers
In this appendix we show the average formant trajectories for the five speakers from central Illinois that we excluded from our statistical analysis. The overall trends are substantially the same as for our Chicagoland speakers, with a lower first formant and a higher second formant for /aɪ/ before a word-final voiced consonant. In the pre-flap contexts, however, differences are very small.
Central Illinois speakers. F1 and F2 of /aɪ/ (left) and /eɪ/ (right) before word-final voiced and voiceless consonants.

Central Illinois speakers. F1 and F2 of /aɪ/ (left) and /eɪ/ (right) before /d/ and /t/ in the context of flapping.