Implications
Animal temperament is a trait that exerts a marked influence on the beef cattle production system in Brazil because the management applied on the farms has direct repercussions on the profitability of rural enterprises, implying less labor and a reduction in work accidents, with consequent benefits for the animals and people involved. Therefore, temperament has been the focus of studies aiming at its inclusion in genetic breeding programs. For a trait included in the breeding objective, it is necessary to identify environmental factors that influence this trait for the correct modeling of its genetic effects and prediction of expected progeny differences. In addition, the study of genetic correlations between temperament and the reproductive traits may contribute to the selection process of animals.
Introduction
Temperament can be defined as the intensity at which the animal reacts to humans or the situations created by them (Spironelli and Paranhos da Costa, Reference Spironelli and Paranhos da Costa2008).
There are several ways to measure temperament. In cattle, the majority of research on temperament explored the responses to a novel testing arena, a novel object or to the human presence or handling (Phocas et al., Reference Phocas, Boivin, Sapa, Trillat, Boissy and Le Neindre2006). According to Burrow (Reference Burrow1997), the definition of temperament in cattle breeding and genetics has been restricted to the behavioral response of the animal handling by humans.
Burrow (Reference Burrow2001) used the flight speed score of animals to measure temperament. This score refers to the time taken (s) for an animal to cover 1.7 m after leaving a weighting crush. The aggressiveness score (AG) used by Phocas et al. (Reference Phocas, Boivin, Sapa, Trillat, Boissy and Le Neindre2006) indicates whether the animal threatened the handler in order to measure temperament in heifers. They also defined a docility score (DO) combining several ways of measuring the behavioral response of the animal to the handler in a linear equation to analyze temperament.
As this trait directly affects the enterprise's profitability and the well-being of the animals, alternatives that facilitate handling on the farms are investigated in order to minimize the stress on humans and animals and to reduce hematomas on animals during transport to the abattoir (Silveira et al., Reference Silveira, Fischer and Soares2006).
One alternative would be the inclusion of animal temperament in the breeding objective, with genetic evaluations being corrected for environmental factors. These factors could be divided into two groups: classificatory effects, such as contemporary group, and effects generally used as covariates, such as age of dam at calving (ADC), long yearling age (YA) and long yearling weight (YW) of the animal (Cardoso et al., Reference Cardoso, Cardellino and Campos2004).
The reproductive traits are always important for all production systems and should be part of the breeding objective, despite them generally presenting small heritability values. Scrotal circumference (SC) is an indicative trait of reproduction potential in males because size of the testes is related to sperm production, semen quality and production of sexual hormones (Baker et al., Reference Baker, Kroo, Turman and Buchanan1981; Trocóniz et al., Reference Trocóniz, Beltrán, Bastidas, Larreal and Bastidas1991). SC is easily measured at young ages (e.g. at weaning, 365 days of age and long yearling). This trait has been used as a selection criterion in programs designed to improve the productive and reproductive efficiency of beef cattle herds. For females, the trait most commonly used for measuring sexual precocity is age at first calving (AFC). According to Martin et al. (Reference Martin, Brinks, Bourdon and Cundiff1992), the reproductive performance of heifers depends on the age at which they calve for the first time, with heifers calving earlier having a longer productive life than those calving later. Selection for sexual precocity has been applied directly to AFC and also indirectly, using SC as an indicator trait because SC usually presents a favorable genetic correlation with AFC and shows higher heritability estimates than AFC.
The objectives of this study were to evaluate the effects of the covariates ADC, YA and YW on temperament score and to estimate genetic parameters for temperament, SC and AFC in Nellore cattle participating in a breeding program to infer the usefulness of these traits as selection criteria.
Material and methods
Animals and data
Data from Nellore cattle participating in the PAINT®, the commercial breeding program of the Brazilian company CRV Lagoa Ltda. (Sertãozinho, São Paulo, Brazil) were used. This company includes productive and reproductive traits and visual scores in its selection index. Records on Nellore cattle calved from 1994 to 2007 belonging to 173 herds located in the Southeast and West central regions of Brazil (tropical climate) were used in this research. The animals were raised in a production system based on pasture and mineral salt during the whole year. Heifers and cows were bred using artificial insemination sires, and in a second step, unless they had conceived, they were mated to sires in natural services. The breeding season occurred in the rainy season from December to February and the calves were weaned during the dry season (May to July).
Description of the studied traits
SC was measured at long YA (500 days) with a metric tape at the widest point of the scrotum and comprised the two testes and scrotal skin. AFC were obtained from the regular records in the data file. For temperament score (T), the animals received grades ranging from 1 to 4 according to their reaction to the individual in the presence of the examiner (CRV Lagoa. Sumário Consolidado PAINT, 2009). The grades were attributed after weight recording of the animal at long YA. The animal was released into the corral and the examiner attributed the grade according to the following criteria:
1. The animal is very gentle, quiet and easy to handle, is not bothered by the environment of the corral or human presence, does not look for escape and moves slowly and quietly.
2. The animal is not bothered by the environment of the corral or human presence, does not look for escape and moves with agility without presenting sudden movements. The animal is aware of the environment and what occurs around it, but shows no aggression.
3. The animal is agitated, bothered with the environment of the corral and human presence and looks for escape but does not try to break or jump over the fence of the corral. The animal moves with agility, presents sudden movements and is aware of the environment and what occurs around it, but shows no aggression.
4. The animal is aggressive, is bothered with the environment of the corral and human presence and presents agile and sudden movements. The animal is aware of the environment and what occurs around it, tries to break and rupture the fence of the corral.
Data editing and contemporary groups
Statistical analysis using the SAS® 9.1 program (SAS Institute Inc., Cary, NC, USA) was conducted through the GLM procedure. Outlier data, records of animals without information for the traits studied, animals with unknown parents or progeny of sires with fewer than five progenies and contemporary groups with fewer than five animals were removed. The contemporary groups were the same for all traits and consisted of the combination of farm, year and birth season (spring, summer, autumn and winter), sex, management group at birth, farm and management group at weaning and farm and management group at long YA.
Covariate analysis
After absorption of the contemporary group effect using the ABSORB tool of the GLM procedure (SAS 9.1, SAS Institute Inc.), regression analyses were performed to determine the significance of the models containing the covariates ADC, YA and YW. For definition of the models, the data were analyzed in order to determine the influence of each covariate on T. First, the following model was considered:

where T is the predicted score for temperament; b 1, b 2 and b 3 are linear, quadratic and cubic regression coefficients, respectively; Z is the effect of the jth covariate on T, where j = ADC, YA and YW; and e is the vector of residual effects. The degree (linear, quadratic and cubic) of the covariates was defined by the coefficient of determination (R 2) and the level of significance. These criteria were used to choose the best models for each covariate.
Statistical analyses and models
(Co)variance components and genetic parameters for T, SC and AFC were estimated by restricted maximum likelihood (REML) methodology using a derivative-free algorithm, in a multiple-trait animal model. For all traits, direct genetic additive and residual effects were considered as random effects. Contemporary group was included in the model as a fixed effect. The environmental effects that significantly influenced T (ADC,YA and YW) were included as covariates for this trait. In the case of SC and AFC, the effect of YW (linear and quadratic) was included as covariate.
In matrix notation, the multiple-trait animal model can be represented as:

where y = vector of observations; b = vector of fixed effects; u = vector of direct additive genetic effects; and e = vector of random residual effects. X and Z are incidence matrices relating b and u to y, respectively. It was assumed that E[y] = Xb, Var(u) = G⊗A and Var(e) = I⊗R, where G is the matrix of direct additive genetic covariances between traits; A is the numerator relationship matrix, obtained with pedigree information on 70 488 animals; R is a residual covariance matrix such that the environmental covariance between SC and AFC (measured on different sexes) was assumed to be 0; I is an identity matrix (of appropriate order); and ⊗ is the Kronecker product.
The model above was fitted using the multiple-trait derivative free REML programs (Boldman et al., Reference Boldman, Kriese, Van Vleck and Kachman1995). In multiple-trait analyses with this software, the s.e. of genetic parameters are reported only when all traits were measured on animals with records, which is not the case in this study. Hence, the approach proposed by Kachman and Van Vleck (Reference Kachman and Van Vleck2007) was used to obtain estimates of s.e. Three cold restarts using different starting values were run to ensure that a global maximum of the log likelihood function was found. Convergence was assumed when the variance of simplex function was <10−9.
Results
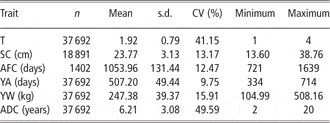
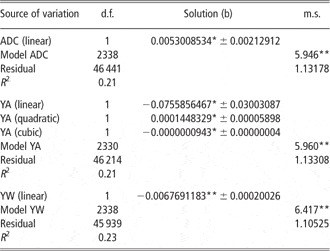
The results of descriptive statistics of the traits studied and the variables used as covariate effects for temperament are shown in Table 1. A decline in the number of animals per trait can be observed, with increasing age of measurement. Regression analysis for T considering the models that include ADC (linear effect), YA (linear, quadratic and cubic effect) and YW (linear effect) as covariates indicated that these covariates significantly influenced (P < 0.05) T (Table 2).
Descriptive statistics of T, SC, AFC, long YA, long YW and ADC in Nellore cattle

T = temperament score; SC = scrotal circumference; AFC = age at first calving; YA = long yearling age; YW = long yearling weight; ADC = age of dam at calving; n = number of observations.
Summary of regression analysis for T in Nellore cattle using models including ADC, YA and YW as covariates

T = temperament score; ADC = age of dam at calving; YA = long yearling age; YW = long yearling weight.
*P < 0.05; **P < 0.01.
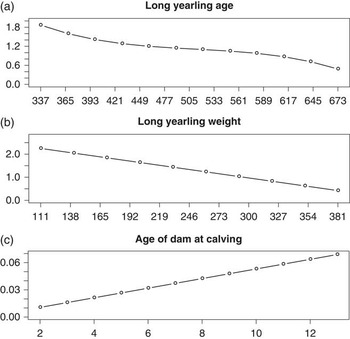
The trend in T for each effect (ADC, YA and YW) obtained with the models studied is shown in Figure 1. T decreased as YA and YW increased, whereas they increased as age of the dam at calving increased. The values for T showed on y axis (Figure 1a and c) were smaller than those in the original scale because of the small regression coefficient estimates (b; Table 2) used to predict the curves presented in Figure 1. The small values estimated for the regression coefficients were due to the absorption of contemporary group effect in the statistical analyses.
Trend in temperament score of Nellore cattle corrected for the effect of contemporary group according to long yearling age of the animal in days (a), long yearling weight in kg (b) and age of dam at calving in years (c).

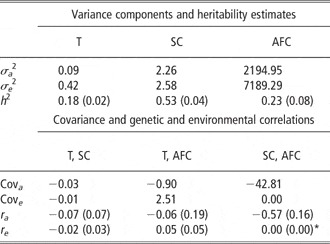
The estimates of (co)variance components and genetic parameters for T, SC and AFC obtained by multiple-trait analysis are shown in Table 3. They ranged from 0.18 ± 0.02 for T to 0.53 ± 0.04 for SC.
(Co)variance components and genetic and environmental parameters for T, SC and AFC of Nellore cattle obtained in multiple-trait analysis

T = temperament score; SC = scrotal circumference; AFC = age at first calving; σa 2 = additive genetic variance; σe 2 = environmental variance; h 2 = heritability estimates; Cova = additive genetic covariance; Cove = environmental covariance; ra = genetic correlation; re = environmental correlation.
*SC and AFC are measured on different sexes, the covariance was set to 0.
Standard errors are given within parentheses.
Discussion
The decrease in the number of animals for AFC (Table 1) might be explained by the fact that, because T is a trait recently introduced in genetic evaluations, the number of cows with information for T and AFC was still small. The CV estimated for the traits studied were of low magnitude, except for T (41.15%) and ADC (49.59%), whereas the CV for AFC (12.47%) was close to the reported value by Boligon et al. (Reference Boligon, Rorato and Albuquerque2007) for Nellore cattle (10.13%). The low CV values for SC and YA could be due to the short calving season. ADC presented a high range (18 years) showing the long productive life of Nellore cows.
All models used for the analysis of T, even when significant (P < 0.01), presented R 2 of low magnitude (∼0.22), suggesting poor goodness-of-fit of the regression equations (Table 2). Nevertheless, T tended to increase with increasing ADC (Figure 1c). For YA and YW, changes in T were observed with increasing age and weight. Older and heavier animals tend to present less stressed and gentler behavior because they are more accustomed to human handling and spend more time on feeding and less time in vigilance. This tendency was also observed by Voisinet et al. (Reference Voisinet, Grandin, Tatum, o'Connor and Struthers1997) and Gauly et al. (Reference Gauly, Mathiak, Hoffmann, Kraus and Erhardt2001), who suggested a higher productive performance for animals with a better temperament.
The heritability estimates for T of 0.18 ± 0.02 (Table 3) was similar to those reported by Mishra et al. (Reference Mishra, Chauhan and Gupta1975), Mourão et al. (Reference Mourão, Bergmann and Ferreira1998) and Phocas et al. (Reference Phocas, Boivin, Sapa, Trillat, Boissy and Le Neindre2006), but were lower than those observed by Burrow (Reference Burrow2001) for animals of tropical breeds (0.40 to 0.44). Nevertheless, the magnitude of the estimate obtained in this study, together with the low magnitude of its respective standard error, which confers reliability, suggests that temperament presents sufficient additive genetic variability in the Nellore breed to respond to selection. However, genetic progress is expected to be slow because of the small magnitude of the estimated parameter.
The heritability for SC of 0.53 ± 0.04 (Table 3) was higher than those reported by Gressler et al. (Reference Gressler, Bergmann, Pereira, Penna, Pereira and Gressler2000), Grossi et al. (Reference Grossi, Frizzas, Paz, Bezerra, Lôbo, Oliveira and Munari2008) and Frizzas et al. (Reference Frizzas, Grossi, Buzanskas, Paz, Bezerra, Lôbo, Oliveira and Munari2009), who found estimates of 0.31, 0.46 and 0.42, respectively, for Nellore cattle at long YA. The heritability estimate for AFC (0.23 ± 0.08) was higher than those reported by Boligon et al. (Reference Boligon, Rorato and Albuquerque2007) and Grossi et al. (Reference Grossi, Frizzas, Paz, Bezerra, Lôbo, Oliveira and Munari2008) for Nellore cattle (0.14 in both studies). On the basis of these heritability estimates, we can expect that the response to selection for sexual precocity using SC of Nellore animals participating in this breeding program would be much higher and faster than the response to the other traits. AFC presented heritability estimates of moderate magnitude and the genetic correlation estimate between SC and AFC (−0.57 ± 0.16) shows an antagonist and moderate relationship between them. AFC and SC, as an indirect selection criterion, should be included in the breeding objective aiming at improving conception rates in beef cattle herds.
The genetic and phenotypic correlations obtained from this study (Table 3) between T and SC and AFC were very weak, suggesting a mild antagonism between this trait and SC and AFC. Therefore, selection applied to T will practically not lead to correlated changes in the other traits. On the other hand, a favorable and moderate genetic correlation (−0.57) was estimated between SC and AFC indicating that SC could be used as an indirect criterion for sexual precocity of Nellore heifers and also as a direct criterion for increasing fertility of bulls.
We found no studies in the literature estimating genetic correlations between T and reproductive traits. Nevertheless, Burrow (Reference Burrow2001) measuring temperament as fight speed, reported that genetic correlation estimates among temperament and SC and pregnancy and days to calving equal to 0.11, 0 and 0.15, respectively. Phocas et al. (Reference Phocas, Boivin, Sapa, Trillat, Boissy and Le Neindre2006) estimated genetic correlation between AG and DO of −0.97 and among DO and fertility and age at puberty and calving ease equal to 0.55, −0.32 and 0.13, respectively. The authors reported that estimates for genetic correlation among AG and fertility and age at puberty and calving ease equal to −0.44, 0.19 and −0.25, respectively.
The results found in this study show all studied traits could be included in the breeding objective of the Nellore cattle in order to improve the reproductive performance and to facilitate the handling of animals. Despite this, further studies on T using a threshold model and/or other approaches are needed to consider the discontinuous variation of this trait.
Conclusion
The covariates YA, YW and ADC should be included in the temperament model. T, SC and AFC should present genetic gain under selection, with this gain being more expressive for SC, an indirect criterion for sexual precocity of Nellore heifers. Few shared genes act on the determination of T and the reproductive traits SC and AFC.
Acknowledgements
The authors are thankful to the PAINT® breeding program (CRV Lagoa Ltda.) for providing the data used in this study. DB thanks CAPES (Coordenação de Aperfeiçoamento de Pessoal de Nível Superior/Programa de Pós-Graduação em Genética e Melhoramento Animal – FCAV/UNESP) for his fellowship. HHRN was supported by a FAPESP (Fundação de Amparo à Pesquisa do Estado de São Paulo) fellowship. MEB, JAO and SAQ were supported by a CNPq (Conselho Nacional de Desenvolvimento Científico e Tecnológico) fellowship.