Implications
Growth hormone (GH) is a model treatment used to increase milk production in dairy cows; however its use in commercial production is controversial. Identifying genes affected by GH treatment and understanding how they interact to increase milk production may help to elucidate pathways that can be manipulated independently of GH treatment. Microarray analysis and quantitative real-time PCR are well-established methods used to identify differentially expressed genes. Our data identifies cell signalling pathways within the mammary gland that may be involved in mediating the effect of GH on milk production in the lactating dairy cow.
Introduction
Despite the well-established galactopoietic effect of GH in lactating ruminants (Bauman, Reference Bauman1999), the molecular mechanisms that mediate the effects of GH on milk protein synthesis in ruminants are not fully understood. The synthesis and secretion of milk by the mammary gland involves the expression of a large number of genes and thus, transcriptome profiling studies have provided valuable insights into the molecular events in the bovine mammary gland at the onset of lactation (Finucane et al., Reference Finucane, McFadden, Bond, Kennelly and Zhao2008), in response to oestrogen (Li and Capuco, Reference Li and Capuco2008), involution (Singh et al., Reference Singh, Davis, Dobson, Molenaar, Wheeler, Prosser, Farr, Oden, Swanson, Phyn, Hyndman, Wilson, Henderson and Stelwagen2008) and gene networks driving bovine milk fat synthesis during lactation (Bionaz and Loor, Reference Bionaz and Loor2008).
Administration of GH has been shown to increase the yield of milk protein, lactose and fat without influencing their concentration (Bauman, Reference Bauman1999; Hayashi et al., Reference Hayashi, Nones, Roy, McNabb, McKenzie, Pacheco and McCoard2009). Thus, GH administration offers a useful model to study the mechanisms regulating milk protein synthesis in the bovine mammary gland. It has been proposed that GH increases milk production indirectly by stimulating hepatic IGF1 secretion which then acts as the primary agonist, increasing mammary blood flow, reducing whole-body amino acid oxidation and repartitioning nutrients from adipose and muscle tissue towards the mammary gland (Bauman, Reference Bauman1999). However, it has been reported that the bovine mammary gland expresses both GH receptor (GHR) messenger RNA (mRNA) and protein (Plath-Gabler et al., Reference Plath-Gabler, Gabler, Sinowatz, Berisha and Schams2001), and that bovine mammary epithelial cells can respond directly to GH treatment by enhancing pathways activated by IGF1 (Sakamoto et al., Reference Sakamoto, Yano, Kobayashi, Hagino, Aso and Obara2007). Therefore, suggesting GH may also have a direct effect on the mammary gland independent of, or synergistically with IGF1.
Authors have reported that in vivo (Yang et al., Reference Yang, Zhao, Baracos and Kennelly2005) and in vitro (Zhou et al., Reference Zhu, Goh and Lobie2008) the galactopoietic effect of GH in the bovine mammary gland appears to be mediated, at least in part, by influencing the mRNA levels of the major milk protein genes. Also, increased milk synthesis associated with GH treatment is potentially related to increased turnover (proliferation/apoptosis) and activity of mammary epithelial cells (Capuco et al., Reference Capuco, Wood, Baldwin, Mcleod and Paape2001), indicating that GH may influence gene networks that regulate cell turnover/cycle and metabolism. In addition, results from two companion studies from our group suggest that GH treatment increases mammary gland weight through increased cell size, and not cell number (Sciascia et al., Reference Shillingford, Miyoshi, Robinson, Bierie, Cao, Darin and Hennighausen2013), and that these changes are associated with changes in the abundance of proteins belonging to the mammalian target of rapamycin (mTOR) and mitogen-activated protein kinase (MAPK)-translation initiation and nuclear export signalling cascades (Hayashi et al., Reference Hayashi, Nones, Roy, McNabb, McKenzie, Pacheco and McCoard2009; Sciascia et al., Reference Shillingford, Miyoshi, Robinson, Bierie, Cao, Darin and Hennighausen2013). These findings suggest increased milk protein synthesis associated with GH treatment is a function of both transcriptional and post-transcriptional regulation coupled with increased secretory capacity and not cell number. However, the gene networks in the mammary gland that potentially underpin the metabolic changes that are associated with the effect of GH treatment on milk synthesis remain to be fully characterized. In addition, the effect of GH on the synthesis of the major milk proteins has not been reported.
The first objective of this study was to evaluate the effect of GH on the synthesis of the casein and whey proteins. The second objective was to gain a better understanding of the gene networks that may be associated with the GH-induced increase in milk protein output in the lactating bovine mammary gland using transcriptome analysis.
Material and methods
Animals, diets treatment and tissue collection
All procedures involving these animals were carried out in compliance with the guidelines of the AgResearch Grasslands Animal Ethics Committee (Palmerston North, New Zealand) in accordance with the 1999 Animal Welfare Act of New Zealand. The tissues used in this study were derived from an experiment that has been described in detail elsewhere (Hayashi et al., Reference Hayashi, Nones, Roy, McNabb, McKenzie, Pacheco and McCoard2009). Briefly, non-pregnant second parity spring-calved Jersey cows that were between 178 to 200 days postpartum were sourced from a commercial herd. The mean BWs immediately before treatment (±SE) were 300±9 kg. Cows were housed indoors in individual stalls, offered a diet thrice daily, that was formulated to exceed requirements for metabolizable energy, protein and essential amino acids for lactating dairy cows using the National Research Council Dairy Cattle (2001) software, and milked twice daily. The total mixed ration diet was offered ad libitum (good-quality pasture baleage: 11.5 MJ of metabolizable energy (ME)/kg of dry matter (DM), 45% DM content, offered at 14 kg/cow per day) plus a concentrate milking cow ration: 11.5 MJ of ME/kg of DM, 90% DM content offered at 3 kg/cow per day). DM intake for each cow was averaged for the experimental period (day 0 to day 6). A 2-week slow-release formulation of commercially available GH (Lactatropin®, somatribove zinc suspension 500 mg; Elanco Animal Health, Bryanston, South Africa) was administered as per the manufacturer’s dosage recommendations for a commercial dairy farm, via a single subcutaneous injection to four lactating Jersey cows. A further four Jersey cows were given a single subcutaneous injection of saline solution to serve as controls. Milk yield was recorded, and samples collected for composition analysis for a period of 4 days before treatment to confirm that milk production in each group was similar (data not shown). Milk yield was recorded daily and milk samples collected at each morning and afternoon milking for analysis of individual milk proteins. After 6 days following injection, the animals were slaughtered immediately following the morning milking. Postmortem mammary tissue samples were collected from the secretory area (lobulo-alveolar structures) of the right hind quarter, snap frozen in liquid nitrogen and stored at −80°C for further analysis.
Analysis of milk protein composition
The HPLC method used identifies the major bovine milk proteins and main casein variants (Carles, Reference Carles1986). Briefly, a skim milk sample was mixed with three volumes of a buffer containing 6 M guanidine HCl (Sigma, St. Louis, MO, USA) 0.1 M bis-tris (Sigma) 5.5 mM trisodium citrate (AR, BDH, Poole, England) and 2% β-mercaptoethanol (Sigma) mixed and incubated for 1 h at room temperature. The sample was transferred to a fresh tube and mixed with one volume of 4.5 M guanidine HCl containing 2% β-mercaptoethanol. Samples were mixed and filtered into HPLC vials (0.2 µm cellulose acetate filters; Advantec MFS, Dublin, CA, USA), capped, and kept at 4°C until analysis (within 24 h).
The HPLC system was a Shimadzu 10A-VP (Shimadzu Corporation, Tokyo, Japan). This consisted of two pumps (LC-ADDVP, Shimadzu Corporation), automatic injector (SIL-10ADVP, Shimadzu Corporation) loading 50 µl and a UV detector (SPD-10AVP, Shimadzu Corporation). The instrument was running the Shimadzu Class VP software for control, data acquisition and processing. The column was a BioRad Hi-Pore RP-318 (250 mm; 4.6 mm I.D.) with 300 Å pores and 5 μm particles (Bio-Rad Laboratories, Hercules, CA, USA) kept at 40°C. The proteins were separated using a gradient of two phases; A (0.2% tri-fluroacetate (TFA) in deionized (DI) water) and B (90% acetonitrile, 10% DI water, 0.1% TFA) with detection at 280 nm. Purified bovine milk protein standards (Sigma) were used to identify the chromatographic peaks corresponding to bovine casein and whey proteins. The areas of these peaks were measured in the samples and peak area ratios were calculated relative to the standards.
Hormone profiles
Circulating concentrations of glucagon (plasma) and insulin (serum) in GH-treated and control cows were evaluated using Linco’s Glucagon Radioimmunoassay Kit (Millipore, St Charles, MI, USA) and Linco Research Rat Insulin RIA kits, respectively, by a commercial laboratory (Nutrition Laboratory, Massey University, Palmerston North, New Zealand). This approach utilizes 125I-labelled glucagon and glucagon antiserum, or 125I-labelled insulin and a rat insulin antiserum to determine the concentration of glucagon or insulin, respectively, in plasma by the double antibody/polyethylene glycol technique. All samples were assayed in duplicate.
RNA extraction
Total RNA was extracted using Trizol® Reagent (Life Technologies, Carlsbad, CA, USA) according to the manufacturers’ protocol incorporating the optional step during sample homogenization to remove excess fat. Total RNA was further purified (RNeasy Mini Kits; Qiagen, Valencia, CA, USA) and the quality and quantity of the purified RNA estimated using a Bioanalyzer 2100 (Agilent Technologies, Santa Clara, CA, USA). The cut-off integrity (RIN) value for individual RNA samples was 8.5 with 9.1 being the average RIN for all purified RNA samples.
Microarray procedures
Total RNA (10 µg) were used as the template for reverse transcription and fluorescent-labelling reactions using the SuperScript Indirect complementary DNA (cDNA) Labelling System (Life Technologies). The preparation of the AgResearch proprietary bovine cDNA microarrays (labelling and hybridization procedures) were performed as described previously (Singh et al., Reference Singh, Davis, Dobson, Molenaar, Wheeler, Prosser, Farr, Oden, Swanson, Phyn, Hyndman, Wilson, Henderson and Stelwagen2008). Data obtained were then used to gain insights into the biological processes that changed in response to GH treatment. The focus was on processes that were relevant for the regulation of milk protein synthesis and the genes were clustered into specific pathways/functions using Ingenuity Pathway Analysis (IPA; software (Ingenuity Systems, Redwood City, CA, USA, www.ingenuity.com). This software uses known relationships based on published data from human, mouse and rat genes/proteins, and has been used previously to study gene networks in the bovine (e.g. Bionaz and Loor, Reference Bionaz and Loor2008 and Reference Bionaz and Loor2011).
Quantitative PCR
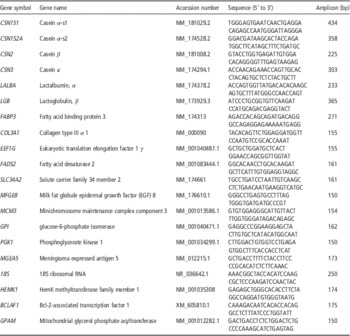
Quantitative PCR (qPCR) evaluation of 20 gene targets was used to identify the selection criteria for differentially expressed genes previously identified using the microarrays. The genes included genes of potential biological interest that did not meet the original microarray selection criteria of false discovery rate (FDR)<0.05 and 1.2 fold change in expression (n=16) including the major milk protein genes, and genes that met the selection criteria (n=17). The mRNA levels of β-lactoglobulin B (LGB) were also evaluated as this milk gene was not represented on the array. Total RNA (500 ng) was reverse transcribed to make cDNA using the Transcriptor First Strand cDNA Synthesis Kit (Roche Diagnostics, Mannheim, Germany) and oligo-dT primers, according to the manufacturer’s instructions. Primer design and mRNA abundance was determined as previously described (Hayashi et al., Reference Hayashi, Nones, Roy, McNabb, McKenzie, Pacheco and McCoard2009). A Light Cycler 2.0 (Roche Diagnostics) and the Light Cycler Fast Start DNA Master Plus SYBR Green I kit (Roche Diagnostics) was used for qPCR. Efficiencies of each set of primers were calculated for each sample using the LinReg PCR program (Ramakers et al., Reference Ramakers, Ruijter, Deprez and Moorman2003).
Genes traditionally used as reference genes (to normalize expression changes) for the qPCR method, for example 18S, were differentially expressed in response to treatments (microarray data) and confirmed by qPCR. Therefore, two reference genes glycerol-3-phosphate acyltransferase (GPAM) and Bcl-2-associated transcription factor 1 (BCLAF1) to account for analytical errors and cDNA synthesis efficiency, were selected from the microarray data using the following criteria: (1) absence of differential expression based on the microarray data (minimum of two ESTs per gene represented), (2) availability of bovine sequence and (3) stability of gene expression identified using qPCR and analysis of data by BestKeeper Primers used for qPCR analysis are presented in Table 1.
Primers used in quantitative PCR assays

Statistical analysis
Blood and milk composition parameters were analysed using the MIXED procedure in SAS Version 9.1.3. Treatment effects were defined as fixed effects (GH v. control), and repeated measurements in time and day were modelled using cows within treatment as subjects. Data are presented as least square means and standard errors of the mean. Differences with P<0.05 were considered significant with trends P<0.10.
To provide a robust set of gene expression data, expressed sequence tag (EST) data were normalized to remove noise due to experimental artefacts and corrected for systematic array and dye effects. The resulting data were analysed using the LIMMA package in R 2.7.0. For each EST, a modified t test was performed and the treatment effect P value adjusted for multiple testing using the Benjamini and Hochberg correction (Benjamini and Hochberg, Reference Benjamini and Hochberg1995) to generate a FDR. Genes with a FDR<0.05, P<0.001 and 1.2 fold differential expression levels (informed by qPCR validation of selected target genes, data not shown) were considered to be of interest.
The difference in average qPCR Cq values between control and GH-treated group were assessed by pair-wise fixed reallocation randomization test, using the relative expression software tool (Pfaffl et al., Reference Pfaffl, Horgan and Dempfle2002). Normalization of target genes was performed against the reference genes GPAM and BCLAF1, whose geometric means were 21.9 and 24.2, respectively.
Pearson’s correlation coefficients between milk, total protein, lactose and fat yield and the yield and concentration of the individual milk proteins and the fold-expression of genes were calculated using the CORR procedure of SAS to assess whether the changes in these phenotypic traits in response to GH were proportional to the changes in gene expression. Briefly, a data subset was created by filtering the microarray results for genes with significantly different expression. Then, expression values (log-ratios) for each gene were merged with the data on phenotypic responses for each cow. Milk-related phenotypic responses of interest consisted of the concentrations and yield of milk κ-, α-and β-caseins; α-lactalbumin; β-lactoglobulins A and B; total protein, fat and lactose; and somatic cells. Pearson’s correlations with P values <0.01 and r>0.85 were considered of interest.
Results
The effect of GH on milk protein composition and blood hormone profiles
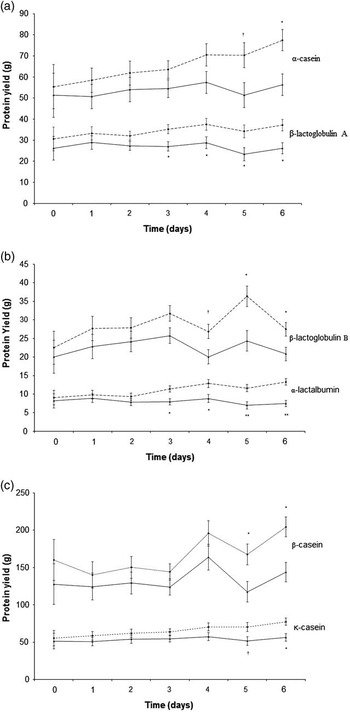
GH treatment increased (P<0.05) the yield of all the major casein and whey proteins by 32% to 41% with the exception of α-lactalbumin yield which was increased by 79% compared with controls (Figure 1a–c). The concentration of all major individual milk proteins was not affected by GH treatment (data not shown) with the exception of a trend towards greater α-lactalbumin concentrations in GH-treated cows compared with controls (1.13 v. 0.92±0.07 mg/ml, P=0.076). Plasma concentrations of glucagon and serum concentrations of insulin were not different between GH-treated and control cows (data not shown). We have previously reported that milk lactose and fat yields were elevated in response to GH relative to controls (Hayashi et al., Reference Hayashi, Nones, Roy, McNabb, McKenzie, Pacheco and McCoard2009).
The effect of growth hormone (dashed lines) on the yield of α-casein and κ-casein (a), β-lactoglobulin A and β-casein (b), β-lactoglobulin B and α-lactalbumin (c) proteins 6 days following treatment in the lactating dairy cow relative to controls (solid lines).

The effect of GH on the mammary gland transcriptome
Transcriptome analysis identified a total of 945 genes that were differentially expressed (FDR<0.05 and P<0.001) in GH compared with control mammary tissue. Abundance of mRNA was reduced for 366 gene targets but increased for 579 targets. Validation of the expression profiles of selected genes (n=34) using qPCR was conducted to determine selection criteria of differentially expressed genes using transcriptome analysis to minimize false positives. These genes included targets identified as not differentially expressed on the arrays (EEF2K, mTOR, EIF4E, IGHM, MFGE85, HEMK1), two or more ESTs/gene differentially expressed with fold change of <1.2 (IGHM, MGEA5, 18S, INSR, STAT1, DLAT, CSN1S1, CSN2, LALBA), ⩾2 ESTs/gene and sign fold change of >1.2 (EEF2, IGLL1, FABP3, COL3A1, EEF1G, FADS2, SLC34A2, CSN3, UGP2), one EST/gene differentially expressed with a sign fold change >1.2 (EIF4EBP1, BCLAF1, DOK1, SHC1, PGK1, SLC38A2), one EST/gene differentially expressed with a fold change <1.2 (MCM3, ENSOF1, GPI, LALBA) or not present on the array but of interest for this study (LGB). This analysis indicated that using the selection criteria of FDR<0.05, P<0.001, fold change >1.2 and a minimum of two ESTs/gene would minimize the selection of false positives for genes represented on the arrays (data for genes not differentially expressed using qPCR are not presented).
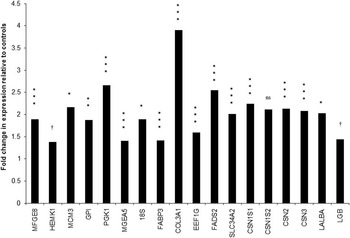
The genes validated by qPCR that met these selection criteria on the microarrays (n=6, P<0.05; FABP3, COL3A1, EEF1G, FADS2, SLC34A2, CSN3), and the genes that did not meet the selection criteria on the microarrays but were identified as differentially expressed using qPCR (n=9; P<0.05; MFGE8, MCM3, GPI, PGK1, MGEA5, 18S, CSN1S1, CSN2, LALBA), or a tendency to be differentially expressed using qPCR (n=2; P<0.10; HEMK1, LGB) in response to treatment are presented in Figure 2. One gene (IGLL1) that met the refined selection criteria for differential expression on the arrays could not be validated by qPCR (data not shown). These genes were also included in the pathway analysis. Although α-s2-casein (CSN1S2) mRNA abundance was increased in response to GH, the difference in mRNA abundance did not reach statistical significance (Figure 2).
Expression profiles of all the major milk protein genes and other genes differentially expressed genes determined by quantitative PCR in the mammary gland of growth hormone v. control cows. ***P<0.001, **P<0.01, *P<0.05, † P<0.10; ns=not significant. MFGE8=milk fat globule-epidermal growth factor (EGF) 8; HEMK1=HemK methyltransferase family member 1; MCM3=minichromosome maintenance complex component 3; GPI=glucose-6-phosphate isomerase; PGK1=phosphoglycerate kinase 1; MGEA5=meningioma expressed antigen 5; 18S=18S ribosomal RNA; FABP3=fatty acid binding protein 3; COL3A1=collagen type III α 1; EEF1G=eukaryotic translation elongation factor 1 γ; FADS2=fatty acid desaturase 2; SLC34A2=solute carrier family 34 member 2; CSN1S1=casein α-s1; CSN1S2=casein α-s2; CSN2=casein β; CSN3=casein κ; LALBA=lactalbumin, α; LGB=lactoglobulin, β.

Using the more stringent selection criteria determined by comparison of array and qPCR expression data (FDR<0.05, P<0.001,>2 EST and >1.2 fold change), mRNA abundance of a total of 100 unique genes were identified as either increased (73%) or decreased (27%) in response to GH treatment and subjected to IPA analysis. All of these genes were ‘network eligible’ and 97 were ‘functions and pathways eligible’ (Supplementary Table S1). These genes consisted of the following IPA categories: enzymes (n=22), transporters (n=10), transcriptional regulators (n=5), translational regulators (n=3), transmembrane receptors (n=5), kinases (n=3) peptidases (n=4) and others (n=46).
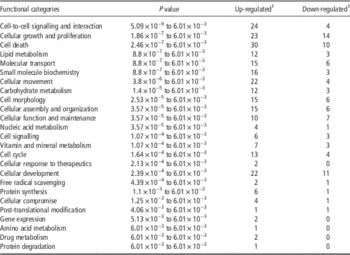
IPA indicated that GH administration influenced the mRNA levels of genes from a wide range of pathways (Table 2), with considerably more genes increased than decreased in each of the functional categories evaluated as expected for a stimulatory effect on milk production. The only canonical metabolic pathway influenced by GH treatment was d-glutamine and d-glutamate metabolism. The differentially expressed genes for each IPA functional category are reported in Supplementary Table S2.
Distribution into functional categories of differentially expressed genes identified by microarray analysis in response to a 6-day treatment with growth hormone compared with controls in lactating bovine mammary tissue

FDR=false discovery rate; EST=expressed sequence tag.
1 Values represent number of up- and down-regulated unique genes in growth hormone treated cows compared with control animals, identified by microarray analysis (n=4 per group, FDR<0.05, P<0.05 and >1.2 fold expression difference and ⩾2 ESTs/gene).
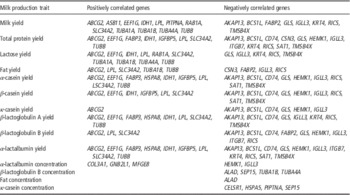
Significant correlations (r>0.85; P<0.001) of GH-responsive genes with milk production traits are shown in Table 3. There were several genes that were either positively or negatively correlated with the yield of milk, lactose, fat, total protein and individual milk proteins. In contrast, only a small number of genes were correlated with the concentration of individual milk proteins. ABCG2 was the only gene that was positively correlated with the yield of total milk protein and each of the individual milk proteins, whereas AKAP13, BCS1L, CD74, GLS and IGLL3 were negatively correlated with these traits (Table 3). Milk yield and the yield of the major milk components (protein, fat and lactose) were positively correlated with the expression of ABCG2, LPL, SLC34A2 and TUBB, and negatively correlated with IGLL3 and RICS.
Distribution into functional categories of differentially expressed genes identified by microarray analysis in response to a 6-day treatment with growth hormone compared with controls in lactating bovine mammary tissue

Discussion
The aim of this study was to gain a better understanding of the genes and potential signalling cascades that may be involved in mediating the effects of GH on milk production, notably milk protein synthesis. To achieve this aim, milk production and composition, endocrine parameters and mammary transcriptome profiles of lactating dairy cows following 6 days of GH treatment relative to un-treated controls were evaluated. Preliminary results of this study have been published elsewhere (McCoard et al., Reference McCoard, Hayashi, Pacheco, Sciascia, Nones, Rounce, Sinclair, McNabb and Roy2010).
Changes in the concentrations of insulin and glucagon are associated with differential nutritional status in ruminants (Chilliard et al., Reference Chilliard, Bocquier and Doreau1998). GH treatment did not influence the circulating concentrations of insulin and glucagon in this study, which is consistent with previous reports (Gulay et al., Reference Gulay, Hayen, Liboni, Belloso, Wilcox and Head2004). This observation is supported by the lack of effect of GH on feed intake (Sciascia et al., Reference Sciascia, Pacheco and McCoard2015).
The increase in the yield of all the major milk proteins in response to GH compared with controls is consistent with the observed increase in total protein yield we have previously reported (Hayashi et al., Reference Hayashi, Nones, Roy, McNabb, McKenzie, Pacheco and McCoard2009). The substantial increase in milk protein output observed in response to GH provides a useful biological model to study the gene networks that may be involved in regulating milk protein synthesis.
Until now, the effect of GH on ruminant mammary gene expression profiles has only been investigated in relation to the role of a few genes encoding key enzymes or factors in the mammary gland including those encoding signal transducer and activator of transcription (STAT) proteins (Boutinaud and Jammes, Reference Boutinaud and Jammes2004). In this study, GH increased the mRNA abundance of all the major milk protein genes with the exception of α-s2-casein. The increase in β-casein mRNA levels in response to GH was consistent with the observations of Yang et al. (Reference Yang, Zhao, Baracos and Kennelly2005). In contrast, GH fails to affect κ-casein mRNA levels in goats (Boutinaud and Jammes, Reference Boutinaud and Jammes2004), indicating potential species-specific effects of GH on the expression of the major milk protein genes in the ruminant mammary gland. The mRNA levels reported here differ to those in our previous report (McCoard et al., Reference McCoard, Roy, Sinclair, Deighton and McNabb2004). The PCR products in the present study were mapped to the ESTs represented on the array; therefore this is unlikely to explain the observed differences. Rather, our previous report was an evaluation of the microarray data only, and subsequent qPCR validation of the gene expression profiles of selected genes indicates that the selection criteria used were not stringent enough to avoid selection of false positives. Using the current selection criteria, the only milk protein gene that was differentially expressed was κ-casein (1.45 fold increase, one EST). Thus, it is likely that microarray profiling was not sensitive enough to detect small differences in mRNA abundance in response to GH treatment, whereas qPCR is more sensitive and thus differential expression profiles between GH and control cows could be detected. Differences between microarray and qPCR profiles have been reported previously (Fair et al., Reference Fair, Murphy, Rizos, Moss, Martin, Boland and Lonergan2004) highlighting the need for validation of microarray data by other methods such as qPCR. However, the overall interpretation of the two analyses remains consistent.
The effect of GH on the mRNA abundance of a wide range of genes observed in this study is consistent with observations following hypophysectomy and GH treatment in other tissues (Flores-Morales et al., Reference Flores-Morales, Stahlberg, Tollet-Egnell, Lundeberg, Malek, Quackenbush, Lee and Horstedt2001). The increased mRNA abundance of genes involved in translational regulation, in particular translation elongation (e.g. EEF1G, EEF1A1, EEF1A2 and EEF2) and ribosomal proteins (18S, RPL3 and RPLP0), and mRNA levels of genes involved in the regulation of cell signalling, post-translational modification and gene expression indicate both transcriptional and translational regulation of milk production. The potential role of translational regulation is consistent with our previous report where the initiation and elongation steps of mRNA translation appear to mediate at least some of the effects of GH on milk protein yield potentially via the mTOR pathway (Hayashi et al., Reference Hayashi, Nones, Roy, McNabb, McKenzie, Pacheco and McCoard2009). The importance of gene expression networks involved in translational regulation of mammary protein synthesis is consistent with previous reports (Bionaz and Loor, Reference Bionaz and Loor2011).
Two mammary gland metabolic pathways identified by IPA, with the highest level of significance in response to GH treatment, were cell death (e.g. IGFBP5, FOXO3A and CD14) and cellular growth and proliferation (e.g. BCL2, COL1A1), indicating proteins encoded by these mRNAs may influence cell number and/or maintenance of secretory cell number as previously reported (Capuco et al., Reference Capuco, Wood, Baldwin, Mcleod and Paape2001). The exact role of the proteins encoded by IGFBP5, FOXO3A, CD14, BCL2, COL1A1 mRNAs in the lactating bovine mammary gland are yet to be elucidated. However, BCL2 has been shown to regulate the balance between cell proliferation and apoptosis during early lactation in the dairy cow mammary gland (Colitti et al., Reference Colitti, Wilde and Stefanon2004) and IGFBP5 has been shown to regulate apoptosis and extra-cellular matrix remodelling in the rodent mammary gland (Flint et al., Reference Flint, Boutinaud, Tonner, Wilde, Hurley, Accorsi, Kolb, Whitelaw, Beattie and Allan2005). Thus, increased abundance of IGFBP5 and BCL2 mRNA may suggest higher rates of apoptosis, and thus cell turnover in the mammary glands of GH-treated cows.
The effect of GH on the abundance of mRNAs encoding proteins belonging to a range of metabolic pathways, notably lipid (e.g. FABP2, LPL, FADS2, FABP3, CD36), amino acid (GLS) and carbohydrate (e.g. PGK1, UGP2, SAT1) metabolism is consistent with previous reports (Bionaz and Loor, Reference Bionaz and Loor2008), potentially underpins the galactopoietic effect of GH in the lactating dairy cow and the effect of GH in other tissues (Angelin and Rudling, Reference Angelin and Rudling1994).
Consistent with previously reported effects of GH, IPA analysis of microarray results from this study suggests that GH is a positive regulator of cell growth, differentiation and immune cell migration (Wiedermann et al., Reference Wiedermann, Reinisch and Braunsteiner1993). The ability of GH to stimulate actin reorganization (Goh et al., Reference Goh, Pircher, Wood, Norstedt, Graichen and Lobie1997), and microtubule polymerization (Goh et al., Reference Goh, Pircher and Lobiem1998) and cell motility (Diakonova et al., 2002) highlights the importance of the cytoskeleton in the regulation of some GH-dependent cellular functions. The cytoskeleton may also play a role in the regulation of GH-dependent gene expression (Janmey, Reference Janmey1998). A variety of proteins that are involved in the regulation of the cytoskeleton are recruited to JAK2/GHR complexes and/or activated in response to GH (Zhu et al., Reference Zhou, Akers and Jiang1998). Further, GHR/JAK2/STAT5-mediated transcription is reported to be modulated by actin cytoskeleton disruption (Rico-Bautista et al., Reference Rico-Bautista, Negrin-Martinez, Novoa-Mogollon, Fernandez-Perez and Flores-Morales2004). Thus, it is not surprising that GH had a strong influence on the mRNA abundance of genes involved in actin cytoskeleton signalling in the mammary gland. Although this study highlights a number of genes potentially involved in the actin cytoskeleton-mediated effects of GH, the functional roles of these genes in the mammary gland during lactation remain to be characterized.
The most abundant amino acids in milk protein are glutamine and glutamic acid, and mammary uptake of each amino acid from plasma is not sufficient to meet the needs of milk protein synthesis. Bequette et al. (Reference Bequette, Owens, El-Kadi, Sunny and Shamay2005) reported that 79% to 95% of glutamate and glutamine was synthesized de novo from catabolism of threonine, valine and isoleucine in a step wise process that ends with glutamic acid conversion to glutamine. In response to GH treatment, we observed increased GLS mRNA abundance, whose encoded protein converts glutamine into glutamic acid. Interestingly, GLS mRNA abundance was negatively correlated with the yield of total milk protein and individual milk proteins suggesting that increased milk protein synthesis by the mammary gland is associated with a reduction in GLS mRNA abundance. The potential role of GLS in the regulation of milk protein synthesis is unclear but warrants further investigation.
Increased mRNA abundance of the membrane-associated transporter ABCG2 was positively correlated with the yield of total milk protein, each of the individual milk proteins and milk fat and lactose. These observations suggest that the ABCG2 transporter protein may play an important role in the GH-induced increase in milk yield and the yield of the individual milk components. ABCG2 mRNA is highly abundant in the lactating bovine mammary gland (Mani et al., Reference Mani, Sorensen, Sejrsen, Bruckmaier and Albrecht2009), and its potential importance for milk synthesis has been highlighted previously (Bionaz and Loor, Reference Bionaz and Loor2008). For example, milk yield, milk fat and protein concentrations in cattle are affected by a missense mutation in the ABCG2 gene (Cohen-Zinder et al., Reference Cohen-Zinder, Seroussi, Larkin, Loor, Everts-van der Wind, Lee, Drackley, Band, Hernandez, Shani, Lewin, Weller and Ron2005) which suggests a functional role during lactation. A role for the ABCG2 transporter protein in the secretion of important components of milk has also been suggested (van Herwaarden et al., Reference van Herwaarden, Wagenaar, Merino, Jonker, Rosing, Beijnen and Schinkel2007). However, with the exception of riboflavin (van Herwaarden et al., Reference van Herwaarden, Wagenaar, Merino, Jonker, Rosing, Beijnen and Schinkel2007) which components of milk are influenced by GH remain unclear. Further studies are warranted to determine the function of this gene in the bovine mammary gland during lactation.
Milk yield and the yield of the major milk components (fat, protein and lactose) were positively correlated with the abundance of LPL mRNA, suggesting that GH stimulates fatty acid uptake from the blood (Fielding and Frayn, Reference Fielding and Frayn1998), consistent with the observed increase in milk fat yield in these animals (Hayashi et al., Reference Hayashi, Nones, Roy, McNabb, McKenzie, Pacheco and McCoard2009). The positive correlation between SLC34A2 mRNA abundance and the yield of milk, protein, lactose and fat is suggestive of increased milk output. Interestingly, the mammary gland of lactating dairy cows show heterogeneity in the proportion of differentiated, actively secreting cells (Molenaar et al., Reference Molenaar, Davis and Wilkins1992), and SLC34A2 protein is a marker of differentiated milk-secreting mammary alveolar cells in mice (Shillingford et al., Reference Shojaiefard and Lang2003). In addition, the protein encoded by SLC34A2, which is a sodium dependent membrane transporter that imports phosphate into the cell, is activated by the nutrient sensing mTOR protein in Xenopus ooyctes (Shojaiefard and Lang, Reference Sciascia, Pacheco and McCoard2006). In a companion study by our group we have shown GH treatment increases the abundance of mTOR protein in the mammary gland (Sciascia et al., Reference Shillingford, Miyoshi, Robinson, Bierie, Cao, Darin and Hennighausen2013). Therefore, it is tempting to speculate that GH may induce the activation of these ‘dormant’ areas of secretory tissue, via mTOR-SLC34A2 signalling leading to the observed increase in milk output. This potential mechanism warrants further investigation.
Conclusions
In conclusion, the galactopoietic effect of GH in the bovine mammary gland during lactation was characterized by the increased abundance of genes involved in several pathways including cell growth and proliferation, transcriptional and translational regulation, actin cytoskeleton signalling, lipid metabolism and cell death. This study has generated new knowledge of the effect of GH on mammary cell signalling pathways during established lactation in the dairy cow.
Acknowledgements
This research was conducted as part of a Joint Venture between AgResearch Limited and Primary Industries Research Victoria and was funded by the Ministry of Business, Innovation, and Employment (C10×0702) and AgResearch Initiative Funds, a Ministry of Business, Innovation, and Employment Postdoctoral Fellowship (Dr McCoard), the Marsden Fast Start Fund (Dr McCoard) and by CAPES PhD scholarship (Amanda Hayashi) and The National Council for Scientific and Technological Development – CNPq Post-doctoral Scholarship (Dr Nones) from the Federal Government of Brazil. The authors sincerely thank Kate Broadley, Jason Peters, Bryan Treloar, Theresa Wilson, Diane Hyndman and Steve Davis for their technical support and advice, and Peter Schreurs, Andrea Death, Matt Deighton, Clare Reynolds, Ann-Charlotte Pupin and Jenifer Lane for assistance with the animal experiment. The authors also thank David Baird for assistance with statistical analysis, Alan McCulloch for database support and Deborah Simon for bioinformatics support.
Supplementary Material
To view supplementary material for this article, please visit http://dx.doi.org/10.1017/S1751731116000987