



Nomenclature
- Δf
-
effective detector noise bandwidth (Hz)
- Ab
-
background-emitting area subtended by IFOV at range R (m2)
- At
-
projected solid-surface radiating area of target (m2)
- At,g
-
effective projected gas-phase (plume) radiating area (m2)
- At,s
-
projected solid-surface radiating area of solid surface (m2)
- B
-
band-integrated background radiometric coefficient
- C
-
system constant grouping seeker hardware parameters
- Do
-
effective optical aperture diameter (m)
- D*
-
detector specific detectivity (
 $\text{m} \cdot \sqrt{\text{H}}\text{z} \cdot \text{W}^{-1}$
)
- F(R;θ)
-
implicit detection function
- F#
-
optical system f-number
- J0
-
range-independent contrast offset
- Jb(R)
-
background radiant intensity collected within IFOV at range R(W·sr−1)
- Jt
-
total band-integrated target radiant intensity(W·sr−1)
- Jt,g
-
gas-phase contribution to target radiant intensity(W·sr−1)
- Jt,s
-
solid-surface contribution to target radiant intensity(W·sr−1)
- K
-
gas-to-solid radiation ratio parameter
- Lt,g
-
gas-phase band-averaged radiance (W·m−2·sr−1)
- Lt,s
-
solid-surface band-averaged radiance (W·m−2·sr−1)
- MΔ,λ(T)
-
band-integrated blackbody hemispherical radiant exitance (W·m−2)
- R
-
lock on/detection range (km)
- SR,x
-
logarithmic sensitivity of detection range to parameter x,
- TB
-
background temperature (K)
- Tt
-
target temperature (K)
- Tt,g
-
gas-phase temperature (K)
- Tt,s
-
solid-surface temperature (K)
- CFD
-
computational fluid dynamics
- IFOV
-
instantaneous field of view
- IRST
-
infrared search and track
- MWIR
-
mid-wave infrared (3–5
$\unicode{x03BC}$
m) - LWIR
-
long-wave infrared (8–12
$\unicode{x03BC}$
m) - NPR
-
nozzle pressure ratio
- SNR
-
signal-to-noise ratio


Greek symbol
- α
-
band-averaged atmospheric extinction coefficient (km−1)
- εb
-
band-averaged background emissivity
- εt,s
-
band-averaged solid-surface emissivity
- εt,g
-
band-averaged effective gas-phase emissivity
- ω
-
instantaneous field-of-view (IFOV) solid angle (sr)
- θ
-
parameter set characterising the seeker–target–environment system
- λ
-
wavelength
-
${\tau _0}$
-
combined optical transmittance of the seeker assembly

1.0 Introduction
Infrared (IR) guided missiles and infrared search-and-track (IRST) systems continue to pose a significant threat to military aircraft despite decades of advances in countermeasures and signature-reduction technologies. Unlike radar-based systems, infrared seekers operate passively and do not require target illumination. This makes them inherently difficult to detect and counter. They are increasingly becoming the primary combat weapon [Reference Huang, Tong, Li, Jia and Li1]. Over the past two decades, developments in detector materials, large-format focal plane arrays and onboard signal processing have improved seeker sensitivity, spatial discrimination and robustness against clutter within the mid-wave infrared (MWIR) and long-wave infrared (LWIR) atmospheric windows [Reference Argirusis, Achilleos, Alizadeh, Argirusis and Sourkouni2]. These improvements have enabled reliable detection and tracking under a wider range of engagement conditions, even though overall performance increasingly depends on system-level and environmental limitations. Consequently, aircraft survivability is strongly influenced by how effectively its infrared radiation can be controlled and managed.
The infrared signature of an aircraft, which ultimately governs this observability, arises from multiple contributors, including hot engine components, exhaust plume radiation and emission and reflection from external surfaces [Reference Mahulikar, Sonawane and Rao3]. The combined intensity of these sources is a function of the engine operating condition, flight Mach number, altitude and viewing aspect [Reference Mahulikar, Rastogi and Bhatt4, Reference Bhatt and Mahulikar5]. As this emitted radiation propagates toward a seeker, it is significantly modified by the environment; atmospheric transmission reduces the target signal through absorption and scattering, while atmospheric self-radiance contributes to the background noise [Reference Huang, Tong, Li, Jia and Li1, Reference Rao6]. Consequently, the power received by the sensor is not a simple linear reflection of the source strength, but the result of a complex interaction between the target signature and the intervening medium.
In an engagement context, aircraft vulnerability is commonly quantified by the lock-on range (or detection range), defined as the maximum distance at which an infrared seeker can reliably acquire and track a target with a prescribed signal-to-noise ratio [Reference Rao and Mahulikar7, Reference Mahulikar, Vijay, Potnuru and Reddam8]. Minimising this range is therefore a central objective of survivability design. This objective follows directly from basic radiometric considerations, whereby reduced emitted infrared power lowers the distance at which the received signal surpasses the detection threshold. Accordingly, established infrared suppression strategies like exhaust cooling [Reference Yang, Zheng and Zhang9–Reference Zhang, Lin, Zhang, Yang and Ji11], nozzle shaping [Reference Sun, Wang, Zhou, Shi and Liu12–Reference Jeong, Choi, Kweon, Choi and Kim16] and advanced coatings [Reference Chen, Hui, Song, Gao, Shi and Yang17–Reference Han, Tariq, Wang, Xiong, Zhang, Shi, Pang and Cui19] primarily aim to reduce the apparent radiant intensity of the aircraft. The implicit design expectation is that a reduction in source strength translates into a corresponding contraction of the detection boundary.
While intuitive, this assumption represents a simplification of the detection process. Lock-on is governed not by emitted intensity alone, but by the infrared power received at the seeker after geometric spreading, atmospheric attenuation and interaction with the radiative background, relative to the minimum detectable signal defined by the sensor [Reference Wu and Yi20]. These combined effects introduce an inherent nonlinearity between the apparent infrared intensity of the source and the resulting lock-on distance.
Despite this understanding, much of the infrared signature reduction literature evaluates survivability gains primarily in terms of reductions in apparent intensity or contrast, without explicitly examining how these reductions map onto lock-on range under realistic atmospheric and sensor-limited conditions. In operational environments where the atmospheric optical depth becomes appreciable, exponential attenuation can dominate over source strength, potentially leading to diminishing returns from further intensity reduction. The conditions under which infrared signature suppression remains effective, and those under which atmospheric or detector limitations govern lock-on range, have not been systematically clarified.
The present study addresses this gap from a theoretical perspective by revisiting the infrared lock-on range equation and examining its closed-form structure. Using a simplified but physically representative model for target emission, together with standard representations of atmospheric extinction and sensor sensitivity, the work investigates how reductions in apparent infrared intensity influence performance across different regimes. By explicitly isolating the roles of source strength, atmospheric attenuation and seeker sensitivity, the analysis provides a clearer theoretical basis for interpreting infrared signature reduction efforts in propulsion system design and aircraft survivability assessment.
The present study is structured into four parts. First, a physically representative model for the infrared source intensity is developed. This is followed by the formulation of the detection range equation based on radiometric signal-to-noise considerations. The analytical framework is then extended to examine the sensitivity of the detection range to variations in key physical and system parameters. Finally, representative numerical evaluations are performed using parameters corresponding to contemporary infrared search and track (IRST) systems and missile seekers.
Before proceeding, it is important to clarify the terminology adopted in this work. While the transition from initial detection to a stable track (lock-on) involves additional algorithmic and guidance-level processes, both are fundamentally constrained by the same underlying radiometric signal-to-noise requirement. In the present analytical framework, which isolates the radiometric component of the problem, a single threshold condition is imposed. Accordingly, the terms ‘detection range’ and ‘lock-on range’ are used interchangeably to denote the maximum distance at which the prescribed signal-to-noise criterion is satisfied.
2.0 Source representation and modelling assumptions
The detection-range analysis requires specification of an effective infrared source strength associated with the aircraft exhaust system. Detailed predictions via coupled computational fluid dynamics (CFD) and spectral radiation modelling [Reference Heragu, Rao and Raghunandan21–Reference Huang and Ji24] are computationally intensive and introduce complexity unwarranted for first-order survivability assessment. The objective here is to examine the fundamental scaling behaviour of lock-on range without requiring detailed resolution of spectral or spatial features. Accordingly, a reduced-order source representation is adopted that preserves the leading-order contribution relevant to detection.
2.1 Aggregate infrared source representation
Infrared radiation from aircraft propulsion systems arises from physically distinct mechanisms as discussed previously. In the MWIR band considered here, the dominant contributors include broadband thermal emission from hot engine and nozzle surfaces, along with spectrally selective molecular emission from combustion gases such as (CO2, H2O) in the exhaust plume [Reference Soufiani and Taine25].
Although these mechanisms differ fundamentally in physical origin, an infrared seeker does not distinguish between them. The sensor integrates received radiation spectrally over its operating band and spatially within its instantaneous field of view (IFOV). Detectability is therefore governed solely by the total band-integrated radiant intensity collected by the seeker. From the sensor’s perspective, the propulsion system appears as an unresolved aggregate infrared source.
Accordingly, the total band-integrated radiant intensity of the target is modeled as the sum of effective solid-surface and gas-phase contributions, and is given as
 \begin{align}{J_t} = {J_{t,s}} + {J_{t,g}}\end{align}
where
 ${J_{t,s}}$
denotes radiation from hot solid surfaces (primarily the nozzle and adjacent hardware), and
 ${J_{t,g}}$
denotes the effective contribution of exhaust gas radiation.
Each contribution is expressed in standard radiometric form by separating band-averaged radiance from projected area,
 \begin{align}{J_{t,s}} = {L_{t,s}}\,{A_{t,s}} = \frac{{{\varepsilon _{t,s}}{M_{{\rm{\Delta }}\lambda }}( {{T_{t,s}}} )}}{\pi }\,\,{A_{t,s}}\end{align}
 \begin{align}{J_{t,g}} = {L_{t,g}}\,{A_{t,g}} = \frac{{{\varepsilon _{t,g}}{M_{{\rm{\Delta }}\lambda }}( {{T_{t,g}}} )}}{\pi }\,\,{A_{t,g}}\end{align}
Here
 ${M_{{\rm{\Delta }}\lambda }}\left( T \right)$
denotes the band-integrated blackbody hemispherical radiant exitance (W·
 ${{\rm{m}}^{ - 2}}$
). For a graybody of emissivity
 $\varepsilon $
, the corresponding band-averaged radiance under the Lambertian assumption is
 ${L_{{\rm{\Delta }}\lambda }}\left( T \right) = \varepsilon {M_{{\rm{\Delta }}\lambda }}\left( T \right)\!/\pi $
.
The projected area
 $A$
represents the apparent radiating area as viewed by the seeker along a given line of sight. For solid surfaces,
 ${A_{t,s}}$
corresponds to a true geometric projection. In contrast, for the exhaust plume,
 ${A_{t,g}}$
is an effective projected area that represents the volumetric radiative source as an equivalent unresolved emitter, incorporating the combined effects of geometric extent, optical depth and spatial radiance distribution.
This distinction arises from the fundamentally different nature of solid and gas-phase radiation. Solid-surface emission is governed by well-defined boundary conditions, including surface temperature, emissivity and geometry. Exhaust plume radiation, however, originates from a participating medium and depends on the integrated temperature and species distribution along the line of sight, making direct evaluation of
 ${J_{t,g}}$
inherently more complex.
Accordingly, the emissivity
 ${\varepsilon _{t,s}}$
represents a true band-averaged surface property, with rear-aspect cavity effects potentially increasing the apparent emissivity of the nozzle exit. For exhaust gases,
 ${\varepsilon _{t,g}}$
is an equivalent, path-dependent parameter that captures the net in-band radiative contribution of molecular emission, including the effects of spectral band structure, finite optical thickness and viewing geometry. This formulation provides a compact representation of plume radiation suitable for detection-range analysis without implying blackbody-like gas emission. Experimental radiometric measurements are used to establish representative magnitudes for the solid-surface and gas-phase contributions in the next section.
2.2 Experimental facility and radiometric characterisation
Radiometric measurements conducted at the author’s Reacting Flow Nozzle Test Facility provide an empirical basis for assessing the relative magnitudes of the solid-surface and gas-phase radiance contributions,
 ${L_{t,s}}\;$
and
 ${L_{t,g}}$
. This facility enables scaled experimental investigation of aircraft exhaust nozzles under controlled reacting-flow conditions, reproducing representative turbine-exit parameters, including total pressure, total temperature and combustion-product concentrations (CO2, H2O), consistent with modern engine operation. A detailed description of the facility is available in prior work (Reference Durai, Mannari, Bokade, Jain and Chindesh26).
2.2.1 Experimental conditions and instrumentation
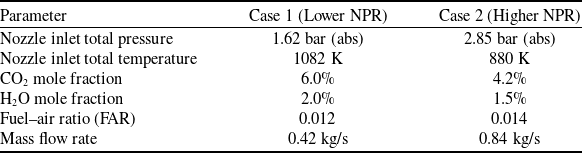
Experiments were performed using a circular nozzle. A vitiation heater was employed to generate reacting exhaust flows with controlled thermochemical properties. Two operating regimes were examined: a lower NPR representative of subsonic exhaust, and a higher NPR condition corresponding to moderately under-expanded flow exhibiting shock-cell structure. The corresponding operating parameters are summarised in Table 1.
Experimental operating parameters for reacting-flow nozzle tests

Table 1. Long description
A table comparing operating parameters for reacting-flow nozzle tests under two different conditions. The table has two columns and seven rows. The columns are labeled Case 1 (Lower NPR) and Case 2 (Higher NPR). The rows are labeled with different parameters: Nozzle inlet total pressure, Nozzle inlet total temperature, CO2 mole fraction, H2O mole fraction, Fuel-air ratio (FAR), and Mass flow rate. Row 1: Nozzle inlet total pressure, 1.62 bar (abs), 2.85 bar (abs). Row 2: Nozzle inlet total temperature, 1082 K, 880 K. Row 3: CO2 mole fraction, 6.0 percent, 4.2 percent. Row 4: H2O mole fraction, 2.0 percent, 1.5 percent. Row 5: Fuel-air ratio (FAR), 0.012, 0.014. Row 6: Mass flow rate, 0.42 kg/s, 0.84 kg/s.
Radiometric measurements were acquired using a FLIR X6800SC MWIR camera. It was positioned in a side-view configuration approximately 1 m from the nozzle exit plane.
2.2.2 Experimental results and observation
Representative band-integrated MWIR radiance maps for the two operating conditions are shown in Fig. 1, where each pixel represents the local in-band radiance intensity (W m−2 sr−1). Panels (a) and (b) are displayed using the full dynamic range required to capture the radiance field arising from both hot solid surfaces and exhaust gases, while panels (c) and (d) show the corresponding pixel-wise radiance distributions after masking pixels associated with the nozzle hardware and re-plotting the remaining data on a reduced scale to isolate gas-phase plume radiation.
Band-integrated mid-wave infrared (MWIR, 3–5 µm) radiance maps of the reacting nozzle flow. (a) Full dynamic-range radiance field for Case 1 (lower NPR), showing dominant emission from nozzle hardware. (b) Full dynamic-range radiance field for Case 2 (higher NPR). (c) Case 1 radiance field after masking solid-surface pixels and rescaling to emphasise gas-phase plume emission. (d) Corresponding masked and rescaled radiance field for Case 2, revealing shock-cell structure in the underexpanded plume.

For the lower nozzle pressure ratio (NPR) condition (Case 1), panel (a) shows intense, spatially compact emission originating from the nozzle exit and internal hardware, with peak band-integrated radiance levels approaching 3500 W m−2 sr−1. On the same scale, the exhaust plume appears comparatively weak and spatially diffuse. When pixels associated with the solid surfaces are masked, and the remaining radiance field is re-plotted (panel (c)), the plume radiation is clearly resolved, exhibiting peak band-integrated radiance levels on the order of 350 W m−2 sr−1.
The comparatively lower plume radiance observed over the 3–5
 $\unicode{x03BC}$
m band arises from the spectral characteristics of gas-phase emission, which is concentrated within discrete molecular bands. In contrast, solid surfaces emit broadband thermal radiation continuously across this entire band, resulting in a larger band-integrated radiative contribution. If the observation were instead restricted to a narrow spectral region coinciding with a strong molecular band, such as a filter centred near 4.2
 $\unicode{x03BC}$
m for CO2, the local radiance from the high-temperature plume gas would be substantially enhanced, thereby increasing the contribution of gas-phase emission relative to that of the solid surfaces.
A similar overall radiance pattern is observed for the higher NPR condition (Case 2). On the full dynamic-range display (panel (b)), emission from the nozzle hardware again constitutes the highest local radiance within the field of view. However, the peak solid-surface radiance is reduced relative to Case 1, consistent with the lower nozzle hardware temperature in Case 2, despite the higher-pressure ratio and mass flow rate.
After masking the nozzle hardware and re-plotting the remaining radiance field on a reduced scale (panel (d)), the exhaust plume is clearly resolved and exhibits a spatially periodic radiance structure characteristic of shock-cell formation in an underexpanded jet. Although localised radiance enhancements associated with shock structures are present, the peak plume radiance remains lower than that observed in Case 1, reflecting the combined effects of reduced inlet temperature and increased dilution by combustion products.
Taken together, the experimental radiance maps show the distinct but complementary roles of radiance magnitude and projected area in determining the total infrared source strength. While the radiance of the solid nozzle hardware exceeds that of the exhaust plume by approximately an order of magnitude under the present conditions (
 ${L_{t,s}} \approx 8\sim 10\,{L_{t,g}}$
), the plume occupies a substantially larger projected area within the sensor field of view (
 ${A_{t,g}} \gg {A_{t,s}}$
). Consequently, despite lower radiance per pixel, the plume contributes significantly to total intensity
 ${J_t}$
through area integration, a bulk effect difficult to compute but straightforward to measure.
2.3 Reduced-order plume parameterisation
Direct evaluation of the gas-phase contribution
 ${J_{t,g}}$
via coupled flow field–radiation modelling lies beyond the scope of system-level lock-on analysis. The experimental results, however, motivate a key simplification: for a given operating condition and viewing geometry, the ratio of gas-phase to solid-surface contributions is directly observable and repeatable.
We therefore introduce a dimensionless parameter
 $K$
, defined as the ratio of band-integrated gas-phase radiation to solid-surface radiation,
 \begin{align}{J_{t,g}} = K\,{J_{t,s}}\end{align}
The parameter
 $K$
serves as a compact surrogate for the integrated effects of plume temperature, composition, optical depth and viewing geometry. Importantly,
 $K$
is not introduced as a tuning constant but as an analysis parameter that enables systematic exploration of plume influence within a reduced-order framework. For the experimental conditions considered here, measured values lie in the range
 $K \approx 0.1{\rm{-}\!{-}}0.5$
. For untested conditions, physically meaningful bounds may be defined, spanning the plume-transparent limit (
 $K \to 0$
) to plume-dominated regimes (
 $K \gg 1$
).
Substituting Equation (4) into Equation (1) yields the reduced-order aggregate source model intensity, as given by Equation (5).
 \begin{align}{J_t} = \left( {1 + K} \right)\frac{{{\varepsilon _{t,s}}{M_{{\rm{\Delta }}\lambda }}( {{T_{t,s}}} )}}{\pi }\,{A_{t,s}}\end{align}
With the target source represented in the compact form of Equation (5), the detection problem reduces to determining the range R at which the radiometric contrast between the aggregate target and the background yields an SNR equal to the prescribed detection threshold. For notational clarity in the remainder of the paper, the subscript (t,s), used to denote solid-surface quantities, will be omitted and replaced with only the subscript (t).
3.0 Detection range equation
With the target source characterised in Section 2, we now determine how this radiation is perceived by a passive infrared seeker in an engagement scenario. Consider a seeker observing the target against a uniform background at a temperature
 ${T_b}$
. At the engagement ranges of interest, the target is assumed to be unresolved, such that its angular extent remains smaller than the seeker’s IFOV. Under these conditions, the detector integrates radiation over the entire IFOV, and detection is governed by the radiometric contrast between the target intensity and the background collected within that solid angle.
Detection is defined as the condition under which the received signal-to-noise ratio (SNR) reaches a prescribed threshold. As radiation propagates from the target to the seeker, it undergoes geometric spreading and atmospheric attenuation. The latter is modeled using the Beer–Lambert law with a band-averaged extinction coefficient α. The objective is therefore to determine the range at which the attenuated target–background contrast produces the required SNR.
3.1 Radiometric signal formation
Under these conditions, the irradiance at the detector is proportional to the apparent radiant intensity contrast between the target and the background integrated over the IFOV. To quantify this contrast, we first determine the background contribution collected within the same solid angle.
The background-emitting area subtended by the IFOV at range
 $R$
is
 \begin{align*}{A_b}\left( R \right) = \omega {R^2} - {A_t}\end{align*}
where
 $\omega $
is the IFOV solid angle and
 ${A_t}$
is the projected target area appearing in Equation (5), with the solid-surface subscript suppressed for clarity.
The corresponding background radiant intensity in the MWIR band is:
 \begin{align*}{J_b}\left( R \right) = {{{\varepsilon _b}{M_{{\rm{\Delta }}\lambda }}\left( {{T_b}} \right)} \over \pi }\left( {\omega {R^2} - {A_t}} \right) \equiv B\left( {\omega {R^2} - {A_t}} \right)\end{align*}
where
 ${\varepsilon _b}\;$
is the band-averaged background emissivity, and
 ${M_{{\rm{\Delta }}\lambda }}\left( {{T_b}} \right)$
denotes the band-integrated blackbody hemispherical radiant exitance. The coefficient
 $B$
defined below collects all range-independent background radiometric terms.
 \begin{align*}\begin{array}{*{20}{c}}{} {}{B \equiv \dfrac{{{\varepsilon _b}{M_{{\rm{\Delta }}\lambda }}\left( {{T_b}} \right)}}{\pi }} {}{} {}{}\end{array}\end{align*}
The net radiometric contrast at the aperture is therefore:
 \begin{align*}{\rm{\Delta }}J\left( R \right) = {J_t} - {J_b}\left( R \right)\end{align*}
After propagation through the atmosphere, the contrast is attenuated according to the Beer–Lambert law:
 \begin{align}{\rm{\Delta }}{J_{{\rm{atm}}}}\left( R \right) = \left[ {{J_t} - {J_b}\left( R \right)} \right]{e^{ - \alpha R}}\end{align}
3.2 Detection range equation
The attenuated radiometric contrast derived above represents the net radiant intensity difference incident on the seeker aperture. This contrast generates a detector output signal whose magnitude scales with the effective aperture area and decays with range due to geometric spreading. For a diffraction-limited optical system, the SNR may therefore be written in compact form as
 \begin{align*}{\rm{SNR}}\!\left( R \right) = {{\pi {D_0}{\tau _0}{D^{\rm{*}}}} \over {4F\# \sqrt {\omega {\rm{\Delta }}f} }}\,\,{{\left[ {{J_t} - {J_b}\left( R \right)} \right]{e^{ - \alpha R}}} \over {{R^2}}}\end{align*}
Detection occurs when,
 \begin{align*}{\rm{SNR}}\!\left( R \right) = {\rm{SN}}{{\rm{R}}_{{\rm{req}}}}\end{align*}
Rearranging the above-mentioned condition to solve for the spatial limit yields the detection range equation [Reference Wu and Yi20, Reference Gaitanakis, Vlastaras, Vassos, George and Zikidis27]:
 \begin{align}{R^2} = {{\pi {D_0}{\tau _0}{D^*}} \over {4F\# \sqrt {\omega {\rm{\Delta }}f} \,\,\,{\rm{SN}}{{\rm{R}}_{{\rm{req}}}}}}\left[ {{J_t} - {J_b}\left( R \right)} \right]{e^{ - \alpha R}}\end{align}
To isolate the influence of seeker hardware from environmental and target variables, we define the system-dependent constant C:
 \begin{align*}C = {{\pi {D_0}{\tau _0}{D^{\rm{*}}}} \over {4F\# \sqrt {\omega {\rm{\Delta }}f} \,\,{\rm{SN}}{{\rm{R}}_{{\rm{req}}}}}}\end{align*}
Using this constant, the detection condition simplifies to the following compact expression:
 \begin{align}{R^2} = C\,\left[ {{J_t} - {J_b}\left( R \right)} \right]\,{\rm{exp}}\left( { - \alpha R} \right)\;\;\;\;\;\;\end{align}
where the hardware parameters are defined as:
-
D 0 is the effective optical aperture diameter (m),
-
τ 0 is the combined optical transmittance of the seeker assembly (–),
-
D* is the detector specific detectivity
$(\text{m} \cdot \!\sqrt{} \text{Hz/W})$
, -
F# is the optical system f-number (–),
-
ω is the instantaneous field-of-view (sr),
-
Δf is the effective noise bandwidth (Hz), and
-
SNRreq is the required detection threshold (–).

3.3 Implicit detection range equation
To reveal the structural constraints of the detection problem, the background intensity expression
 $\;{J_b}( R ) = B( {\omega {R^2} - {A_t}} )$
is substituted into range Equation (8) derived in Section 3.2. To consolidate the invariant source terms, we introduce the range-independent contrast offset,
 ${J_0} \equiv {J_t} + B{A_t}$
which aggregates the intrinsic target radiant intensity and the restitution of the background area occluded by the target within the IFOV.
Substitution into the range relation yields the transcendental detection equation
 \begin{align*}{R^2} = C\left( {{J_0} - B\omega {R^2}} \right){e^{ - \alpha R}}\end{align*}
Rearranging all terms to one side defines the implicit detection range equation
 \begin{align}F\left( {R;\,\theta } \right) = {R^2} - C\left( {{J_0} - B\omega {R^2}} \right){e^{ - \alpha R}} = 0\end{align}
where the parameter set
 $\theta = \left\{ {C,{J_0},B,\omega ,\alpha } \right\}$
fully characterises the seeker–target–environment system.
Because the range
 $R$
appears simultaneously as a quadratic term and within an exponential attenuation factor, the detection equation is transcendental and admits no closed-form solution in elementary functions. The detection range must therefore be obtained numerically for specified parameter sets. Beyond its role in numerical prediction, however, the implicit structure of the equation reveals fundamental constraints on detectability. These structural constraints and their implications for system design and target signature management are examined analytically in the following section.
4.0 Structural limits and sensitivity of the detection range equation
The structural constraints embedded in the detection equation led to an important and often counterintuitive conclusion. These structural constraints give rise to what may be viewed as the fundamental paradox of missile seeker and IRST performance: strong mathematical sensitivity does not necessarily translate into operational advantage.
This section examines the structure of the implicit detection equation derived in Section 3.3 to determine the conditions it fundamentally permits and constrains. The analysis reveals when detection is feasible, when it is sensitive to variations in target and system parameters and when environmental or geometric effects impose dominant limits independent of sensor performance.
The analysis proceeds in two stages. First, a background-limited feasibility condition is derived, establishing a hard geometric contrast limit independent of sensor gain and atmospheric attenuation. Second, assuming this feasibility condition is satisfied, an analytical sensitivity analysis based on implicit differentiation quantifies how the detection range responds to variations in target and system parameters. Together, these results clarify when design optimisation can influence detection outcomes and when such efforts are rendered ineffective by the environment.
4.1 The contrast-limited feasibility boundary
The implicit detection equation (Equation (9)) derived in Section 3.3 contains an inherent feasibility constraint that is independent of sensor gain and atmospheric attenuation. For a physically admissible solution to exist, the contrast term must remain positive:
 \begin{align*}{J_0} - B\omega {R^2} \gt 0\end{align*}
This condition yields an absolute upper bound on range:
 \begin{align}R \lt \sqrt {\frac{{{J_0}}}{{B\omega }}} \end{align}
This bound arises from the quadratic growth of the background accumulation term
 $B\omega {R^2}$
, which represents the radiance integrated over the sensor’s instantaneous field of view. Because this term increases with
 ${R^2}$
while the target contribution
 ${J_0}$
remains range-independent, there exists a finite distance beyond which spatial contrast vanishes. At this point, no increase in the system constant
 $C$
can recover detectability.
Importantly, this contrast-limited ceiling is independent of atmospheric extinction. Even in the limiting case
 $\alpha \to 0$
, the inequality remains unchanged. The bound is therefore geometric and radiometric in origin, determined solely by
 $\left( {{J_0},B,\omega } \right)$
.
4.2 Analytical sensitivity framework
The contrast condition derived above establishes the requirement for a physically admissible detection range. However, feasibility alone does not characterise system behaviour. Within the admissible domain where
 $F\left( {R;\,\theta } \right) = 0$
admits a real solution, the detection range remains implicitly defined by the governing constraint introduced in Equation (9). The relevant design question then becomes one of responsiveness: how does this implicitly defined range vary with changes in source intensity, system gain or atmospheric attenuation?
To quantify this behaviour, we differentiate the implicit constraint with respect to any parameter
 $x \in \theta $
, while holding all other parameters fixed. Application of implicit differentiation yields
 \begin{align*}\frac{{\partial R}}{{\partial x}} = - \,\frac{{\partial F/\partial x}}{{\partial F/\partial R}}\end{align*}
To facilitate physical interpretation across parameters of differing scales and units, these results are expressed in logarithmic form. The logarithmic sensitivity of the detection range with respect to the parameter
 $x$
is defined as
 \begin{align}{S_{R,x}} \equiv \frac{{\partial {\rm{ln}}\,R}}{{\partial {\rm{ln}}\,x}} = \frac{x}{R}\frac{{\partial R}}{{\partial x}}\end{align}
This quantity represents the fractional change in detection range resulting from an infinitesimal fractional change in the parameter
 $x$
, evaluated at a specified operating point. Although formally a local (linearised) measure, it provides direct insight into the instantaneous leverage available for performance modification within a given operational regime.
4.3 General sensitivity to the target intensity and the system gain
Applying the analytical framework developed in Section 4.2 to the specific parameters of interest, we now evaluate the sensitivity of the detection range to variations in target radiant intensity (
 ${J_t}$
) and system constant
 $(C$
). The required partial derivatives of the governing constraint are:
 \begin{align*}\frac{{\partial F}}{{\partial {J_t}}} = - C{e^{ - \alpha R}}\end{align*}
 \begin{align*}\frac{{\partial F}}{{\partial C}} = - \left( {{J_t} - {J_b}\left( R \right)} \right){e^{ - \alpha R}}\end{align*}
 \begin{align*}\frac{{\partial F}}{{\partial R}} = 2R + C{e^{ - \alpha R}}\left[ {2B\omega R + \alpha \left( {{J_t} - {J_b}\left( R \right)} \right)} \right]\end{align*}
By substituting these into the logarithmic sensitivity definition (Equation 11), we arrive at the general expressions for range responsiveness:
 \begin{align}{S_{R,{J_t}}} = \frac{{{J_t}}}{R}\frac{{C{e^{ - \alpha R}}}}{{2R + C{e^{ - \alpha R}}\left[ {2B\omega R + \alpha \left( {{J_t} - {J_b}\left( R \right)} \right)} \right]}}\end{align}
 \begin{align}{S_{R,C}} = \frac{{{J_t} - {J_b}\left( R \right)}}{R}\frac{{C{e^{ - \alpha R}}}}{{2R + C{e^{ - \alpha R}}\left[ {2B\omega R + \alpha \left( {{J_t} - {J_b}\left( R \right)} \right)} \right]}}\end{align}
Equations (12) and (13) show that detection-range sensitivity emerges from a complex interplay of geometric spreading, background growth and atmospheric attenuation. Because the sensitivity expressions remain implicitly dependent on the operating range
 $R$
, no single power-law scaling governs system response. To obtain analytically tractable trends, we therefore examine controlled limiting regimes in which one mechanism dominates the others.
4.4 The signal-limited approximation: a framework for design guidance
We first consider the signal-limited regime, corresponding to operating conditions in which the target radiant intensity dominates the background radiance integrated over the sensor’s IFOV. We define the signal-dominance condition (SD) as
 \begin{align} \frac{{B\,\omega {R^2}}}{{{J_0}}} \ll 1 \end{align}
The ratio can be interpreted as a normalised background-to-signal ratio. Under (SD), the background contribution becomes asymptotically small relative to the target intensity, and the contrast term simplifies to
 \begin{align*}{J_t} - {J_b}\left( R \right) \approx {J_t}\end{align*}
In this regime, the background term is a higher order in the detection equation, permitting reduction of the implicit range relation while retaining the dominant effects of geometric spreading and atmospheric attenuation.
Substituting this ordering into the governing constraint yields the tractable form
 \begin{align}{R^2} = C\,{J_t}\,{e^{ - \alpha R}}\end{align}
This reduced expression isolates the fundamental competition between geometric spreading (
 ${R^2}$
) and atmospheric attenuation (
 ${e^{ - \alpha R}}$
), while preserving explicit dependence on system gain
 $C$
and target intensity
 ${J_t}$
. Unlike the full implicit detection equation (Equation (9)), Equation (14) admits an analytical representation in terms of the Lambert-W function, yielding
 \begin{align}R = \frac{2}{\alpha }W\left( {\frac{{\alpha \sqrt {C{J_t}} }}{2}} \right)\end{align}
where
 $W$
denotes the Lambert-W function.
4.4.1 Justification of the engineering abstraction
The signal-limited approximation is introduced as a physically motivated engineering abstraction, not as a universal operating condition. Its purpose is to isolate dominant mechanisms and extract first-order design insights that are otherwise obscured by the full nonlinear coupling among geometric spreading, background accumulation and atmospheric attenuation.
Condition (SD) is satisfied in a broad class of practically relevant scenarios due to one or more of the following factors:
-
• Spectral Band Advantage:
In the MWIR band,
${M_{{\rm{\Delta }}\lambda }}\left( T \right)\;$
varies nonlinearly with temperature according to the Planck law. For realistic background temperatures (
$ \sim \,220{\!-\!}320\,{\rm{K}}$
), the quantity
$B$
remains modest in absolute magnitude. In contrast, the radiant exitance of hot targets (e.g. engine exhausts or heated airframe components at
$800{{\!-\!}}1200\,{\rm{K}}$
) is typically one to two orders of magnitude larger within the same spectral band. Consequently, the target term
${J_t}$
can dominate the IFOV-integrated background over a substantial portion of the engagement envelope. -
• High Spatial Resolution:
A small IFOV solid angle
$\omega $
limits the spatial integration of background radiance, suppressing the quadratic growth of the background term
$B\,\omega {R^2}$
with range and helping to preserve the target–background contrast. -
• Favourable Engagement Geometry:
At short to intermediate ranges, the projected target contribution within the IFOV remains significant relative to the accumulated background, particularly in airborne or uncluttered viewing geometries.


4.4.2 Fundamental sensitivity scaling law
Substituting the signal-limited detection relation into the general sensitivity expressions (Equations (12) and (13)) yields the reduced form
 \begin{align}{S_{R,{J_t}}} = {S_{R,C}} = \frac{1}{{2 + \alpha R}}\end{align}
In the signal-dominance regime, the logarithmic sensitivities to target intensity and system gain become identical, reflecting their symmetric multiplicative roles in the reduced detection equation. Background-dependent terms no longer appear explicitly.
Equation (16), therefore, constitutes a fundamental scaling law for signal-limited sensitivity. The dimensionless product
 $\alpha R$
emerges as the sole governing parameter controlling responsiveness. As attenuation increases (
 $\alpha R \uparrow $
), sensitivity decreases monotonically, indicating diminishing leverage of both target intensity and system gain at long range.
4.5 Strategic interpretation: the designer’s paradox
The sensitivity scaling law derived in the previous section provides a compact analytical description of how detection range responds locally to variations in target radiant intensity and system gain. To extract meaningful engineering insight, however, this result must be interpreted from a system-design perspective, emphasising operational consequence rather than mathematical structure alone.
This interpretation becomes most transparent by examining the two limiting propagation regimes implied by Equation (16), corresponding to weakly attenuating and strongly attenuating environments. In both cases, background effects remain sub-dominant and detection is signal-limited in origin. The distinction between the regimes lies not in whether atmospheric attenuation influences propagation, but in how strongly it constrains the effectiveness of engineering intervention.
4.5.1 Regime I – diminished tactical leverage (optically thin:
$\alpha R \ll 1$
)

In the weakly attenuating limit, Equation (16) reduces to
 \begin{align*}{{\rm{S}}_{{\rm{R}},{{\rm{J}}_{\rm{t}}}}} \approx {{\rm{S}}_{{\rm{R}},{\rm{C}}}} \approx \frac{1}{2}\end{align*}
recovering the classical square-root scaling
 \begin{align}R \propto \sqrt {C{J_t}} \end{align}
This represents the maximum attainable logarithmic sensitivity: fractional changes in signature or system gain produce proportional changes in detection range.
The Designer’s Trap:
The apparent leverage implied by square-root scaling can overstate the practical impact of engineering intervention. In optically thin conditions, baseline detection distances are intrinsically large, often extending beyond the weapon’s kinematic envelope. All signature-management measures – exhaust plume cooling, nozzle shaping to reduce effective radiating area, surface treatments and thermal coating remain governed by the same square-root dependence. Even if such measures halve the radiant intensity
 ${J_t}$
, detection range decreases by only ∼30%. For example, an initial detection range of 100 km would compress to approximately 70 km under a 50% intensity reduction. While mathematically significant, such a reduction may remain tactically insufficient when baseline detection distances already exceed survivability thresholds. The outcome is quantitatively smaller, but not qualitatively different.
4.5.2 Regime II – strongly attenuating propagation (optically thick,
$\alpha R \gg 1$
)

As attenuation strengthens, sensitivity collapses:
 \begin{align*}{S_{R,{J_t}}} \approx {S_{R,C}} \approx \frac{1}{{\alpha R}} \ll 1\end{align*}
indicating a collapse of logarithmic sensitivity. Exponential extinction becomes the dominant regulator of detection distance.
The Designer’s Frustration: In this regime, atmospheric attenuation compresses baseline detection range yet simultaneously suppresses responsiveness to further engineering intervention. For the same target intensity
 ${J_t}$
and system constant
 $C$
as in Regime I, the detection distance is reduced by environmental extinction. However, improvements in signature now yield only marginal returns. A 50% reduction in
 ${J_t}$
, which in optically thin conditions would produce a ∼30% range reduction, may now produce only a 5–10% decrease. Engineering investment delivers diminishing leverage. Although detection distances are shorter in optically thick environments, controllability is substantially reduced. Range compression arises primarily from atmospheric extinction rather than system design. The environment governs the outcome. Detection distance becomes smaller, but increasingly insensitive to further intervention.
The identical sensitivity behaviour demonstrated in the present analysis establishes a fundamental symmetry between target intensity and system gain, ensuring that the present discussion remains equally relevant from the seeker designer’s perspective, where improvements in sensor performance are likewise subject to diminishing returns under strongly attenuating conditions.
To assess the operational implications of the scaling behaviour derived above, the analytical framework is next evaluated numerically using representative parameters from two distinct MWIR sensing architectures: a surveillance-class IRST system and a missile-seeker-class terminal guidance sensor. This parameterised comparison quantifies how sensitivity to signature reduction varies across architectures and elucidates how atmospheric attenuation progressively constrains the practical leverage available to each.
5.0 Parameterised evaluation of MWIR detection architectures
Building on the theoretical framework established in Sections 2–4, the study now transitions to a numerical evaluation using representative physical parameters. This analysis requires the integration of target and background radiometric properties, atmospheric extinction characteristics and specific sensor-level parameters. The target and background properties, alongside the atmospheric extinction coefficients, are sourced from established infrared detection studies [Reference Gaitanakis, Vlastaras, Vassos, George and Zikidis27]. From the same study [Reference Gaitanakis, Vlastaras, Vassos, George and Zikidis27], parameters for the IRST system are also used for numerical analysis.
Missile seeker parameters are likewise adopted from a separate study [Reference Ab-Rahman and Hassan28] to enable comparative analysis. The seeker architecture [Reference Ab-Rahman and Hassan28] described corresponds to a first-generation, reticle-based infrared seeker employing a single-element detector rather than a modern imaging array. This configuration exhibits a comparatively wider instantaneous field of view and higher electrical bandwidth – characteristics typical of engagement-class systems optimised for angular tracking rather than the spatial discrimination required of long-range surveillance sensors. Modern imaging infrared seekers employing focal plane arrays may exhibit substantially different optical architectures and discrimination capabilities.
Nevertheless, within the present modeling framework, all hardware-dependent optical and detector characteristics are consistently grouped into the system constant
 $C$
. This abstraction enables a direct and structurally consistent comparison between fundamentally different sensor configurations, ensuring that the analysis remains valid at the systems level despite differences in underlying hardware implementations.
5.1 Parameter specification
The target is modeled as a Lambertian graybody with emissivity
 ${\varepsilon _t} = 0.9\;$
and projected area
 ${A_t} = 0.51\,{{\rm{m}}^2}$
. The target temperature
 ${T_t}$
is treated as a variable parameter for the present parametric study. The background is modeled as a grey surface with emissivity
 ${\varepsilon _b} = 0.9$
and temperature
 ${T_b} = 230\,{\rm{K}}$
, with radiation evaluated in the MWIR (3–5 µm) band. Atmospheric attenuation is represented using extinction coefficients spanning the range
 $\alpha = 0.05{\rm{-}}1.2\,{\rm{k}}{{\rm{m}}^{ - 1}}$
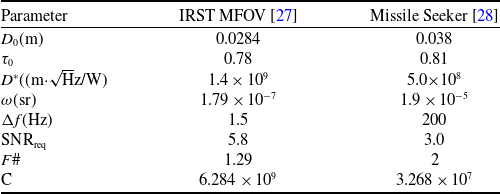
. For physical interpretation, five representative cases – drought (0.05 km−1), clean atmosphere (0.1 km−1), light dust or haze (0.4 km−1), rainfall (0.8 km−1) and high-intensity rainfall (1.2 km−1) – are identified. The sensor specifications are provided in Table 2. For both sensors, the system constant
 $C$
, as defined in Section 3.2, is evaluated and reported in the last row.
Sensor parameters details

Table 2. Long description
A table comparing sensor parameters for IRST MFOV and Missile Seeker. The table has 8 rows and 3 columns. The columns are labeled Parameter, IRST MFOV, and Missile Seeker. The rows are labeled with different parameters and their corresponding values. Row 1: D subscript 0 (m), 0.0284, 0.038. Row 2: tau subscript 0, 0.78, 0.81. Row 3: D asterisk ((m times square root of H z divided by W)), 1.4 times 10 to the power of 9, 5.0 times 10 to the power of 8. Row 4: omega (sr), 1.79 times 10 to the power of negative 7, 1.9 times 10 to the power of negative 5. Row 5: Delta f (H z), 1.5, 200. Row 6: S N R subscript req, 5.8, 3.0. Row 7: F hash, 1.29, 2. Row 8: C, 6.284 times 10 to the power of 9, 3.268 times 10 to the power of 7.
5.2 Validation of the signal-limited scaling law
As the first in a series of numerical investigations, this section examines the validity of the signal-limited approximation introduced in Section 4.4. While Equation (9) governs the full detection problem, Equation (14) represents the reduced signal-limited form obtained under the SD condition, whose closed-form Lambert-W solution is given by Equation (15). The analysis focuses on the conditions under which the signal-limited range predicted by Equation (15) agrees with the full implicit solution of Equation (9). Results for both the IRST and missile-seeker configurations are presented in Figs 2 and 3, with the vertical axis plotted on a logarithmic scale. In these figures, Imp denotes the full implicit solution, whereas Lam denotes the corresponding Lambert-W solution.
Detection behaviour for the IRST configuration. Normalised background-to-signal ratio(left) as a function of atmospheric extinction coefficient for target temperatures of 400 K, 750 K and 1000 K. Detection range (right) versus atmospheric extinction, showing comparison between the full implicit solution (solid lines) and the signal-limited approximation (dotted lines).

Figure 2. Long description
Panel A: A line graph shows the normalized background-to-signal ratio as a function of the atmospheric extinction coefficient. The x-axis represents the atmospheric extinction coefficient in inverse kilometers, ranging from 0 to 1.2. The y-axis represents the normalized background-to-signal ratio, ranging from 10^-4 to 10^1. Three lines are plotted for target temperatures of 400 K (black line), 750 K (blue line), and 1000 K (orange line). The graph indicates that as the atmospheric extinction coefficient increases, the normalized background-to-signal ratio decreases for all three temperatures. Panel B: A line graph shows the detection range versus the atmospheric extinction coefficient. The x-axis represents the atmospheric extinction coefficient in inverse kilometers, ranging from 0 to 1.2. The y-axis represents the detection range in kilometers, ranging from 10^0 to 10^2. Six lines are plotted: solid lines for the full implicit solution and dotted lines for the signal-limited approximation, each for target temperatures of 400 K (black lines), 750 K (blue lines), and 1000 K (orange lines). The graph indicates that as the atmospheric extinction coefficient increases, the detection range decreases for all temperatures and both solution types.
Detection behaviour for the missile seeker configuration. Normalised background-to-signal ratio (left) as a function of atmospheric extinction coefficient for target temperatures of 400 K, 750 K and 1000 K. Detection range (right) versus atmospheric extinction, showing comparison between the full implicit solution (solid lines) and the signal-limited approximation (dotted lines).

Detection range is evaluated for atmospheric extinction coefficients ranging from 0.05 to 1.2 km−1, representing progressively stronger attenuation. To assess the influence of source strength, three representative target temperatures, 400 K, 750 K and 1000 K, are considered while keeping emissivity and projected area fixed.
It is recalled that the source model introduced in Equation (5) includes the parameter
 $K$
, representing the gas-phase contribution. In the present analysis,
 $K = 0$
is assumed, corresponding to a purely solid-surface target. The effect of non-zero
 $K$
will be examined in the subsequent section.
For both the IRST and missile seeker configurations, increasing target temperature reduces the normalised background-to-signal ratio and decreases the discrepancy between the implicit detection-range solution and the signal-limited approximation. This behaviour arises because higher target temperatures increase the intrinsic source radiance
 ${J_0}$
, thereby improving target contrast and reducing the relative influence of background-limited effects.
Similarly, increasing the atmospheric extinction coefficient (
 $\alpha $
) leads to a reduction in detection range for all temperatures, yet the difference between the implicit solution and the signal-limited approximation progressively diminishes as attenuation increases. This convergence occurs because atmospheric attenuation increasingly dominates the detection process, causing the received signal to decay exponentially with distance and reducing the relative significance of background contrast flux.
While the deviation between the two solutions is more pronounced in the missile-seeker configuration due to a larger IFOV (Table 2), which enhances background collection. However, once the normalised background-to-signal ratio falls below approximately
 ${10^{ - 2}}$
, the signal-limited approximation becomes highly accurate. Thus, a practical validity threshold is established below which the simplified analytical expression in Equation (14) provides reliable detection-range estimates. Under these conditions, performance becomes governed primarily by signal attenuation rather than background interference.
5.3 Seeker designer perspective
Next, we examine the range predictions for the composite source model formulated in Section 2.3, which incorporates radiative contributions from both the solid surface and the gaseous plume. The target temperature is fixed at
 ${T_t} = 1000\,{\rm{K}}$
, and two cases are considered:
 $K = 0$
, corresponding to solid-only emission, and
 $K = 0.5$
, representing an upper-range, non-afterburning plume contribution. The latter serves as a physically representative upper-bound condition for nominal operating configurations. Detection range is evaluated for both the IRST and missile-seeker systems across the five atmospheric conditions defined previously, enabling direct comparison with the solid-only baseline. The resulting detection ranges are presented in Fig. 4. Although the
 $K = 0.5$
case in our model specifically represents plume augmentation, the findings extend to any mechanism that increases the target’s infrared signature, whether from afterburner activation, aerodynamic heating, engine hot spots or other sources of additional radiant intensity.
Detection range comparison for solid-only and solid-plus-plume configurations (
 $K = \textit{0}$
and
 $K = \textit{0.5}$
) under representative atmospheric conditions for IRST (left) and missile-seeker (right) sensors.

From the seeker designer’s perspective, Fig. 4 reveals how target intensity influences sensor performance across operational environments. Under low-attenuation conditions (drought and clean atmospheres), substantial range gain from increased intensity is evident. For the IRST, the detection range increases from 137.8 km at
 $K = 0$
to 144.2 km at
 $K = 0.5$
under drought conditions – a gain of 6.4 km. The missile seeker, while operating at shorter absolute ranges due to its lower system constant (
 ${C_{{\rm{seeker}}}} = 3.27 \times {10^7}$
vs.
 ${C_{{\rm{IRST}}}} = 6.28 \times {10^9}$
), exhibits a similar proportional gain, increasing from 63.6 km to 68.7 km.
As extinction increases, the incremental benefit of enhanced intensity diminishes markedly. Under dust conditions, the IRST range gain from plume augmentation drops to just 0.9 km (from 25.6 to 26.5 km). Under heavy rainfall, the difference between
 $K = 0$
and
 $K = 0.5$
configurations become negligible for both sensor types: the IRST gains only 0.3 km (10.1 km to 10.4 km), while the seeker gains a mere 0.3 km (6.5 km to 6.7 km). Here, the seeker enters an atmosphere-limited regime, where atmospheric attenuation governs performance and additional source intensity – regardless of its origin – provides virtually no benefit. The missile seeker’s wider IFOV and higher bandwidth, reflected in its two-orders-of-magnitude smaller system constant, make it particularly susceptible to this degradation, with its ranges collapsing faster than the IRST as extinction increases.
For the designer, these results provide a clear indication of how target intensity influences detection performance under different atmospheric conditions. In drought conditions, a 6.4 km range advantage for the IRST and 5.1 km for the seeker demonstrates that increased target emission can produce meaningful extensions in detection range under low-attenuation environments. However, under heavy rainfall, when both configurations detect below 10.4 km (IRST) and 6.7 km (seeker), atmospheric attenuation largely governs detection performance, and additional increases in target intensity produce only marginal improvements in achievable range.
5.4 Stealth designer perspective
We now shift from the seeker designer to the stealth designer’s perspective, where the objective is to reduce aircraft detectability through thermal management. Taking the
 $K = 0.5$
configuration from Section 5.3 as the baseline, representing nominal operating conditions with plume contribution, we evaluate three levels of signature suppression: 10%, 50% and 90% reduction in source intensity. These reductions are applied uniformly across both sensor architectures and all five atmospheric conditions, with the target temperature held constant at
 ${T_t} = 1000\,{\rm{K}}$
.
The numerical results in Fig. 5 validate the two limiting regimes derived in Section 4.5. In Regime I (low attenuation), corresponding to drought and clean atmospheres, the impact of signature reduction is substantial in absolute terms for both sensors. For the IRST under drought conditions, a 90% intensity reduction decreases the detection range from 144.2 km to 109.2 km – a 35 km loss. Similarly, the missile seeker sees its range drop from 68.7 km to 42.2 km. While these reductions appear significant, the survivability engineer must note that even after 90% suppression, the aircraft remains detectable at distances exceeding 100 km for the IRST and 40 km for the seeker. In these clear-air environments, the aircraft remains vulnerable despite aggressive engineering intervention.
Predicted detection range as a function of progressive reduction in target radiant intensity under representative atmospheric conditions, shown for (left) IRST and (right) missile-seeker configurations.

As atmospheric extinction increases, the system transitions into Regime II (high attenuation), where exponential extinction becomes the primary regulator of performance. Under heavy rainfall, the same 90% intensity reduction lowers IRST range by only 1.6 km (from 10.4 km to 8.8 km) and seeker range by a mere 1.5 km (from 6.7 km to 5.2 km). This demonstrates a significant law of diminishing returns: atmospheric attenuation has already compressed baseline detection to short tactical distances, simultaneously neutralising the impact of further signature reduction. In this regime, the substantial range advantages achieved through suppression in clear air are reduced to negligible margins.
For the stealth designer, this carries a sobering implication: investments in signature suppression yield meaningful returns only in benign weather; under high attenuation, the environment – not engineering – dictates the outcome, and even aggressive thermal management may fail to alter the survivability envelope.
6.0 Conclusion
This study has developed a reduced-order analytical framework to examine the infrared lock-on range problem by explicitly incorporating target emission, atmospheric attenuation, background radiance and sensor characteristics. The resulting detection condition was formulated as a transcendental implicit equation, revealing a fundamental contrast-limited upper bound on detection range that exists independently of sensor gain or atmospheric attenuation.
Sensitivity analysis showed that detection-range responsiveness is governed solely by the dimensionless optical-depth parameter, αR. In optically thin environments, detection range follows classical square-root scaling with target radiant intensity and system gain, allowing meaningful reductions through signature suppression. However, in strongly attenuating conditions, atmospheric extinction dominates and sensitivity collapses, resulting in diminishing returns from further signature reduction or sensor improvement.
Numerical evaluation using representative IRST and missile-seeker configurations confirmed these analytical predictions and demonstrated that the effectiveness of infrared signature suppression is strongly dependent on atmospheric conditions. The framework developed here provides a physically transparent basis for understanding detection limits and offers practical guidance for evaluating infrared signature management and sensor performance under realistic operational environments.



 K=0
 K=0.5



