I. INTRODUCTION
Bulk metallic glasses (BMGs) are currently investigated worldwide, as a new class of promising structural materials. Different from conventional crystalline metallic alloys, the internal structures of BMGs are amorphous, and therefore they do not have well-defined dislocation defects to mediate plastic deformation. As a result, they exhibit extraordinarily high strength, but lack tensile ductility. This brings in an important difference, in terms of the key properties that are needed for engineering design and practical use. For conventional alloys, yield strength is often the design parameter used in materials selection; but for BMGs, fracture toughness is a more tell-tale indicator of mechanical performance, needed in design to guarantee damage tolerance. The fracture toughness assesses a material's resistance to crack propagation, measured by the energy needed to cause fracture. Simultaneous presence of high fracture toughness and strength imparts high damage tolerance to an alloy.
This article discusses a strategy to locate BMGs with high fracture toughness. In this regard, the first question to ask is whether a BMG has the potential to be highly damage-tolerant. The answer is positive because, different from oxide glasses, the nondirectional metallic bonding and dense-packed structures of BMGs offer the intrinsic mechanism of relatively easy shear transformations (local relocation/shuffling of a group of atoms relative to one another) to accommodate plastic strain, which shields crack tip and dissipates energy. Reference Greer, Cheng and Ma1 Although under uniaxial tension loading the plastic strains localize into thin shear bands, making BMGs highly susceptible to failure, they are not necessarily brittle under confined loading conditions such as bending, rolling, compression (especially when the sample has a low aspect ratio), and triaxially stressed states. The challenge is how to find BMG compositions/structures that are particularly susceptible to shear transformations and profuse generation of shear bands at the crack tip.
Thus far, the fracture toughness values reported for BMGs span a wide range. Reference Ashby and Greer2–Reference Xu, Ramamurty and Ma4 Very few monolithic BMGs have been found to be able to exhibit subcritical crack growth and substantial crack propagation resistance (in terms of measured R-curve). In general, this is due to the lack of microstructural variations inside the BMGs (except in crystal-containing composites based on BMGs Reference Launey, Hofmann, Suh, Kozachkov, Johnson and Ritchie5,Reference Ritchie6 ), such as a high content of “liquid-like” heterogeneities in BMGs, to play the role of dislocations in crystalline metals. However, an exciting breakthrough has recently been reported Reference Demetriou, Launey, Garrett, Schramm, Hofmann, Johnson and Ritchie7 : A monolithic BMG (Pd79Ag3.5P6Si9.5Ge2) was developed at Caltech and demonstrated to rival the best known crystalline alloys in damage tolerance. This Pd-based BMG has by far the highest fracture toughness among all BMGs. Unfortunately, this BMG is compositionally based on the expensive palladium and suffers from a rather limited glass-forming ability (GFA). These severely limit this BMG for mass-production/application in bulk form. Also, the guideline for finding such high-toughness BMGs remains unsettled. Demetriou et al. Reference Demetriou, Launey, Garrett, Schramm, Hofmann, Johnson and Ritchie7 postulated that the high fracture toughness of their Pd-based BMG is due to its high Poisson's ratio ν of 0.42 (or equivalently, a high ratio of bulk modulus to shear modulus, B/G Reference Lewandowski, Wang and Greer8 ). That connection drastically reduces the number of possible candidates, restricting the choices to alloy systems based on high-ν elements, which are few and tend to be of high cost. In the following, we report an alternate route for the development of highly damage-tolerant BMGs, from a BMG structural perspective.
II. EXPERIMENTS: ASTM STANDARD TESTS FOR FRACTURE TOUGHNESS
In the experimental front, our study emphasizes two issues regarding quantitative and appropriate fracture toughness measurements. First, the test samples should have sufficiently large dimensions, such that the fracture toughness can be evaluated in a reliable way, using American Society for Testing and Materials (ASTM) standard tests. In comparison, small samples would leave inadequate dimensions for the ligaments, and shear bands near the roller on the other side of the specimen in a three-point bending test would consume energy and could hence be a source of uncertainties. Reference Demetriou, Launey, Garrett, Schramm, Hofmann, Johnson and Ritchie7 Also, the toughness measured can exhibit sample-size dependence, as plane strain conditions are no longer valid in small-dimension samples. Second, fatigue precrack is required for a standard test following ASTM standard procedures, such that the work associated with crack nucleation does not come into play. In other words, we strive to employ adequately sized specimens to strictly follow ASTM standards, to improve on previous tests and minimize the possibility of observing and reporting artificially elevated toughness values.
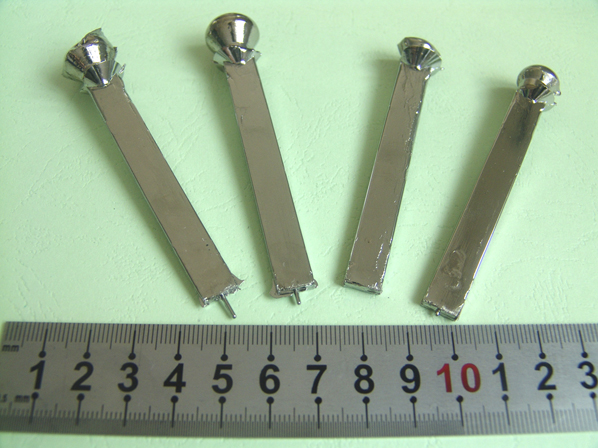
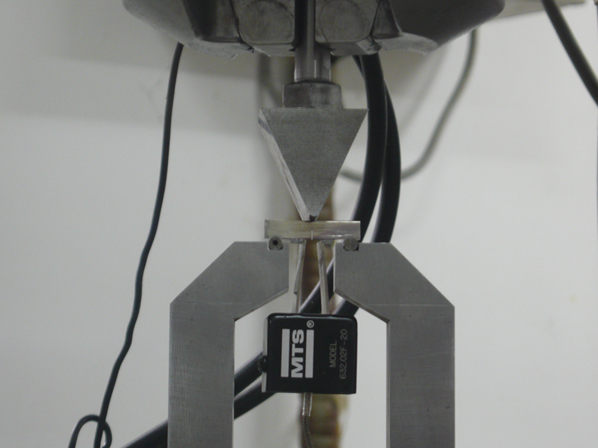
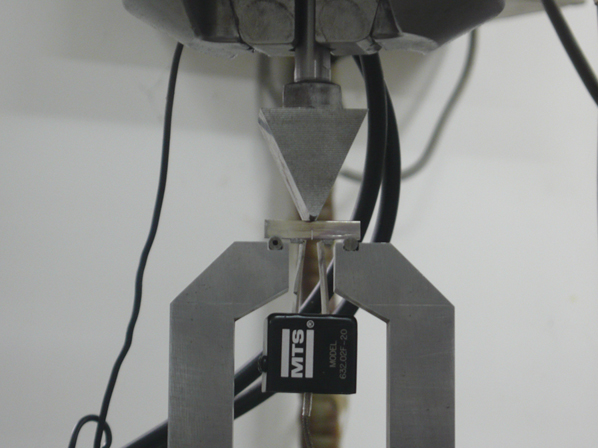
Our BMG plates were larger than 3 mm in thickness in their as-cast conditions, Reference He, Cheng, Ma and Xu9 as shown in Fig. 1. The alloy composition to be focused on in this article is Zr61Ti2Cu25Al12 (denoted as ZT1), which is a monolithic BMG without noticeable heterogeneities such as phase separation and nanocrystals. The oxygen content in the as-cast BMG plates was determined to be as low as 90–130 weight parts per million (wppm) using inert-gas fusion analysis. After machining and polishing, the toughness specimen dimensions are at a ratio of 1:2:8 for B (thickness = 3 mm):W (width):S (span). A straight, through-thickness notch was made using a diamond wire saw, with a notch root radius of 150 μm and a length of ∼0.25W. The fatigue precracking of the specimens was conducted on a 2.5 kN fatigue test machine (MTS Systems Corporation, 858 mini Bionix, Eden Prairie, MN), as shown in Fig. 2, at the frequency of 30 Hz under a constant load ratio of minimum to maximum of 0.1 with the stress intensity factor ΔK of 30–45 MPa√m. The notch plus the fatigue precrack amounted to a length of 0.5–0.7W after 10,000–100,000 fatigue cycles, conforming to ASTM standards. Three-point bend tests of the fatigue precracked specimens were carried out on a 5 kN Instron 8871 testing machine (Instron Corporation, Norwood, MA) at a constant displacement rate of 0.3 mm/min. The crack opening displacements (CODs) were monitored across the crack mouth using a clip gage, mounted between knife edges and affixed to the front of the specimen.
As-cast Zr61Ti2Cu25Al12 BMG plates used for preparing samples of fracture toughness measurement.

Three-point-bending setup with single-edge-notch Zr61Ti2Cu25Al12 BMG specimen mounted on MTS fatigue test machine for fatigue precracking.
To measure the crack resistance curve (R-curve), both the “single-” and “multiple-” specimen techniques were used. 10,Reference Anderson11 For the single-specimen technique, the fatigue precracked specimen was first loaded monotonically at the rate of 0.3 mm/min. In the nonlinear part of the load versus load line displacement (LLD) curve, observed after LLD of about 0.3–0.55 mm, the specimen was unloaded by 20–30% of the current load at the rate of 0.15 mm/min, followed by reloading at 0.3 mm/min. The number of load–unload sequences depends on the original crack length (10–30 runs were used in our case). The length of crack extension (Δa) can be estimated based on the measured specimen compliance,
 $${{{a_{\rm{i}}}} \over W} = \left[ {0.999748 - 3.9504u + 2.9821{u^2} - 3.21408{u^3} + 51.51564{u^4} - 113.031{u^5}} \right]\quad ,$$
 $$u = {1 \over {{{\left[ {{{BWE{C_{\rm{i}}}} \over {{S \mathord{\left/ {\vphantom {S 4}} \right. \kern-\nulldelimiterspace} 4}}}} \right]}^{1/2}} + 1}}\quad ,$$
where a i is the crack length and C i is the changing compliance during the sequence of multiple unloading/reloading. The eventual Δa was calibrated by comparing the compliance-derived value with the physical crack growth width sandwiched between the fatigue precracked region and refatigued region observed on the fracture surface.
For the multiple-specimen technique, the first specimen was unloaded at the appropriate displacement to produce Δa in a desired position for the R curve. Subsequently, several specimens were unloaded at desired displacements (distributed uniformly), less than the displacement of the first specimen. After unloading, the specimens were heat-tinted at 300 °C for 60–90 min, then refatigued on a 2.5 kN MTS fatigue test machine at the frequency of 30 Hz under a constant load ratio (minimum to maximum) of 0.1 until the ultimate fracture. This way, the physical crack length in each fractured samples can be visually determined by using a scanning electron microscope (SEM; Quanta model 600, FEI, Eindhoven, Netherlands) and a 3D measuring laser microscope (LEXT OLS4000, Olympus Corporation, Tokyo, Japan).
Using the following standard equations, the J value (nonlinear strain-energy release rate) was calculated from load versus COD curves,
 $$J = {{{K^2}\left( {1 - {\nu ^2}} \right)} \over E} + {J_{{\rm{pl}}}}\quad ,$$
 $${J_{{\rm{pl}}}} = {{1.9{A_{{\rm{pl}}}}} \over {Bb}}\quad ,$$
 $$K = {{PS} \over {B{W^{3/2}}}}f\left( {{a \over W}} \right)\quad ,$$
 $$f\left( {{a \over W}} \right) = 3\sqrt {{a \over W}} {{1.99 - \left( {{a \over W}} \right)\left( {1 - {a \over W}} \right)\left[ {2.15 - 3.93{a \over W} + 2.7{{\left( {{a \over W}} \right)}^2}} \right]} \over {2\left( {1 + 2{a \over W}} \right){{\left( {1 - {a \over W}} \right)}^{3/2}}}}\quad ,$$
where A pl is the area under the load (P) versus COD record, a is the instantaneous crack size, and b is the ligament length equal to W − a. E is the Young's modulus and ν the Poisson's ratio. For the ZT1 BMG, E and ν are 80 GPa and 0.367, respectively. Reference He, Cheng, Ma and Xu9
III. SELECTING A SUITABLE ALLOY COMPOSITION
Our working hypothesis is that the BMG toughness scales with the population and proliferation of multiple shear bands formed in front of the crack tip. Extensive plastic events (shear transformations) lead to such profuse shear banding, developing an extensive (e.g., millimeter-sized) process zone and therefore causing plastic shielding and possibly deflection of crack path. To encourage spread-out plastic events, the prerequisite is that the BMG internal structure should contain a large fraction of fertile sites for shear transformations. An illustration of different local structures leading to different propensity for shear transformations was presented before. Reference Cheng, Cao, Sheng and Ma12 In a nutshell, it is preferable for the local structures to be “flexible” and prone to change. Such local structures should contain undesirable coordination polyhedra that deviate from those preferred at the particular alloy composition. Specifically, geometrically unfavored motifs (GUMs) are more amenable to configurational changes than the relatively rigid clusters that possess the favored short-range order. The “GUMs” include those with unusually high or low coordination number for the alloy composition and atomic size ratio, and the clusters that have the favored coordination number but contain excess disclinations/distortion (e.g., non-Kasper polyhedra). Such relatively uncomfortable clusters would be more likely to reconfigure under external stimuli (in this case, stresses).
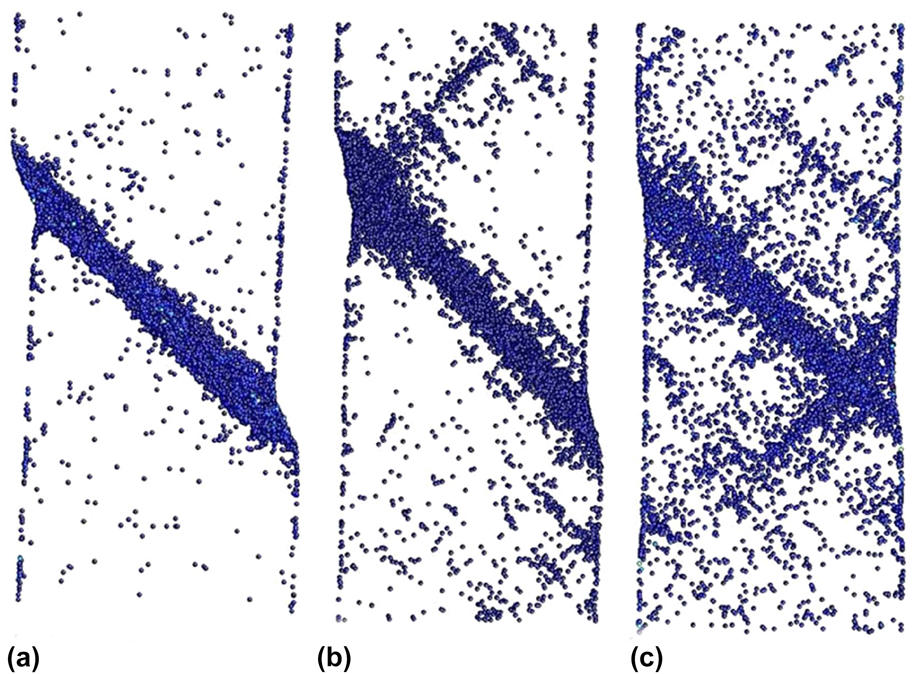
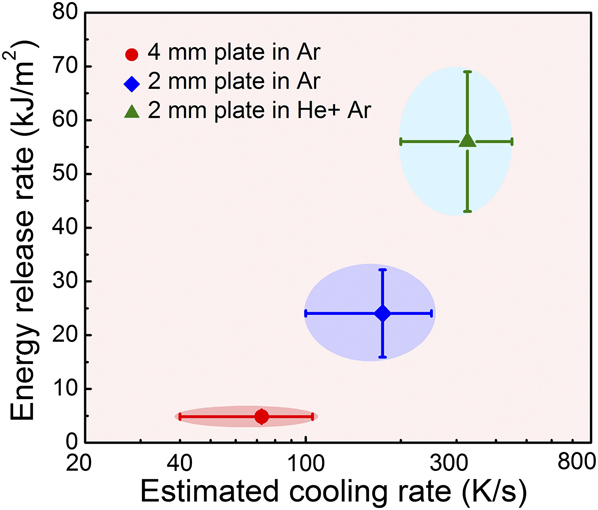
There are two ways to increase the population of such fertile sites for shear transformations. One is by using rapid quenching of the melt, such that the resulting metallic glass traps inside a higher fraction of these “liquid-like” GUM varieties in the local structures. The trend can be illustrated using a molecular dynamics simulation. As shown in Fig. 3, the “participation ratio” (i.e., the fraction of atoms that undergo large strains) increases, or the degree of strain localization decreases, upon loading samples prepared at increasingly higher quench rates (with more frozen-in GUMs). Reference Cheng, Cao and Ma13 Experimentally, one way to achieve more effective cooling is by casting in a mixture of argon and helium. For a given thickness, a BMG plate cooled faster using the latter medium during casting exhibits a higher toughness, as shown in Fig. 4. Reference Zhu, Ma and Xu14
Comparison of the propensity for strain localization upon plastic deformation of Cu64Zr36 metallic glass (MG) models containing 10,000 atoms quenched using MD simulations at different cooling rates: (a) 1 × 10¹⁰ K/s, (b) 1 × 10¹¹ K/s, and (c) 1 × 10¹² K/s. Only atoms with von Misses strain larger than 0.3 are shown (in blue), at an overall sample strain of 12%. Reference Cheng, Cao and Ma13

Relationship between the fracture energy release rate and the glass-forming cooling rate used during fabrication of Cu49Hf42Al9 BMG. Reference Zhu, Ma and Xu14

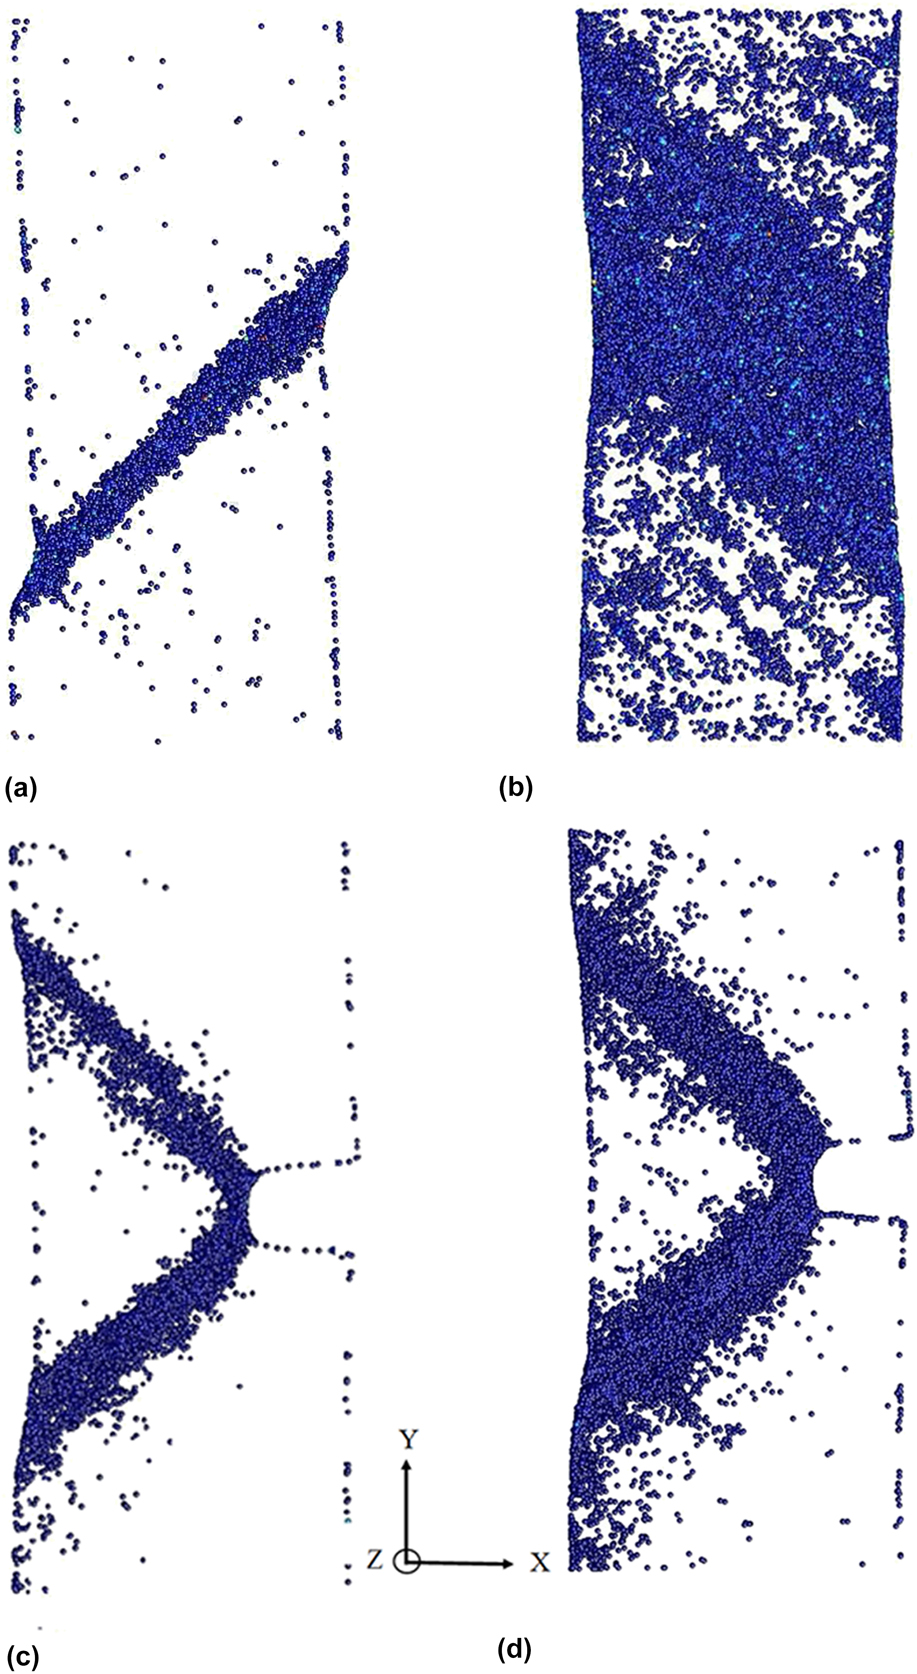
Of course, a more interesting approach is to use routine casting but change alloy composition, and accordingly the internal structure, to induce an increased tendency for spread-out (plastic) shear transformations. Experiences indicate that metallic glasses (MGs) obtained from more fragile supercooled liquids tend to be more plastic. It is also known that different alloys compositions lead to different fragility of the liquids. To illustrate this point for the range of compositions that form BMGs in the Cu–Zr based system, Movie I and Movie II in Supplementary Materials compare a Cu64Zr36 metallic glass with another one at a Zr-rich composition, Cu20Zr80 (Cu40Zr60 behaves in a very similar way). Clearly, upon loading these two otherwise identical molecular dynamics (MD) models (same dimensions and cooling history), the latter develops much more, and wider bands of, shear transformations. In comparison, the former exhibits more localized strains in a narrower shear band that leads to an obvious shear offset. This comparison is also made in Figs. 5(a) versus 5(b), using snapshots at the end of the two movies. A similar difference was reported earlier at slightly different compositions. Reference Cheng, Cao and Ma13 Such a difference is also observed when a notch was premade in the MD model sample, as displayed in Figs. 5(c) versus 5(d), for Cu64Zr36 versus Cu20Zr80. Reference Zhang, Cheng, Cao, Xu and Ma15 The structural origin is that during the BMG preparation of the former composition, its internal structure develops a dominantly high fraction of full icosahedra, which are the geometrically favored coordination polyhedra that tend to resist relaxation and deformation. Reference Cheng, Cao, Sheng and Ma12,Reference Cheng, Ma and Sheng16 In comparison, for the latter composition, the favored local motifs have more varieties and these polyhedra have a higher tendency to undergo relaxations.
Different tendency toward shear localization in MG models of different compositions (cooled at the same molecular dynamics simulation quench rate of 1012 K/s) under tensile loading. In (a) and (c) for the Cu64Zr36 MG, the fraction of full icosahedra in Cu-centered polyhedra is about 19%, whereas that in (b) and (d) for Cu20Zr80 MG is 2%. Only atoms with local atomic strain larger than 0.35 are shown with blue dots.

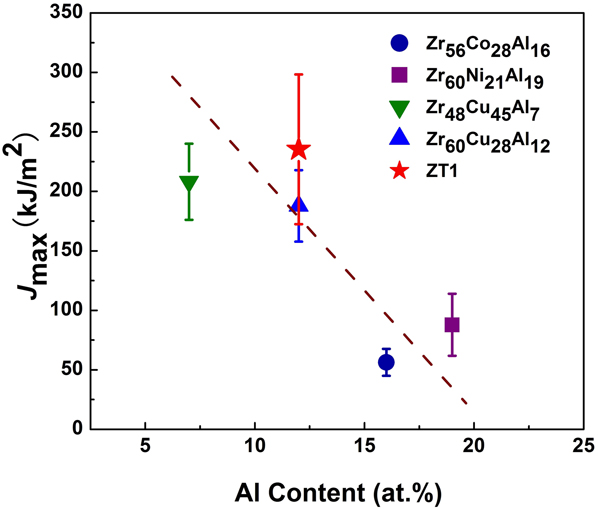
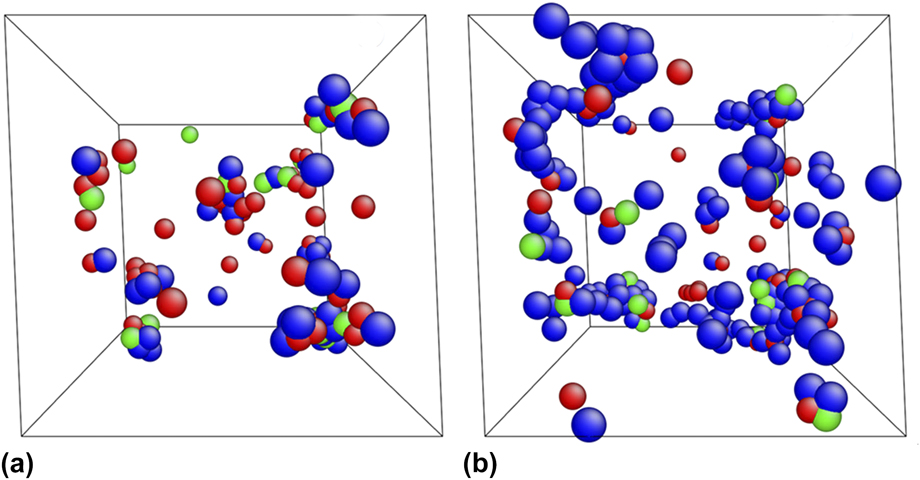
Figure 5 and the movies above give the impression that for Cu–Zr based BMGs, the right direction to encourage more spread-out shear transformations is to move the alloy composition toward the Zr-rich side. This is also true for Cu–Zr–Al based ternary compositions. Adding Al improves the GFA so that larger BMG samples can be made, so some Al is necessary. However, adding Al degrades toughness, as illustrated with experimental results in Fig. 6. Reference He, Cheng, Ma and Xu9 This is because Al tends to increase the fraction of rigid full icosahedra and introduces some covalent character to the interatomic bonding (some degree of polarized electron charge density distribution around Al). Reference He, Cheng, Ma and Xu9,Reference Zhang, Cheng, Cao, Xu and Ma15,Reference Cheng, Ma and Sheng16 Therefore, our strategy is to use a limited Al percentage for an acceptable level of GFA, and then reduce Cu content while increasing Zr content as much as possible. This, according to our simulations, did reduce the population of atoms involved in full icosahedra and increase the fraction of atoms in GUMs. Reference Zhu, Ma and Xu14 As a result, atoms that have participated in shear transformations increase, see the comparison in Fig. 7. Reference Zhang, Cheng, Cao, Xu and Ma15
Maximum strain energy release rate J max measured using notched samples versus Al concentration, in Zr–TM(TM = Co,Ni,Cu)–Al based BMGs. Reference He, Cheng, Ma and Xu9

Atoms that have participated in shear transformation events, after 5% shear strain: (a) Zr45Cu45Al10, versus (b) Zr64Cu26Al10. Color scheme: Blue for Zr atoms, red for Cu atoms, and green for Al atoms. Reference Zhang, Cheng, Cao, Xu and Ma15

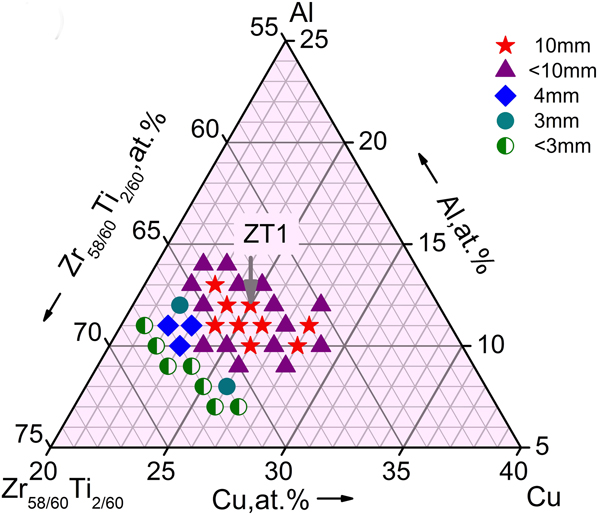
While our modeling suggests that the more Zr the better, in experiments it is difficult to incorporate very high Zr concentrations because there the metallic glasses do not have sufficient GFA (incidentally, one could also attempt to move to very Cu-rich compositions, where the fraction of full icosahedra would eventually turn around to drop. But there the GFA is also poor). As experimentally determined in Fig. 8, only a small group of compositions can be cast into fully amorphous BMGs sufficiently large (10 mm rods, or 3 mm plates) for our toughness experiments following ASTM standards. We have therefore settled at Zr61Ti2Cu25Al12 (ZT1), where the critical diameter for copper-mold casting is D c = 10 mm. This BMG has a yield strength of σy = 1600 MPa, a plastic strain of 4% in compression and zero plastic elongation in tension, a Poisson's ratio of ν = 0.367, and a glass transition temperature T g of 652 K. Reference He and Xu17
Composition map for BMG formation, for alloys with high concentrations of Zr in pseudo-ternary (Zr0.97Ti0.03)–Cu–Al. Different symbols indicate the different critical diameters (D c) of complete glass formation for as-cast rods fabricated using copper mold casting. Reference He, Cheng, Ma and Xu9

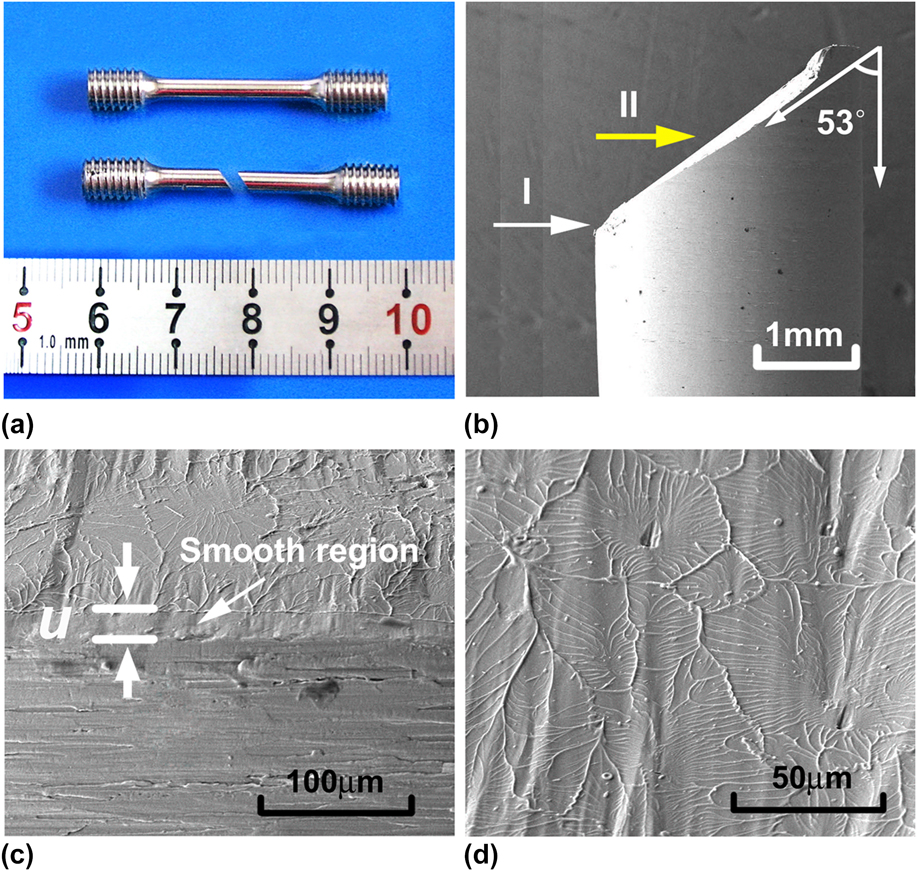
Figure 9(a) shows the tensile specimens of the ZT1 BMG, before and after failure. This BMG has appreciable plasticity in compression test, but nearly zero ductility in uniaxial tension. For the fractured specimen after tension test, the inclined fracture angle (θ) of the fracture plane, with respect to the loading axis, is about 53°, as shown in Fig. 9(b). A dominant single shear band leads to quick failure after the onset of yielding. On the fracture surface, a region with smooth features, as shown in Fig. 9(c), suggests the presence of a shear-off region, which was found before only in the high-toughness Pd79Ag3.5P6Si9.5Ge2. Reference Demetriou, Launey, Garrett, Schramm, Hofmann, Johnson and Ritchie7 As shown in Fig. 9(d), viewed along the direction of Arrow II in Fig. 9(b), the central portion of the fracture surface is mainly characterized by numerous dimple-like or flower-like patterns associated with the resistance against fracture.
(a) Zr61Ti2Cu25Al12 BMG samples before and after tensile testing. SEM images of (b) side view of fractured sample, (c) and (d) high-magnification view of areas I and II in (b), respectively.

IV. R-CURVE OF THE ZT1 BMG
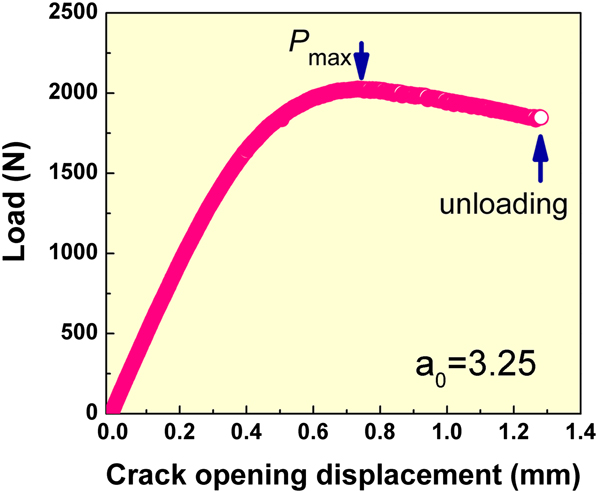
Figure 10 shows a representative load versus COD curve for the ZT1 BMG. The curve does not follow linear-elastic fracture behavior but instead shows pronounced bending indicative of crack-tip plastic flow and stable crack growth. Beyond the maximum load (P
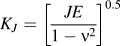
max), the applied load gradually decreases, and the sample was eventually unloaded without fracture at COD = 1.3 mm. J-integral characterization based on nonlinear elastic fracture mechanics, employing the equations earlier, gives a J values of 564 kJ/m2. In terms of the J-K equivalence,
 ${K_J} = {\left[ {{{JE} \over {1 - {\nu ^2}}}} \right]^{0.5}}$
, the converted fracture toughness K
J
is as high as 232 MPa√m (higher than crack growth toughness reported for the Caltech Pd-BMG
Reference Demetriou, Launey, Garrett, Schramm, Hofmann, Johnson and Ritchie7
).
Load versus COD curve from three-point bending test of the Zr61Ti2Cu25Al12 BMG. The maximum applied load (P max) is marked by an arrow. The a 0 represents the initial crack length. Reference He, Shang, Ma and Xu18

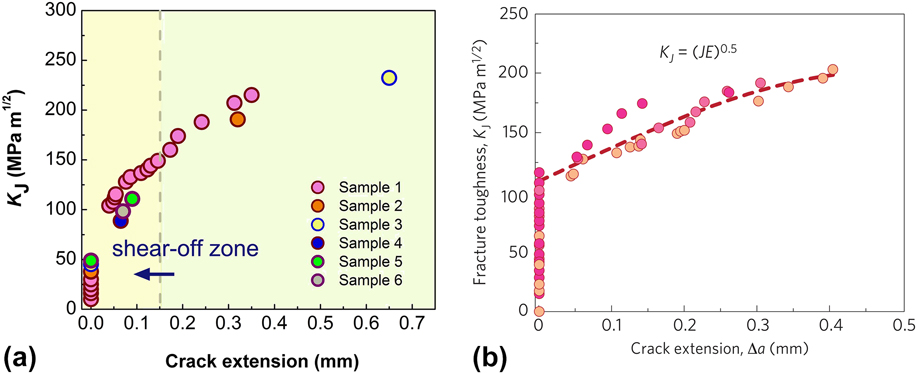
Figure 11(a) plots the entire R-curve, for K J versus crack extension (Δa). Here the Δa was estimated from the increasing compliance during a sequence of multiple unloading/reloading for the single specimen technique (the pink data points). Beyond P max, the compliances changes noticeably, indicating real crack advances. Before P max, however, there is only minor change in compliance so the bending regime in the load-COD curve arises predominantly from the formation of a crack-blunting region (this region resulting from numerous shear offsets is akin to the “stretch zone” before stable crack propagation takes place for ductile crystalline metals) ahead of the crack tip, due to extensive shear band interactions. The total nominal crack extension from the compliance method is therefore actually composed of the stretch (shear-off) zone and the true crack propagation. Consistent with the single-specimen data are the K J values obtained from the multiple-specimen technique where crack extension was visually determined using heat-tinting and refatigue. Data from these five samples have been included in Fig. 11(a) using colored symbols.
Crack-resistance curves (R-curves) in which the fracture toughness K J (converted from J values) is plotted against the crack extension, comparing (a) Zr61Ti2Cu25Al12 (Ref. Reference He, Shang, Ma and Xu18) with (b) Pd79Ag3.5P6Si9.5Ge2 BMGs. Reference Demetriou, Launey, Garrett, Schramm, Hofmann, Johnson and Ritchie7

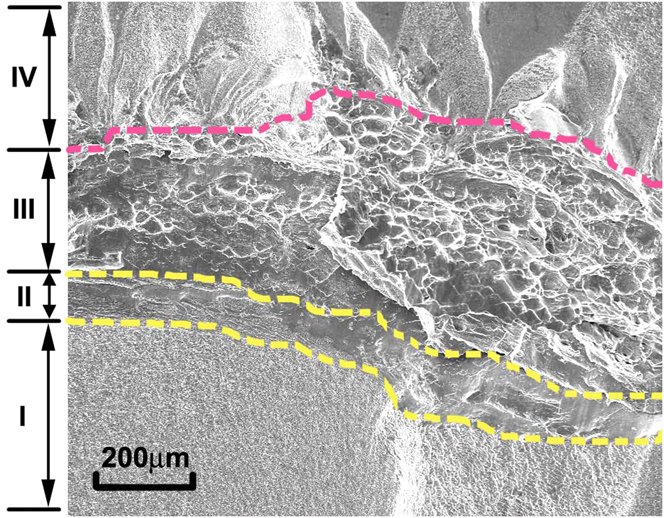
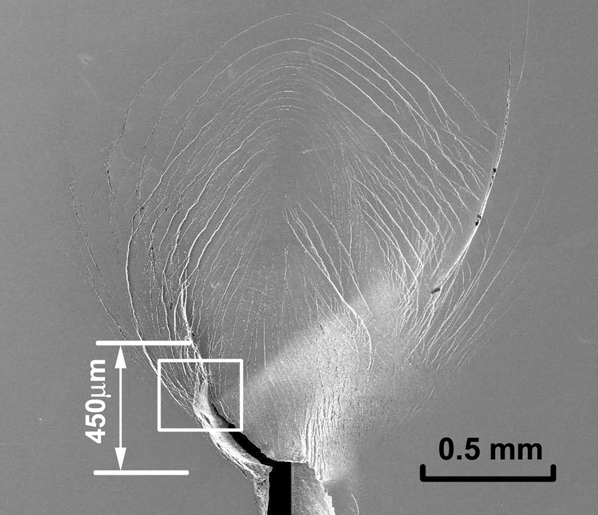
Figure 12 displays an SEM micrograph of the fracture surface for an unloaded ZT1 sample [yellow point in Fig. 11(a)]. Four regions with distinct features are observed from bottom to top ― the fatigue precracked region, a shear-off zone, a region with dimple-like morphology extending to ∼0.5 mm in length, and finally the refatigued region with finer striations (due to lower load) than prefatigued region. The morphological feature of Zone III is consistent with that for mixed-mode crack growth (see discussion later), corresponding to actual crack advance.
SEM micrographs of fracture surface of a Zr61Ti2Cu25Al12 BMG specimen subjected to unloading well over P max without failure, after subsequent refatigue failure, showing four zones with different features, fatigue precracked region (I), shear-off zone (II), crack growth region (III), and refatigued region (IV). Boundaries between adjoining regions are marked with dashed lines. Reference He, Shang, Ma and Xu18

In Fig. 13, it is seen that the crack tip is surrounded by a profuse net of shear bands running extensively and crossing each other, indicative of complex shear band interactions. The crack growth was gradual and under control, as it advances to as far as ∼0.45 mm in the direction of the original fatigue crack (the direction perpendicular to the loading direction) without global sample failure. One origin of the resistance to crack growth is the multiple shear bands, forming (olive/fan-shaped) slip lines and an extensive plastic zone. The plastic zone size of ∼1.7 mm can be compared with the estimated zone radius r p = 1/2π⋅(K J /σy)2 = 3 mm in plane-stress state and r p = 1/6π⋅(K J /σy)2 = 1 mm in plane-strain state, where K J and σy is taken to be 232 MPa√m and 1600 MPa, Reference He and Xu17 respectively. The curved crack path following the shear band trace, instead of cutting straight through, is an expected source for increased energy consumption. In Fig. 13, we see that the crack is obviously deflected to take a detoured path, following the path of least resistance (shear bands) and causing the crack tip to advance under mixed mode (Mode I–Mode II) conditions.
SEM image of side-view of the Zr61Ti2Cu25Al12 BMG specimen, showing profuse shear banding and the typical olive/fan-shaped plastic deformation zone at the crack tip in Zr61Ti2Cu25Al12 BMG. Reference He, Shang, Ma and Xu18

V. TOUGHENING MECHANISMS
Shear-band interactions at the crack tip are generally believed to be a major factor responsible for toughening. Our current findings emphasize that this leads to crack deflection/detour, contributing to the crack-growth resistance (the R-curve behavior). Although the far-field loading was Mode-I in our tests, the appearance of a blunting (shear-off) zone and the meandering crack path suggest that the crack tip loading has turned into a mixed mode. To confirm this, we calculated the contours of the deformation zones at the crack tip, assuming that it would follow the contour of the maximum shear stress, T. Specifically, at the specimen surface with the plane stress, the T drives the shear band formation and the cracking simply follows the shear-banding path. Under this maximum shear stress (driving force) criterion, the crack would thus be deflected to follow the contour of T. The crack deflection has two consequences, one is the reduction in the crack-tip driving force and the other is that the local loading mode at crack tip becomes a mixed one, involving both Mode-II and Mode-I. Reference He, Shang, Ma and Xu18
Under a loading mixed with the opening and shear mode, the T at the crack tip is
 $$T = {{{K_{\rm{I}}}} \over {\sqrt {2\pi r} }}R(\theta )\quad ,$$
where R(θ) is an angular function related to the ratio of the Mode-II versus Mode-I stress intensity factors. If the shear band develops when the shear stress reaches a critical value, T c, the contour of the shear band deformation zone (or plastic zone) is given by
 $${r_{\rm{c}}} = {{K_{\rm{I}}^2R({\rm{\theta }})} \over {2\pi {T_{\rm{c}}}}}\quad ,$$
which under a substantially Mode-II loading condition gives a contour that compares very well with the experimentally observed plastic zone shape in Fig. 13. Reference He, Shang, Ma and Xu18
As such, the crack-tip loading has clearly transformed from the pure Mode-I loading at the initial stage of the crack growth to substantially Mode-II after the multiple shear bands fully develop at the crack tip. Evidently, such a transformation in the crack-tip loading results in much of the energy dissipation in resisting the crack advance. In fact, it has been demonstrated in BMGs before that the fracture resistance under Mode-II loading is significantly higher than that under Mode-I. Reference Flores and Dauskardt19–Reference Flores and Dauskardt22 This results in reduced driving force at the tip, and a deflected crack that detours with extended crack path length. A significant portion of the resistance to the Mode-II crack growth may come from the resistance to crack sliding. One source of such resistance stems from the remaining ligaments between individual shear bands as they line up with the main crack, and the other is from the surface asperities seen on the crack surfaces. In other words, the high toughness of ZT1 is due to its high propensity for crack deflection following the shear band patch and spontaneous change in loading mode. A prerequisite is of course the significant plastic deformation ahead of the crack tip in the form of profuse shear-banding operation and interactions of numerous shear bands.
VI. THE TOUGHEST BMGs THUS FAR
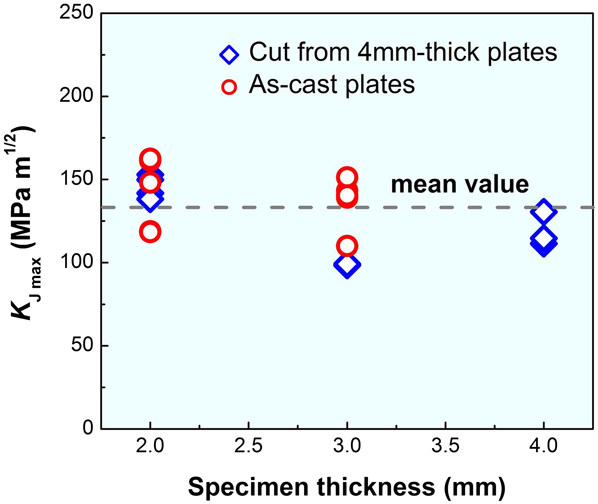
We now compare ZT1 with the Caltech Pd-based BMG, see Fig. 11. For a more meaningful comparison, we choose a critical point in the ZT1 R-curve in Fig. 11(a). Our decision was to use the K J value of ∼150 MPa√m as the critical value, K C. This is the point where the dashed line crosses, corresponding to P max. Beyond this point, the blunting/stretch zone ends and the crack truly advances. We also confirmed that the K C is not sensitively dependent on sample size, by using 14 specimens with thickness varying from 2 mm to 4 mm, as shown in Fig. 14. For the Pd-BMG in Fig. 11(b), a critical K J value is also ∼150 MPa√m, if we follow ASTM E813-87 which defines J IC at 0.2 mm crack extension (this is when the crack advance distance remains short with respect to the ligament length). Moreover, both ZT1 and the Pd-BMG undergo extensive subcritical crack growth over hundreds of micrometers and the resistance to instability eventually led to a crack growth toughness K J in excess of 200 MPa√m, as indicated by the extensive R-curve. We conclude that ZT1 and the Pd-BMG are quite comparable, in terms of the main properties manifested by the R-curve.
Plot of the K Jmax converted from J max against tested specimen thickness (varying form 2 to 4 mm) for the Zr61Ti2Cu25Al12 BMG. Here the subscript refers to the point of maximum load in the load versus COD curve.

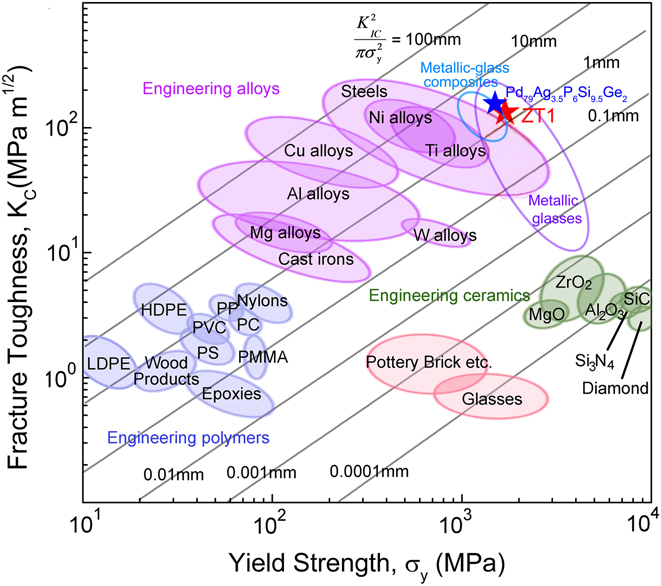
Using a K C of ∼150 MPa√m, ZT1 and the Pd-BMG are compared with previous BMGs, BMG-based composites and all known engineering alloys, in the Ashby diagram shown in Fig. 15. The two BMGs are the toughest among all monolithic BMGs so far, and the toughness is in fact higher than the best known alloys of similar yield strength. The combination of high strength and fracture toughness pushes the two BMGs toward the upper right corner, indicating their superior damage tolerance.
Ashby diagram in the form of yield strength versus fracture toughness (K C or K JC) of engineering materials. For comparison, our new Zr61Ti2Cu25Al12 (ZT1) BMG and the Caltech Pd79Ag3.5P6Si9.5Ge2 BMG are included (labeled using stars). Also marked is the estimated plastic zone radius.

VII. CONCLUDING REMARKS
In terms of materials discovery, our new Zr61Ti2Cu25Al12 (ZT1) BMG stands out as an outstanding metallic alloy for engineering applications. It has a remarkable damage tolerance that not only rivals the previously toughest (Pd–Ag–P–Si–Ge) BMG, but also surpasses that of conventional crystalline alloys. The advantages of our BMG also include its high yield strength of ∼1600 MPa, the absence of costly elements such as noble metals, and a robust GFA for fabrication (Cu-mold casting) of fully amorphous rods on the centimeter-scale.
As for toughening of BMGs, we have identified the mechanism that effectively enhances the resistance to fracture, i.e., a shear-induced spontaneous transformation of the crack tip loading and drastic crack deflection (detour following the shear banding contour of a mm-sized plastic zone). Our finding is significant in opening up new possibilities to reach record-high toughness, beyond what is so far considered necessary (a high Poisson's ratio around 0.4, which severely limits the choice of constituent elements in the BMG).
Finally, the success reported above, i.e., our search and the eventual landing of ZT1, was guided by a correlation between the local atomic packing structure inside BMGs and deformation properties provided by computer simulations. In general, BMGs obtained from liquids of high fragility tend to be tougher. From that perspective, it is desirable to move the alloy composition close to a pure element (the very Pd-rich Caltech BMG may be an example). But in the (commonly studied) Zr–Cu–Al based BMGs, both the very Zr-rich and very Cu-rich ends do not offer sufficiently high GFA to produce BMGs. Over the composition range amenable to BMG fabrication to reach 10 mm dimensions, molecular dynamics simulations provided the insight that the Zr-richer side is more prone to shear transformations (and exhibits higher fragility Reference Cheng, Sheng and Ma23 ) when compared with the Cu-rich side.
Before closing, we note that the discovery of ZT1 (and the Pd-BMG as well) also poses challenging questions. From a conventional engineering point of view, the combination of very high toughness and yet nearly zero tensile ductility is quite unusual. Metallic glasses are rather brittle in tension, but not necessarily so in bending and other confined conditions. Future work is necessary to fully understand these behaviors and use the consequences to our advantage. Also, in terms of glass structures, alloy systems not based on Cu–Zr would have atomic size ratios and chemistry that prefer other types of coordination polyhedra (e.g., full icosahedra may not be among populous clusters) Reference Cheng and Ma24,Reference Ding, Cheng and Ma25 ; the effects of composition on favored and unfavored atomic packing motifs and their response to deformation would need to be characterized in a systematic manner for locating other plastic and tougher BMGs.
Supplementary Material
Movies
Different degree of strain localization in simulated Cu64Zr36 and (b) Cu20Zr80 MGs. The blue dots correspond to nonaffine deformation (mostly plastic strains resulting from shear transformations) induced by tensile loading. The movies record the subsequent deformation processes. While Cu64Zr36 shows an obvious shear offset associated with a dominant shear band, Cu20Zr80 exhibits spread-out shear transformations (Cu40Zr60 behaved in a similar way). This different tendency toward strain localization, due to the difference in the structural order between these two MGs, is also demonstrated in Fig. 5 using snapshots from the two movies.
The movies can be found in the supplementary material at http://dx.doi.org/jmr.2014.160.
ACKNOWLEDGMENTS
The authors are indebted to their former Ph.D. students Qiang He, Yongqiang Cheng, Li Zhang, Zhen-dong Zhu for their contributions to this study, and to Prof. J.K Shang for assistance with the fracture mechanics analysis. This work was supported by the National Basic Research Program of China (973 Program) under contract No. 2007CB613906 and National Natural Science Foundation of China under Grant No. 51171180. EM was supported at JHU by the US NSF-DMR-0904188.