INTRODUCTION
Land use and land cover change (LUCC) in tropical areas is determined by demographic, political and economical forces. Although LUCC heavily impacts the health and environmental services of watersheds (Mungai et al. Reference Mungai, Ong, Kiteme, Elkaduwa and Sakthivadivel2004), there are few studies of the long term impact of LUCC on those services.
The latest survey of the Brazilian National Institute for Space Research (INPE [Instituto Nacional de Pesquisas Espaciais] 2008) indicates that more than 700 000 km2 of Brazilian Amazon has already been deforested, which is equivalent to 14.2% of the total of what is known as the Brazilian Legal Amazon, an administrative division that includes nine states and several ecosystems. To slow these losses and protect critical natural resources, numerous protected and sustainable use areas have been created in the region (Silva Reference Silva2005; Rylands & Brandon Reference Rylands and Brandon2005). The creation of large indigenous lands to protect the territory and traditional lifestyles and culture of native populations, has also contributed to the preservation of extensive areas of natural vegetation (Peres Reference Peres1994, Reference Peres2005; Zimmerman et al. Reference Zimmerman, Peres, Malcolm and Turner2001). In the ‘Arc of Deforestation’ along the southern and eastern margin of the Amazon, where forest is rapidly being converted to both pasture and agriculture land, protected areas (PAs) and indigenous lands (ILs), if well planned, could be used to confine and slow the deforestation process. Recent studies in the Brazilian Legal Amazon (Nepstad et al. Reference Nepstad, Schwartzman, Banberger, Santilli, Ray, Schlesinger, Lefebvre and Alencar2006) have shown that deforestation is reduced up to 20 times and forest fires up to nine times inside the PAs and ILs. Vegetation cover plays a fundamental role in the hydrological and ecological functioning of a watershed and its conservation is one of the principal goals of modern watershed management. Several benefits can be derived from preserving the forest cover in a watershed, such as erosion control, improved soil quality, increased water yield and the regulation of water and sediment discharges in rivers (Pattanayak Reference Pattanayak2004). Because they are discrete hydrological systems, watersheds are often treated as functional units in conservation plans. As such, the watershed has been recognized as the basic unit of land use planning by both the scientific community and by environmental policy directives in Brazilian law. However, despite initiatives to increase watershed conservation and management, political expediency still prevails in much of the decision-making process regarding land use planning. Obtaining accurate information on current land use patterns can assist greatly in implementing an integrated water management approach in the large watersheds in the Amazon basin, as part of an overall conservation strategy. In this context, considering the sheer size of the Amazon, geoprocessing techniques are key tools for obtaining and evaluating these data.
We evaluated the current land cover patterns in the principal watersheds in the Brazilian Legal Amazon, taking into account the relative proportions of deforestation and protected areas and indigenous lands. We discuss the potential impacts of these patterns of land use on hydrological and ecological processes in the region and the need for an integrated land use management plan for the region.
METHODS
Study area
This study focused on the portions of the Amazon River Basin and Tocantins River Basin (Hydrographic Region 1 and Hydrographic Region 2 according to the Brazilian National Water Agency's [ANA, Agência Nacional de Águas] classification) located in the Brazilian Legal Amazon, which correspond to 62.6% and 74.2% of the total drainage areas of these rivers, respectively. The analysis was restricted to these areas because LUCC information was available only for the Brazilian Legal Amazon.
Delimitation of watersheds
A 30-second resolution (c. 1 km) digital elevation model (DEM) derived from 90-m shuttle radar topography mission (SRTM) imagery by the United States Geological Survey (USGS) was used to produce a DEM mosaic of the Amazon Basin area and delimit the major drainage basins (those >100 000 km2) in the study area. Negative elevations, which are usually associated with water surfaces and shadows, were reclassified as null values. We used simple Kriging with a spherical model to refine the DEM to a vertical resolution of 0.1 m. Watersheds were delimited using the ‘Hydrology’ and ‘Spatial analyst’ toolboxes available in ARCGIS 9.0 (ESRI, Inc.). We used flow direction within the DEM to delimit watersheds. First, artificial sinks and peak were eliminated by comparing elevations between the neighbouring cells. Then the D8 algorithm (Jenson & Domingue Reference Jenson and Domingue1988), which calculates the difference in altitude between each cell and its eight surrounding cells, was used to determine the flow direction for each cell. These flow directions were used to derive a flow accumulation grid which reassembled a drainage network, since each cell contained a value representing the number of cells upstream. The mouth of each basin was selected by visual inspection, and the upstream watersheds were then delimited and converted to polygons. The cumulative flux was reclassified to generate a simplified drainage network, where those areas with a contribution greater than 20 000 cells or 20 000 km2 were highlighted. The Brazilian National Water Agency's (ANA) database was used to delimit smaller hydrological units (subwatersheds). The subbasins were aggregated in order to obtain a relative uniformity and a scale compatible with that suggested by Magnusson (Reference Magnusson2001, Reference Magnusson2002) to delimit potential management units for government authorities planning land use and conservation actions.
Deforestation
Deforestation in the study region was determined by using data from the Brazilian Programme for Monitoring the Amazon Forest by Satellite (PRODES [Programa de Monitoramento da Floresta Amazônica Brasileira por Satélite]) (INPE 2008). PRODES quantified deforestation in Brazilian Legal Amazon predominantly from the digital classification of Landsat images (detailed methodology of PRODES can be accessed in Portuguese at URL http://www.obt.inpe.br/prodes/metodologia.pdf). The minimum identified deforested area was 6.25 ha. In order to obtain cumulative deforestation for the period 2001–2008, annual mosaics were derived from PRODES deforestation polygons of Brazilian Legal Amazon. The 2000 mosaic indicated cumulative deforestation from years previous to 2000, while the mosaics for 2001–2008 indicated the annual deforestation rate. The annual mosaic for 2001–2002 was derived from 161 images, the mosaic for 2002–2003 from 191 images, the mosaic for 2003–2004 from 207 images, the mosaic for 2004–2005 from 211 images, the mosaic for 2005–2006 from 211 images, the mosaic for 2006–2007 from 213 images and the mosaic for 2007–2008 from 214 images.
Protected areas and indigenous lands
The Brazilian National System of Protected Areas (SNUC [Sistema Nacional de Unidades de Conservação]) divides protected areas (PAs) into two major categories, namely strictly protected areas, where biodiversity conservation is the principal objective, and sustainable use areas, which allow for varying forms and degrees of human presence and use of natural resource, and where biodiversity conservation is a secondary objective. Strictly protected areas include five sub-categories: ecological station, biological reserve, national park, natural monument and wildlife refuge. Sustainable use areas are divided into seven subcategories: environmental protected area, area of relevant ecological interest, national forest, extractivist reserves, fauna reserves, sustainable development reserves and natural private reserves (SNUC, Brazilian Law 9.985; Silva Reference Silva2005). Although all these categories are considered PAs, strictly protected and sustainable use areas were separated during data processing. The borders of the federal PAs were obtained from the Ministry of Environment (MMA/IBAMA [Ministério do Meio Ambiente/Instituto Brasileiro do Meio Ambiente e dos Recursos Naturais Renováveis]) and the borders of state PAs were obtained from state environmental agencies. The borders of ILs were obtained from the Brazilian Indian Foundation (FUNAI [Fundação Nacional do Índio]). All PAs and ILs created before August 2009 were included in this analysis. PAs and ILs are together denominated as ‘conservation areas’. In the various cases where historical factors have led to an overlay of ILs and PAs, the superimposed areas were discounted to calculate total conservation area. We used statistics from the World Database on Protected Areas (WDPA 2009) to compare Brazil with other tropical countries.
Data processing
After creating the database in vector format, data were transformed to Albers conical projection with local datum (Datum SAD [South American Datum] 1969). In a next step, the polygons corresponding to deforestation, sustainable use PAs, strictly PAs, ILs, watersheds and sub-watersheds were combined. Polygon areas were recalculated and computed for each large watershed and subwatersheds. For world data processing, data were transformed to sinusoidal with geocentric datum (Datum WGS [World Geodetic System] 1984) and we applied the same procedure to combine tropical countries with the WDPA (WDPA 2009).
Statistical analysis
We used analysis of variance (ANOVA) to compare the annual deforestation rates for the period 2001–2008 among watersheds. Mean deforestation rates were also compared using Tukey's test (α = 0.05). In this way, it was possible to classify the watersheds in terms of their relative deforestation rates, indicating the most critical areas of the Brazilian Amazon, where the most rapid changes of land cover were taking place.
RESULTS
The DEM derived geostatistically from the SRTM 30 images proved more useful for modelling topography and delimiting watersheds than the original SRTM 30 surface. The transformed DEM with 0.1 m vertical resolution eliminated most of the surface imperfections that constrained watershed delimitation, particularly in the large flood plains that are common in the Amazon Basin.
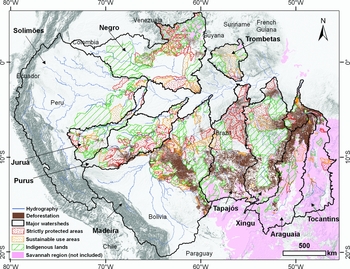
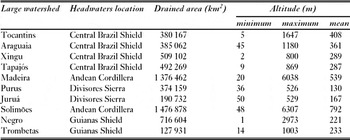
The study area contained the 10 largest watersheds of Brazilian Amazon, eight draining to the Amazon River and two to the Tocantins Basin (Fig. 1). Drainage areas varied from 127 931 km2 for the Trombetas river to 1 476 878 km2 for the Solimões river (Table 1). The borders of watersheds compared well with those derived with the classical methods currently used by the Brazilian National Water Agency to delimit South American Basins at a 1:1 000 000 scale (Pfafstetter Reference Pfafstetter1989; Silva Reference Silva1999). This same methodology, using geographical information systems (GIS) and the GTOPO 30, a global DEM developed by USGS, at 30-second resolution (c. 1.0 km), has also been validated and applied in major watersheds worldwide (Verdin & Verdin Reference Verdin and Verdin1999).
Major watersheds of the Brazilian Legal Amazon derived from the analysis of SRTM 30 data and distribution of deforestation, protected areas (sustainable use areas and strictly protected areas) and indigenous lands.

Characteristics of large river basins of the Brazilian Legal Amazon derived from the analysis of SRTM 30 data.

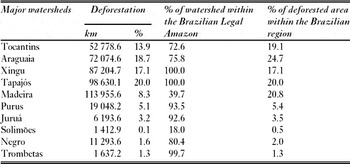
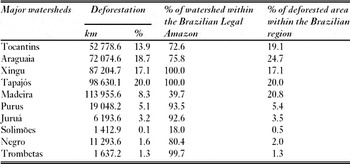
The Tocantins, Araguaia, Xingu, Tapajós, Madeira, Purus and Juruá watersheds, located in the southern Amazon, had the highest deforestation rates. The largest deforested area (113 955 km2) was found in the Madeira Basin, followed by the Tapajós, Xingu, Araguaia and Tocantins basins (Table 2). When expressed as a percentage of total watershed area, the Tapajós river watershed presented the highest deforestation level at 20.0%; this is an underestimate because PRODES deforestation data do not include the savannahs constituting the Cerrado biome of Central Brazil (Fig. 1). Although the Madeira river basin presents the largest deforested area, the percentage of deforested area is low due to the large size of the drainage area.
Total and % deforested area in major watersheds of the Brazilian Legal Amazon in 2008. Percentage of each watershed within the Brazilian Legal Amazon and % deforested area in the Brazilian region.
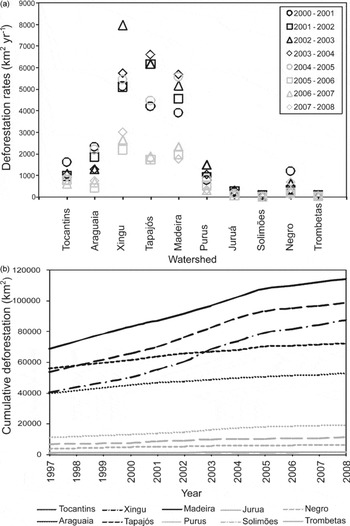
Annual deforestation rates in the last seven years (2001–2008) were highest (F = 49.32; p ≤ 0.001; n = 70) in the Xingu, Tapajós and Madeira rivers (Fig. 2a), and these basins show a similar trend in cumulative deforestation (Fig. 2b). In 2002–2005, the highest deforestation rates occurred in the Xingu, Tapajós, Madeira and Purus basins. Analysis of temporal trends in deforestation rates for the Tapajós and Madeira basins shows a significant increase during the period 2001–2005 (Fig. 2a). Conversely, in the eastern part of the Arc of Deforestation, where the Araguaia and Tocantins river basins are located, the deforestation rates were higher in 2001 and 2002 (Fig. 2a). In the last three years (2006–2008), deforestation rates were lower in all the watersheds (Fig. 2a).
(a) Deforestation rates from 2001 to 2008 and (b) cumulative deforestation since 1997 in major watersheds in Brazilian Legal Amazon.

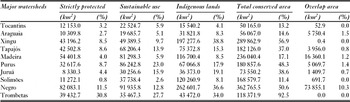
In six of the 10 major watersheds analysed, more than 25% of the total area was classified as protected by PAs and ILs, excluding superimposed areas (Table 3). The basins most affected by deforestation, the Madeira, Tapajós and Xingu, had 17.1, 37.0 and 56.9% of their area covered by PAs and ILs, respectively. With regard to superposition of PAs and ILs, the Negro basin had the greatest percentage overlap (10.3%), followed by the Araguaia (1.5%), Purus (1.4%) and Madeira (1.2%) basins.
Strictly protected areas, sustainable use areas, indigenous lands, total conserved area (excluding overlaps of categories) and overlap areas in major watersheds in Brazilian Legal Amazon up to August 2009.
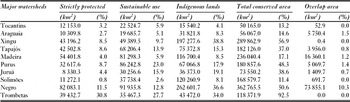
The Negro basin had the greatest extent of strictly PAs (>80 000 km2, equivalent to 11.5% of the total basin area), followed by the Madeira, Xingu and Tapajós basins, in decreasing order. The greatest percentage of strictly protected areas normalized by watershed area was found in the Trombetas River basin (30.8%). The Juruá, Araguaia and Tocantins basins had the least percentage area under strictly protected categories (Table 3). The Negro basin also had a large area of sustainable use PAs (>90 000 km2, or 12.8%), followed by the Purus, Madeira and Tapajós River basins. The Trombetas basin had 27.7% of its total area protected by sustainable use PAs, while the Araguaia, Tocantins and Juruá basins had the least area covered by sustainable use PAs. The greatest areas covered by ILs were observed in the Negro (>220 000 km2), Xingu (>197 000 km2) and Solimões (>110 000 km2) River basins. The Xingu basin had 38.8% of its total basin area protected by ILs, followed by the Negro (36.6%) and Trombetas (34.0%) basins.
The PAs and ILs within all watersheds cover a total area of 1 718 386 km2 (excluding superimposed areas), against 464 229 km2 of deforested area. The percentage of conservation area varies from 13.2% for the Tocantins basin to 92.5% for the Trombetas basin (Table 3). In addition to the Trombetas basin, the most conserved watershed, the Negro basin has more than 362 000 km2 of conservation areas (50.6 % of the basin), including an extensive mosaic of PAs and ILs which protect most of its headwater region.
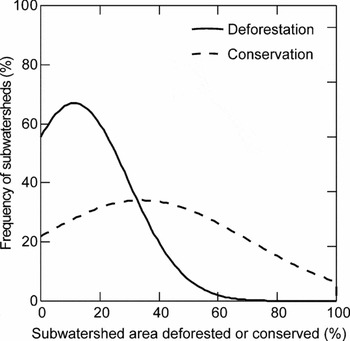
Although the analysis was carried out at the level of large river basins, with drainage areas >100 000 km2, it is important to point out that basins of this size are not adequate for planning watershed management policies and practices. For this reason, we further divided the Brazilian Legal Amazon into 927 subwatersheds, with average areas of about 5000 km2, as potential management units for planning land use and conservation actions, and analysed the frequency distributions of deforestation and conservation in these subwatersheds (Fig. 3). Although 66.6% of these 927 subwatersheds showed <1% of deforestation, 21.2% showed >20% deforestation, the level at which hydrological impacts become more significant, according to thresholds established by microcatchment experiments (Bosch & Hewlett Reference Bosch and Hewlett1982; Andréassian Reference Andréassian2004; Bruijnzeel Reference Bruijnzeel2004; Brown et al. Reference Brown, Zhang, Mcmahon, Western and Vertessy2005). With regard to the level of conservation, 27.4% of the subwatersheds presented no protected areas intersecting their drainage areas. However, 58.6% of the subwatersheds were above the global target value of 10% of land area under protection proposed by World Parks Congress (WPC 2003) and 7.8% were totally protected. Overall, in the subwatersheds, the average deforested area was 11.3% and average conserved area was 34.1%.
Frequency distribution of deforestation and conservation levels (%) by 927 subwatersheds over Brazilian Legal Amazon.

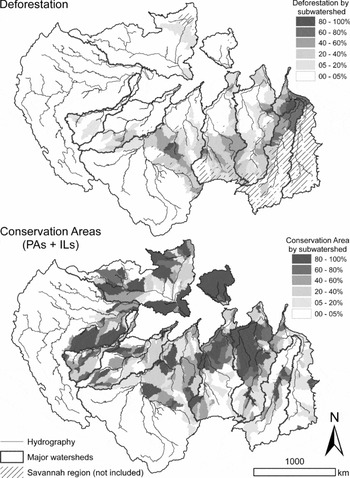
The analysis by subwatersheds permitted a separation of critical regions, in terms of deforestation, and most conserved regions within each large watershed (Fig. 4). In the lower reaches of the Tocantins and Araguaia basins, some subwatersheds had >80% of their area deforested. In the upper Xingu basin, there was already significant deforestation along several tributaries. The most impacted tributaries were the Comandante Fontoura (55% of the subbasin deforested) and Manissauá-Miçú (>50% deforested) Rivers. Other Xingu subwatersheds also showed significant levels of deforestation, such as the Suiá-Missú (35%), Ronuro (21–29%) and Coluene (13–24%) subbasins. On the upper Tapajós, the area drained by the principal tributaries showed high levels of alteration in forest cover. Subwatersheds of the Juruena River varied from 36 to 67% deforested and subwatersheds of the Teles Pires River were 25–56% deforested. Other subwatersheds in the Tapajós headwaters showed 11–45% deforestation. In the middle Madeira basin, subwatersheds of the left margin of the Guaporé River were 9–48% deforested, while subwatersheds of the Ji-Paraná River were 24–82% deforested. The Ji-Paraná watershed was one of the most impacted basins in the Brazilian Amazon, with the Jarú River being the most deforested (82%). Other tributaries, such as the Jamari and Aripuanã had 48 and 29% of their subwatersheds deforested, respectively. The upper region of the Purus basin also showed high deforestation levels, such as the subwatersheds of the Acre River, where some tributaries reached 51% deforestation. On the upper Juruá, small subwatersheds in the headwater region showed 39% deforestation. In the Negro basin, the most impacted subwatersheds were situated in the Branco River headwaters region; for example the Jauaperí subwatershed showed 18% deforestation.
Percentage deforestation and conservation areas by subwatersheds of major watersheds of the Brazilian Legal Amazon.

Conserved subwatersheds were distributed along large watersheds without an apparent logical pattern, differing from the pattern observed for more deforested subbasins, which are generally associated with regional economic dynamics of the Arc of Deforestation (Fig. 4). In the Xingu and Tapajós basins, the middle and lower regions were the most conserved, while in the Tocantins, Araguaia, Purus and Juruá basins, conserved subwatersheds were dispersed throughout the drainage area. In Negro basin, the upper regions of the Negro and Branco Rivers were better conserved. In the Trombetas basin, almost all subwatersheds were fully protected and, in the Brazilian portion of the Solimões basin, there were also many fully protected subwatersheds.
DISCUSSION
Deforestation, protected areas and indigenous lands in major Amazon watersheds
Since the Tocantins and Araguaia rivers drain extensive savannah areas (62.2 and 56.9% of their basins, respectively), the small portions of the basins which were originally covered by forest are now almost completely deforested. The Cerrado has been the chief region for agricultural expansion in recent decades and is the Brazilian biome with the highest deforestation rates (up to 1.1 % per year) because of many areas with gentle relief, the proximity to infrastructure such as roads and the possibility of improving soil fertility with applications of limestone and fertilizers. The Cerrado areas most impacted by deforestation are located in the headwaters of the Tocantins and Araguaia rivers (Eva et al. Reference Eva, de Miranda, di Bella, Gond, Huber, Sgrenzaroli, Jones and Coutinho2004; Machado et al. Reference Machado, Ramos Neto, Pereira, Caldas, Gonçalves, Santos, Tabor and Steininger2004). The Cerrado also covers a significant proportion of the Xingu (8%) and Tapajós (13.5%) river basins. These areas are distributed along the savannah-forest transition zone, and are considered part of the Arc of Deforestation of Southern Amazonia. If the savannahs of the Cerrado were included in this analysis, deforestation levels would have been higher in these basins.
The upper Madeira basin drains mainly Bolivian territory, and to a lesser degree, the Peruvian Amazon. Deforestation rates in Bolivia, close to the Brazilian border, have increased during the last decades, due primarily to an increase in medium and large-scale agricultural exploitation. Since the 1980s, deforestation has also advanced rapidly near Santa Cruz de la Sierra, in the upper Madeira Basin (Pacheco Reference Pacheco2006; Killeen et al. Reference Killeen, Calderon, Soria, Quezada, Steininger, Harper, Solórzano and Tucker2007). However, because of the lack of information regarding deforestation in Peru and, in particular, in Bolivia, where a third of the drainage area of the Madeira river is located, it is clear that total deforestation rate in the Madeira Basin was underestimated in this study. Since the Madeira River is an important route for commercial barge transportation in western Amazonia, changes in sediment load caused by deforestation and erosion can significantly impact its use as a waterway. Moreover, an increase in sediment load may also affect energy production by Santo Antônio and Jirau hydroelectric dams, which will begin to operate in 2012, with a combined capacity of 6500 MW, equivalent to 8% of Brazil's current power demand.
There is a similar lack of information regarding LUCC activities in the upper Solimões and Negro Basins. Deforestation in the Solimões basin was considered as relatively low, partly because our analysis was limited to 18% of the total drainage area, corresponding to the portion located within Brazil and also because this part of the basin is sparsely populated.
In the eastern part of the Arc of Deforestation, where the Araguaia and Tocantins river basins are located, the original vegetation, predominantly Cerrado, has almost disappeared. The lower deforestation rates observed since 2000 in this region are clearly associated with the reduced availability of new areas for agricultural expansion. Due to the greater availability of forested areas in the agricultural frontiers of the southern and western ends of the Arc, which include the Xingu, Tapajós, Madeira, Purus, and Juruá basins, deforestation rates increased faster in these areas, up until 2005 (Fig. 2). In this period, there was a shift in demand for new agricultural lands towards the western part of the Arc, affecting principally the Purus basin, as the result of the reduction in areas of forest available for conversion to agricultural land in the southern part of the Arc.
Deforestation rates were lower in all of the watersheds in 2006–2008 because of several factors whose influences are difficult to separate. Government crackdowns on illegal deforestation, such as Operation ‘Curupira’ carried out by the Brazilian Federal Police during 2006, and other government operations after that may have contributed to this reduction. Economic factors also may have had a direct influence on deforestation rate, as the lower prices for soybeans and beef and the dollar exchange rate were all unfavourable for agricultural expansion during those years.
While all of the major watersheds have been affected by the deforestation, in most cases the balance between conservation and deforestation is still favourable. Although area is not necessarily an absolute criterion for conservation value, it is significant that the total conserved area within the Legal Amazon is three times greater than the area deforested. However, the percentage of conservation area varied from 13.2% for the Tocantins basin to 92.5% for the Trombetas basin (Table 3), so some basins are better protected than others.
The distribution of deforestation within the basins also has important consequences. In the southern watersheds most deforestation has occurred in the headwater regions, where it can affect hydrological and biogeochemical processes throughout the basin. Even the Xingu basin, which includes the largest proportion of conservation areas, has experienced intensive deforestation in its headwater region. The impacts are lower in the northern watersheds where most headwater regions remain intact. With the exception of the Tocantins and Araguaia basins, the percentage of conservation areas in the form of PAs and ILs is still greater than the deforested area in most major basins in the Brazilian Legal Amazon.
Brazilian subwatersheds as management units for planning land use and conservation actions
Along the Arc of Deforestation, subwatersheds show different levels of alteration of forest cover. It is important to emphasize that savannah regions were not included in this analysis. In considering the spatial distribution of deforestation and its relation to PAs and ILs in the Brazilian Legal Amazon (Fig. 1), it is clear that many PAs and ILs have become isolated by surrounding deforestation and their hydrological functions and ecological sustainability may be affected. An example is the Xingu Indigenous Park, one of the most important indigenous lands of the Amazon. The headwaters of the Xingu River were not included when the Park was delimited in 1961. The adjacent unprotected area has since been affected by intense deforestation and agricultural activities (Fig. 1). Along the borders of the Park, there is a clear divide between soybean plantations and protected forest. Streams that begin on farms and then flow into the Park are often severely impacted. Similar problems are found in other PAs and ILs in the region. In some tributaries of the Madeira basin, such as the Guaporé and Ji-Paraná subwatersheds, deforestation has isolated several PAs and ILs into what may be ecologically dysfunctional forest fragments. Since the lands surrounding many parks and reserves are now occupied, it is difficult to redefine park borders in order to constitute more functional ecological units.
Our analysis focused on large-scale processes on the watershed and subwatershed level, and the importance of reserving portions of these watersheds as conservation area as part of national conservation policies. However, it is important to point out that smaller scale issues, such as the characteristics of local land use practices outside such conservation areas, may have equal or greater impacts on hydrological functions. At the moment, Amazonian frontiers are characterized by a synergy between road construction, logging, agricultural colonization, cattle ranching and, in some regions, gold mining, all in a context of little government control. Environmental regulations (CONAMA [Conselho Nacional de Meio Ambiente] Resolution 303/2002) as to the preservation of riparian corridors (a strip of forest at least 30 m wide on each side of streams up to 10 m breadth, and wider for larger streams, and preservation of forest in a 50 m radius around springs), as well as forests on slopes greater than 45°, are widely ignored. As such, there is much room for improvement with regard to land use practices and their effects on the hydrological functions and environmental services outside of conservation area, independent of the percentage of area conserved on a subwatershed level.
Deforestation and conservation in watersheds of the Amazon: development versus integrity of hydrological processes
The Amazon region presents the highest deforestation rates of the planet, but also the most rapid expansion of conservation area. In those basins under anthropic pressure, the course of land use development determines the balance between deforested and conserved areas, which in turns affects the hydrological cycle within those basins. Changes in land cover in the watersheds of major Amazon tributaries can cause a series of hydrological impacts, among which is the increase of discharge associated with deforestation. However, this conclusion is based primarily on the results of small catchment experiments (Bosch & Hewlett Reference Bosch and Hewlett1982; Andréassian Reference Andréassian2004; Bruijnzeel Reference Bruijnzeel2004; Brown et al. Reference Brown, Zhang, Mcmahon, Western and Vertessy2005). The aggregation and extrapolation of hydrological processes from micro- to macro-scales poses a major scientific challenge, particularly in the Amazon where tributaries can drain areas greater than 100 000 km2.
While some attempts have been made to evaluate the impact of deforestation in larger basins, the results to date have been ambiguous. Studies during the 1980s suggested that an observed increase in the Amazon River's discharge could be a consequence of the deforestation in the Andes (Gentry & Lopes-Parodi Reference Gentry and Lopes-Parodi1980, Reference Gentry and Lopes-Parodi1982). Later research concluded that the observed increased in discharge was actually part of a natural climate cycle (Nordin & Meade Reference Nordin and Meade1982; Sternberg Reference Sternberg1987). Although a long term increase of 24% in the discharge of the Tocantins River has been attributed to LUCC (Costa et al. Reference Costa, Botta and Cardille2003), a similar discharge trend reported for the Paraguay River, whose headwaters are close to the Tocantins basin and where longer discharge records are available, was attributed to natural climate variability and not to LUCC (Collischonn et al. Reference Collischonn, Tucci and Clarke2001).
The study of hydrological trends in major Amazon tributaries poses an important scientific challenge, since the potential effects of deforestation are confounded with variation in natural climate cycles, which are particularly intense in the Amazon. The scarcity of long-term historical information on discharge patterns makes it difficult to evaluate the impacts of deforestation in some watersheds, and even where these data are available it is difficult to separate the effects of LUCC from those associated with natural climate fluctuations.
Demographic, political and economic factors are the main drivers of LUCC, and considering the wide variety of problems, consequences and solutions involved, it is a major challenge for government to develop appropriate strategies for sustainable regional development. The need for effective land use policies is especially critical in the southern Amazon, where expansion of the agriculture frontier is affecting the headwaters of major tributaries. Areas classified as savannah-forest transition ecotones have now been prioritized for conservation and, in response to recent increases in deforestation rates, a series of PAs of different types has been created, mainly in the Xingu, Tapajós and Trombetas River basins.
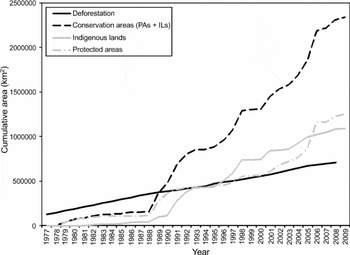
The creation of PAs and ILs brings important indirect benefits when they are ‘wisely allocated’, since they can minimize both deforestation and forest fires (Nepstad et al. Reference Nepstad, Schwartzman, Banberger, Santilli, Ray, Schlesinger, Lefebvre and Alencar2006). In fact, the Brazilian government has been creating such areas as ‘barriers’ to containing the advance of the Arc of Deforestation. An example of such a barrier is the ‘Terra do Meio’ conservation mosaic in Pará State, created between 2004 and 2008, and extending from the Xingu to the Tapajós River. A group of 14 PAs were created, consisting of three national parks, three extractivist reserves, two environmental protected areas, one ecological station and five national forests, totalling 132 281 km2 and contiguous with 10 ILs and four other PAs. Likewise, the state of Amazonas created nine PAs in 2005 for the Southern Amazonas State Conservation Mosaic, linking federal PAs and ILs into a solid front, with the express purpose of creating a barrier to prevent deforestation from spreading from neighbouring Mato Grosso state. Zimmerman et al. (Reference Zimmerman, Peres, Malcolm and Turner2001) showed the effect of the Kayapó and Xikrin do Cateté ILs as barriers to deforestation in Pará, demonstrating the conservation benefits that can be achieved by supporting sustainable development of indigenous peoples in the Amazon. However, throughout the Brazilian Legal Amazon, deforestation rates have remained high, despite the creation of many ILs and PAs since 1977 (Fig. 5).
Cumulative deforestation and creation of PAs, ILs and total conservation areas (PAs + ILs) in Brazilian Legal Amazon since 1977.

Comparisons between ILs and PAs in terms of their capacity for containing deforestation have revealed no significant differences in the degree of protection afforded by each (Nepstad et al. Reference Nepstad, Schwartzman, Banberger, Santilli, Ray, Schlesinger, Lefebvre and Alencar2006). In practical terms, ILs and PAs provide almost the same degree of protection to the forest, although the land use restrictions which apply to each are quite different. ILs may be subject to future changes in their patterns of land use, as their indigenous populations grow and make greater demands on natural resources as sources of livelihood. Many ILs have been affected by varying degrees of impacts from illegal logging (Gascon et al. Reference Gascon, Williamson and da Fonseca2000; Laurance et al. Reference Laurance, Albernaz and Costa2001; Schwartzman & Zimmerman, Reference Schwartzman and Zimmerman2005), illegal colonization and ranching (Laurance et al. Reference Laurance, Albernaz and Costa2001), fires (Adeney et al. Reference Adeney, Christensen and Pimm2009), hunting (Suárez et al. Reference Suárez, Cueva, Bucheli, Zapata-Ríos, Toral, Torres, Prado and Olalla2009), illegal gold mining (Schwartzman & Zimmerman Reference Schwartzman and Zimmerman2005) and other forms of encroachment with or without consent of their indigenous habitants. In addition to these threats, ILs and PAs from Brazilian Amazon have also been affected by large infrastructure projects, such as hydroelectric dams (Fearnside Reference Fearnside1995, Reference Fearnside2002), oil and gas projects (Finer et al. Reference Finer, Jenkins, Pimm, Keane and Ross2008; Suárez et al. Reference Suárez, Cueva, Bucheli, Zapata-Ríos, Toral, Torres, Prado and Olalla2009), mining (Laurance Reference Laurance1998; Laurance et al. Reference Laurance, Albernaz and Costa2001), roads (Nepstad et al. Reference Nepstad, Carvalho, Barros, Alencar, Capobianco, Bishop, Moutinho, Lefebvre, Lopes Silva and Prins2001; Fearnside Reference Fearnside2007) and the indirect effects of these activities (Suárez et al. Reference Suárez, Cueva, Bucheli, Zapata-Ríos, Toral, Torres, Prado and Olalla2009).
The last two decades have seen the creation of more than 2 000 000 km2 of conservation areas in the Brazilian Legal Amazon. From 1988 to 1992, there were great advances in conservation in the Brazilian Amazon with the creation of more than 600 000 km2 of PAs and ILs. Between 1994 and 2005, there was a significant increase in the creation of ILs with the creation or final legal recognition of large areas, such as Xingu Indigenous Park and Kayapó IL in 1991, Yanomami IL in 1992, Menkragnoti IL in 1993, Tumucumaque Indigenous Park in 1997, Alto Rio Negro IL in 1998, Vale do Javari IL in 2001, Munduruku IL in 2004 and Trombetas/Mapuera IL and Raposa Serra do Sol IL in 2005. These 10 large ILs together contribute with about 500 000 km2, and their influence in conservation of the Brazilian Amazon is clear (Fig. 5). Although from 1990 to 2000 few PAs were created, since 2000, 132 PAs were created by state and federal government, constituting mosaics of several categories of PAs with different land use restrictions, equivalent to around 500 000 km2. However, policy makers involved in the creation of new conservation areas must consider the regional pattern of LUCC if they hope to reduce deforestation rates. Most existing protected areas have only managed to change the direction of deforestation fronts, without reducing the overall rate of deforestation. The fact that deforestation rates have remained high from 2004 to 2006 despite the creation of over 200 000 km2 of PAs in the same period is clear evidence of this.
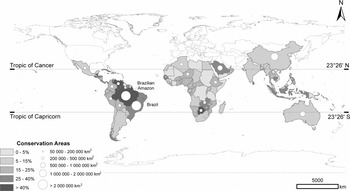
At the present time there are around 1 100 000 km2 of ILs and 1 250 000 km2 of PAs, which corresponds to >40% of the area of the Brazilian Legal Amazon (Fig. 6). While other tropical countries, such as Venezuela, Guatemala, Belize and Botsawana, have more than 40% of their territory protected for conservation, none of these have reserved more than 2 000 000 km2 (Fig. 6). As such, the Brazilian government is doing better than most other tropical nations with regard to environmental policies to protect terrestrial tropical ecosystems, and has four times more than the target set by the World Parks Congresses of 10% of each biome (WPC 2003). However, the de facto implementation and protection of these conservation areas, often in remote locations, remains a great challenge for a developing country such as Brazil. In this scenario, the valuation of ecosystem services supplied by protected areas will play a key role in the establishment of environmental policies and actions on both national and international levels. In order for forest cover to remain intact, it must generate some form of income for its indigenous or traditional inhabitants, and ideally, provide the financial means for the government to improve its methods of licensing, monitoring and controlling different land use activities, especially those with greater potential for environmental impacts. Interest in meeting this challenge is not limited to Brazil, as the ecosystems services provided by Amazonia go far beyond territorial limits.
Total and % area covered by conservation areas in tropical countries.

The impetus to create new PAs remains intense, through both governmental and non-governmental interests. The initiative of the Brazilian government, together with NGOs and international partners, to create the Amazonian Protected Areas Programme (ARPA) is a clear example. This programme has as its goal the protection of 500 000 km2 in Brazil or c. 12.0% of the Amazon forest biome, equivalent to c. 3.6% of the world's tropical forests (Silva Reference Silva2005). Although some priority areas such as biodiversity hotspots and endemisms have been identified (Silva et al. Reference Silva, Rylands and Fonseca2005; Secretaria de Biodiversidade de Florestas/Ministério do Meio Ambiente 2007), choice of the location of conservation areas in the Brazilian Amazon has been largely determined by anthropic trends, socioeconomic development and lack of deforestation, without considering the hydrologic framework. The lack of an integrated watershed management perspective is an important gap, as conservation areas in different portions of the watershed (lower, middle and upper) respond differently to human disturbances transmitted through the hydrologic cycle (Pringle Reference Pringle2001). Watersheds are functional ecological units which, once protected, will conserve most of the ecosystems, communities, populations and species present in them (Franklyn Reference Franklyn1993; Magnusson Reference Magnusson2001, Reference Magnusson2002). As such, watershed limits should be considered during the planning of locations and borders of new PAs, ILs, mosaics and ecological corridors.
In order to protect biodiversity, it is necessary to ensure the ecological integrity of conservation areas and this can be most easily achieved by conserving entire drainage basins. The watershed database ‘Ottobacias’ constructed by ANA may aid decision makers planning land use and conservation actions in Brazil, since it allows fitting to spatial phenomena through upscale and downscale. Given the sheer size of the Amazon watershed, an integrated land use plan will require the active participation of all countries, states, municipalities and local communities within the Amazon basin.
CONCLUSIONS
The DEM derived from SRTM 30 data provided a valid basis for delimiting large-scale drainage patterns in the Brazilian Legal Amazon, with the exception of floodplain areas where the horizontal and vertical resolutions were apparently inadequate for deriving flow directions. The interpolation of the 30-minute DEM to a finer vertical resolution showed promise for overcoming these limitations. This analysis showed that deforestation varied greatly among larger Amazon watersheds. The watersheds of the Southern Amazon were more impacted, since they are located in the Arc of Deforestation, where forest is being rapidly converted to pasture and agriculture land. The highest annual deforestation rates in this region were observed in the Madeira, Tapajós and Xingu river basins. The headwaters of watersheds in the Southern Amazon present higher deforestation levels, which may be affecting hydrological functions and ecological sustainability throughout the system. PAs and ILs cover extensive areas of the large Amazon watersheds, and c. 92% of the Trombetas basin and 57% of the Xingu basin are currently protected by PAs and ILs. At the other extreme, only 13.2% of the Tocantins drainage basin is currently protected. Although large areas have already been deforested in Brazilian Legal Amazon, the balance between deforestation and conservation is still positive from the perspective of ecological processes and conservation. Even in the southern part of the Amazon basin, where the deforestation rates are much higher, protected areas cover a significant proportion of the drainage area. The creation of PAs and ILs has altered the path of deforestation but has not significantly slowed its rate. The strategic positioning of new protected areas could help slow the advance of deforestation and contribute to a more sustainable development in the region.
ACKNOWLEDGEMENTS
The Coordenação de Aperfeiçoamento de Pessoal de Nível Superior (CAPES) provided financial support to Ralph Trancoso. This work was developed at INPA's Geoprocessing and Spatial Analysis Laboratory (SIGLAB) and was supported in part by the Geoma network. We thank Edwin Keizer for valuable comments in the conception of this research idea and three anonymous referees for many useful comments on the manuscript.