I. INTRODUCTION
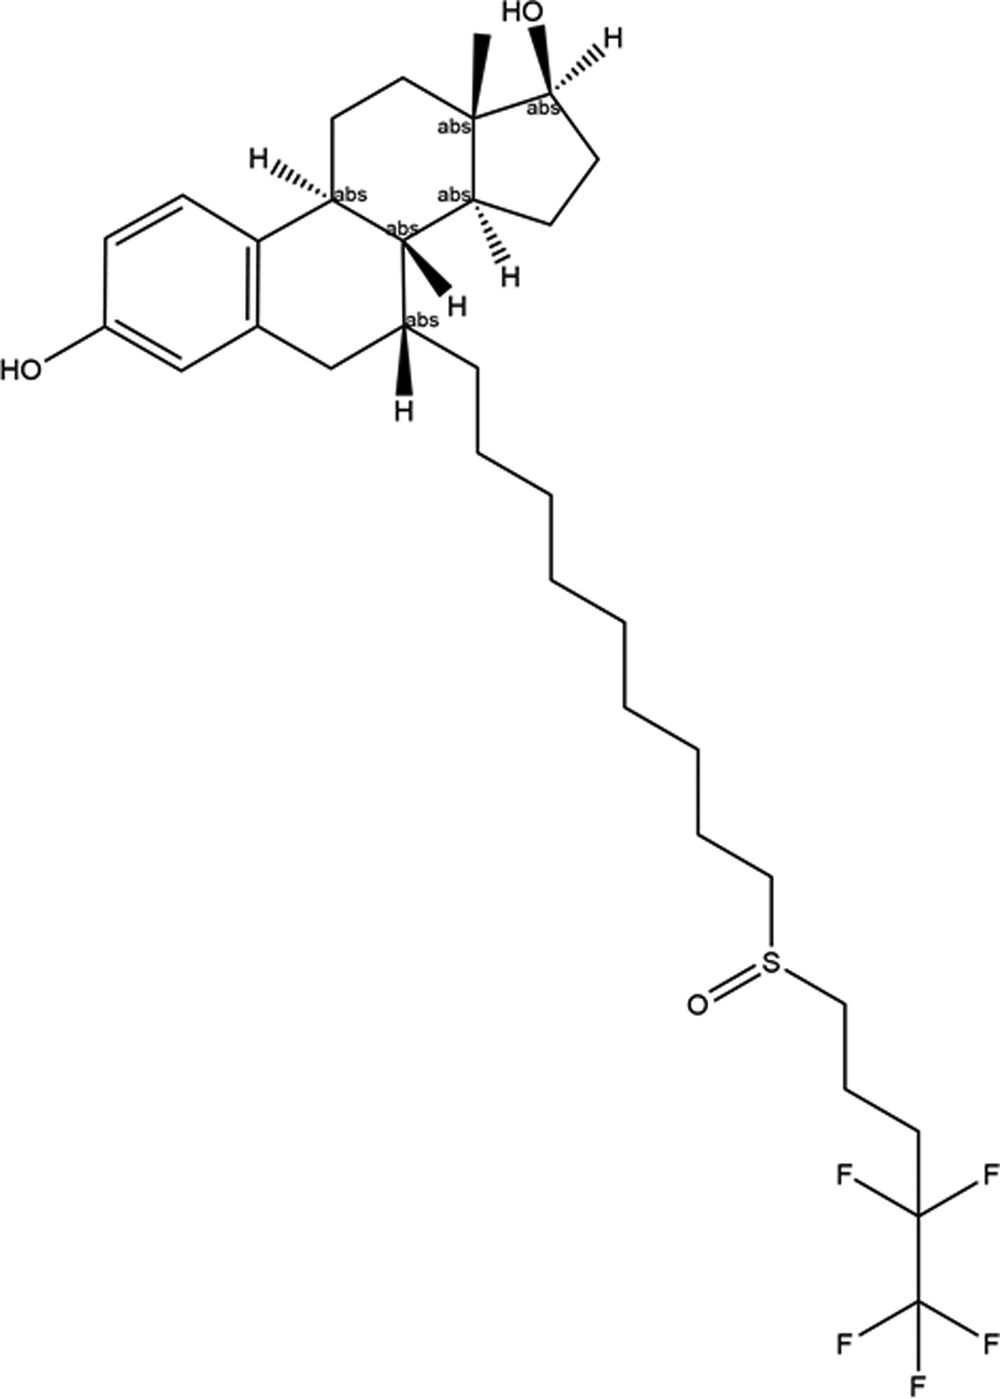
Fulvestrant, sold under the brand name Faslodex® among others, is used to treat metastatic breast cancer that is advanced or spread to other parts of the body, in post-menopausal women. Fulvestrant is given as an injection, and it can be used alone or in combination with ribociclib (Drugs.com, 2022). The systematic name (CAS Registry Number 129453-61-8) is (7R,8R,9S,13S,14S,17S)-13-methyl-7-[9-(4,4,5,5,5-pentafluoropentylsulfinyl)nonyl]-6,7,8,9,11,12,14,15,16,17-decahydrocyclopenta[a]phenanthrene-3,17-diol. A molecular diagram of fulvestrant, including the absolute configurations of the chiral centers, is shown in Figure 1.
The 2D molecular structure of fulvestrant.

Fulvestrant was the first selective estrogen receptor degrader to be approved for medical applications in the United States in 2002 and in Europe in 2004. US Patent 4,659,516 (Bowler and Tait, Reference Bowler and Tait1987; Imperial Chemical Industries) describes processes for preparing steroids such as fulvestrant. International Patent Application WO2006/015081 (Macdonald et al., Reference Macdonald, Bigatti and Rossetto2006; Sicor) describes the preparation of another form of fulvestrant. US Patent Application 2014/0088061 A1 (Castillo et al., Reference Castillo, Iturraspe and Nunez2014) refers to a solid pharmaceutical composition containing amorphous fulvestrant and provides diffraction patterns of crystalline fulvestrant from two suppliers (Scinopharm and Sicor). The patterns are, however, of very poor quality, and suitable only for qualitative examination. Micronization of fulvestrant (using ethyl acetate as the solvent) was studied by Tien et al. (Reference Tien, Su, Lien and Chen2010), and powder data for both the original API and processed material are provided in the Supplementary Material of that paper. Fulvestrant Type A is claimed in Chinese Patent Application CN101525364A (Li et al., Reference Li, Wang, Li, Xu and Sun2008), and a diffraction pattern is provided.
This work was carried out as part of a project (Kaduk et al., Reference Kaduk, Crowder, Zhong, Fawcett and Suchomel2014) to determine the crystal structures of large-volume commercial pharmaceuticals, and include high-quality powder diffraction data for them in the Powder Diffraction File (Gates-Rector and Blanton, Reference Gates-Rector and Blanton2019).
II. EXPERIMENTAL
Fulvestrant was a commercial reagent, purchased from U.S. Pharmacopeial Convention (USP) (Lot #R062G0), and was used as-received. The white powder was packed into a 1.5 mm diameter Kapton capillary, and rotated during the measurement at ~50 Hz. The powder pattern was measured at 295 K at beamline 11-BM (Antao et al., Reference Antao, Hassan, Wang, Lee and Toby2008; Lee et al., Reference Lee, Shu, Ramanathan, Preissner, Wang, Beno, Von Dreele, Ribaud, Kurtz, Antao, Jiao and Toby2008; Wang et al., Reference Wang, Toby, Lee, Ribaud, Antao, Kurtz, Ramanathan, Von Dreele and Beno2008) of the Advanced Photon Source at Argonne National Laboratory using a wavelength of 0.457899(2) Å from 0.5 to 50° 2θ with a step size of 0.001° and a counting time of 0.1 s per step. The high-resolution powder diffraction data were collected using 12 silicon crystal analyzers that allow for high angular resolution, high precision, and accurate peak positions. A silicon (NIST SRM 640c) and alumina (SRM 676a) standard (ratio Al2O3:Si = 2:1 by weight) was used to calibrate the instrument and refine the monochromatic wavelength used in the experiment.
Initial attempts to index the pattern (using several programs) yielded a high-quality (JADE figure of merit = 4, with 0 unindexed lines) primitive monoclinic cell having a = 8.71113, b = 11.69424, c = 12.92031 Å, β = 97.64°, and V = 1304.52 Å3. After initial attempts to solve the structure using this cell, larger cells were sought, and both JADE Pro (MDI, 2021) and N-TREOR (Altomare et al., Reference Altomare, Cuocci, Giacovazzo, Moliterni, Rizzi, Corriero and Falcicchio2013) yielded a rhombohedral cell having even better figures of merit (JADE FOM = 2, with 0 unindexed lines, and M20 = 40) with a = 23.38982, c = 16.51636 Å, and V = 7856.26 Å3. A reduced cell search in the Cambridge Structural Database (Groom et al., Reference Groom, Bruno, Lightfoot and Ward2016) yielded 32 hits, but no structures of fulvestrant derivatives. Name and formula searches each yielded no hits. Using the normal rule of thumb of 17 Å/non-H atom yielded Z = 11. Since there were no additional systematic absences, the most-probable space group (for a chiral compound) seemed to be R3, with Z = 9.
A fulvestrant molecule was downloaded from PubChem (Kim et al., Reference Kim, Chen, Cheng, Gindulyte, He, He, Li, Shoemaker, Thiessen, Yu, Zaslavsky, Zhang and Bolton2019) as Conformer3D_CID_5281769.sdf. It was converted into a *.mol2 file using Mercury (Macrae et al., Reference Macrae, Sovago, Cottrell, Galek, McCabe, Pidcock, Platings, Shields, Stevens, Towler and Wood2020). The structure was solved using DASH (David et al., Reference David, Shankland, van de Streek, Pidcock, Motherwell and Cole2006), using a single fulvestrant molecule and no Mogul Distribution Bias.
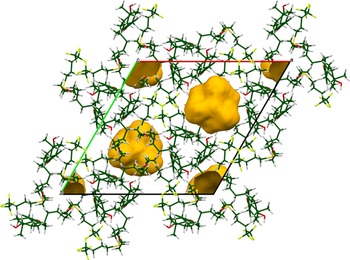
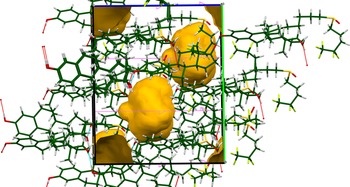
Rietveld refinement was carried out using GSAS-II (Toby and Von Dreele, Reference Toby and Von Dreele2013). Only the 1.9–18.0° portion of the pattern was included in the refinement (d min = 1.463 Å). The z-coordinate of the S atom was fixed to define the origin. All non-H bond distances and angles were subjected to restraints, based on a Mercury/Mogul Geometry Check (Bruno et al., Reference Bruno, Cole, Kessler, Luo, Motherwell, Purkis, Smith, Taylor, Cooper, Harris and Orpen2004; Sykes et al., Reference Sykes, McCabe, Allen, Battle, Bruno and Wood2011). The Mogul average and standard deviation for each quantity were used as the restraint parameters. The restraints contributed 8.6% to the final χ 2. The hydrogen atoms were included in calculated positions, which were recalculated during the refinement using Materials Studio (Dassault, 2021). The U iso were grouped by chemical similarity. The U iso for the H atoms were fixed at 1.3× the U iso of the heavy atoms to which they are attached. The structure contains a cavity along the threefold axis (Figure 2).
The crystal structure of unsolvated fulvestrant, illustrating the cavity in gold (probe radius = 1.2 Å). Figure generated using Mercury (Macrae et al., Reference Macrae, Sovago, Cottrell, Galek, McCabe, Pidcock, Platings, Shields, Stevens, Towler and Wood2020).

The content of the cavity was established to be trace amounts of water and ethyl acetate using NMR and TGA analysis. The NMR spectra were obtained using a 400 MHz Bruker Advance Spectrometer equipped with a multinuclear probe. The spectra of fulvestrant were measured in a solution of dry d6-DMSO (Sigma-Aldrich stored over flame dried 3Å-molecular sieves). Proton and 13C NMR (Supplementary Figures S1 and S2) correspond to reported spectra of fulvestrant (Brazier et al., Reference Brazier, Hogan, Leung, O'Kearney-McMullan, Norton, Powell, Robinson and Williams2010). As shown in Supplementary Figure S1, the 1H spectrum of fulvestrant shows a clear quartet at 4.03 ppm and a singlet at 1.99 ppm with relative integrations of 2:3. These signals correspond to the methylene and acetate methyl group, respectively, of ethyl acetate (Fulmer et al., Reference Fulmer, Miller, Sherden, Gottlieb, Nudelman, Stoltz, Bercaw and Goldberg2010). The signal for the terminal methyl protons of ethyl acetate which is reported at 1.17 ppm in d6-DMSO is obscured by the aliphatic C–H signals arising from the pharmaceutical. COSY-NMR spectroscopy (1H–1H), however, shows a correlation between the methylene signal at 4.03 ppm and a signal at ~1.17 ppm further suggesting the presence of ethyl acetate (Supplementary Figure S3). The 1H NMR spectrum also indicates the presence of trace water from a singlet at 3.33 ppm. The total integrations of ethyl acetate and water indicate only trace amounts of these compounds (2.5 and 16 mol%, respectively) relative to the quantity of fulvestrant. TGA analysis indicates only a small mass loss up to 200°C, which is consistent with the trace amount of ethyl acetate and water indicated by NMR analysis (Supplementary Figure S4).
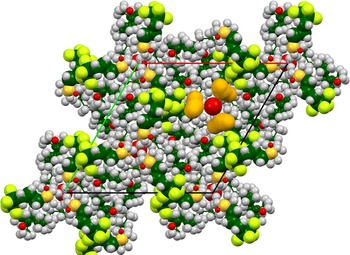
Water was present at 16 mol% relative to fulvestrant, and ethyl acetate was present at 2.5 mol%. An oxygen atom (water molecule O89) was placed on the threefold axis, and its position, occupancy, and U iso were allowed to refine freely. Its occupancy refined to 4.01(8) and its U iso to 1.37(4) Å2, so this atom is really a fudge factor to fit the electron density in the void. There were still voids present (Figure 3). Attempts to add additional atoms into the voids (the ethyl acetate concentration was too low for a reasonable refinement of a disordered rigid body) led to these atoms moving too close to atoms of the fulvestrant molecule, so they were removed. The peak profiles were described using the generalized microstrain model. The background was modeled using a 6-term shifted Chebyshev polynomial, plus a peak at 5.51° to model the scattering of the Kapton capillary and any amorphous component.
The apparent additional voids (probe radius = 1.2 Å) after the addition of O89. The atoms are represented by 50% probability spheroids. Atom types: C = dark green, H = gray, O = red, F = light green, S = yellow. Figure generated using Mercury (Macrae et al., Reference Macrae, Sovago, Cottrell, Galek, McCabe, Pidcock, Platings, Shields, Stevens, Towler and Wood2020).

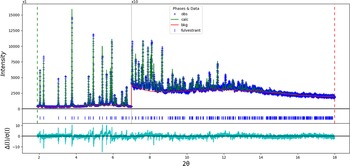
The final Rietveld refinement was begun from the results of the DFT optimization of the unsolvated structure (see below). The final refinement of 143 variables using 16 126 observations and 109 restraints yielded the residuals R wp = 0.0789 and GOF = 1.65. The largest peak (1.19 Å from C22) and hole (1.37 Å from C19) in the difference Fourier map were 0.27 and −0.21(6) eÅ−3, respectively. The largest errors in the difference plot (Figure 4) are in the shapes of some of the strong peaks.
The Rietveld plot for the refinement of fulvestrant. The blue crosses represent the observed data points, and the green line is the calculated pattern. The cyan curve is the normalized error plot. The vertical scale has been multiplied by a factor of 10× for 2θ > 7.0°.

A density functional theory geometry optimization (fixed experimental cell) and population analysis were carried out using CRYSTAL14 (Dovesi et al., Reference Dovesi, Orlando, Erba, Zicovich-Wilson, Civalleri, Casassa, Maschio, Ferrabone, De La Pierre, D-Arco, Noël, Causà and Kirtman2014). The basis sets for the H, C, and O atoms in the calculation were those of Gatti et al. (Reference Gatti, Saunders and Roetti1994), and those for F and S were those of triple zeta basis sets of Peintinger et al. (Reference Peintinger, Vilela Oliveira and Bredow2013). The calculation was run on eight 2.1 GHz Xeon cores (each with 6 GB RAM) of a 304-core Dell Linux cluster at IIT, using 8 k-points and the B3LYP functional.
III. RESULTS AND DISCUSSION
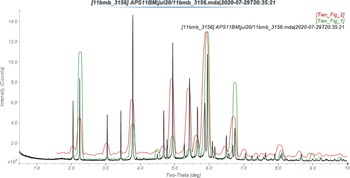
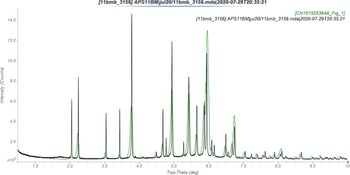
The pattern of the material studied here is similar enough to those of the original API of Tien et al. (Reference Tien, Su, Lien and Chen2010) and their processed material to conclude that they are the same form (Figure 5). The patterns in Castillo et al. (Reference Castillo, Iturraspe and Nunez2014) seem to be similar to those of Tien et al., but the poor quality makes it hard to be certain. The pattern of the material studied here is similar to that of Li et al. (Reference Li, Wang, Li, Xu and Sun2008), and we can conclude that they are the same (Figure 6).
Comparison of the synchrotron pattern (black) of fulvestrant to the patterns (green, red) reported by Tien et al. (Reference Tien, Su, Lien and Chen2010). The published patterns were digitized using UN-SCAN-IT (Silk Scientific, 2013) and scaled to the synchrotron wavelength of 0.457899 Å using MDI JADE Pro (MDI, 2021).

Comparison of the synchrotron pattern (black) of fulvestrant to the pattern (green) reported by Li et al. (Reference Li, Wang, Li, Xu and Sun2008). The published patterns were digitized using UN-SCAN-IT (Silk Scientific, 2013) and scaled to the synchrotron wavelength of 0.457899 Å using MDI JADE Pro (MDI, 2021).

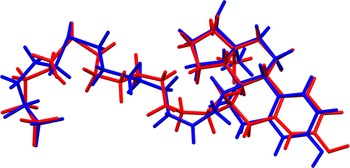
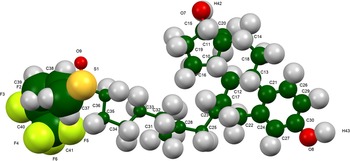
The root-mean-square (rms) Cartesian displacement between the Rietveld-refined and DFT-optimized structures is 0.535 Å (Figure 7), outside of the normal range for correct structures (van de Streek and Neumann, Reference van de Streek and Neumann2014). The largest differences are in the side chain, as might be expected, but the molecules are remarkably similar, providing confidence in the refined structure. The large structure and limited amount of data certainly decrease the accuracy and precision expected from this structure. This discussion concentrates on the DFT-optimized structure. The asymmetric unit (with atom numbering) is illustrated in Figure 8, and the crystal structure is presented in Figure 9.
Comparison of the Rietveld-refined (red) and VASP-optimized (blue) structures of fulvestrant. The rms Cartesian displacement is 0.535 Å.

The asymmetric unit of fulvestrant, with the atom numbering. The atoms are represented by 50% probability spheroids.

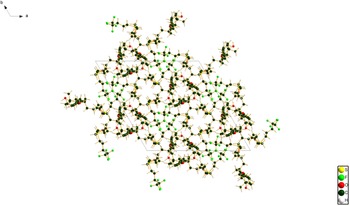
The crystal structure of fulvestrant, viewed down the c-axis.

The displacement coefficients are in general large (Figure 8), especially for the outer end of the side chain. The large U iso probably indicate disorder in the end of the chain. All of the bond distances and angles fall within the normal ranges indicated by a Mercury/Mogul Geometry check (Macrae et al., Reference Macrae, Sovago, Cottrell, Galek, McCabe, Pidcock, Platings, Shields, Stevens, Towler and Wood2020). Most of the torsion angles also fall within normal ranges. Several torsion angles in the side chain are flagged as unusual, but they tend to occur in minor populations (gauche or trans) of more-general trans/gauche distributions. The conformation of the side chain is not as unusual as it seems at first glance. Only the torsion angles involving the C37–S1 bond seem to be truly unusual.
The crystal structure (Figure 9) is composed of triangular hydrogen-bonded chains of molecules around one of the threefold axes. The fluorinated ends of the molecules cluster around another threefold axis. The voids occupy 8.1% of the unit cell volume (Figure 10), and are partially occupied by the water and ethyl acetate molecules.
A view of the unsolvated crystal structure of fulvestrant, viewed down the a-axis. The probe radius used to generate the voids in Mercury was 1.2 Å.

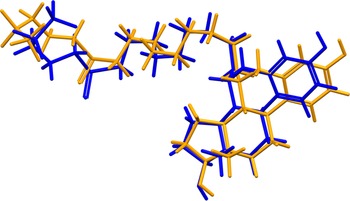
Quantum chemical geometry optimization of the fulvestrant molecule (DFT/B3LYP/6-31G*/water) using Spartan ‘18 (Wavefunction, 2020) indicated that the observed conformation is 10.2 kcal mol−1 higher in energy than the local minimum (Figure 11). The rms Cartesian displacement is 1.331 Å; the differences are spread throughout the molecule, but notably in the orientation of the terminal trifluoromethyl group. The minimum-energy conformation is 13.5 kcal mol−1 lower in energy, and contains an intramolecular O8–H74⋯O9 hydrogen bond. Intermolecular interactions are thus important in determining the solid-state conformation.
Comparison of the observed solid-state conformation of fulvestrant (blue) to the local minimum-energy conformation of an isolated molecule (orange).

Analysis of the contributions to the total crystal energy of the unsolvated structure using the Forcite module of Materials Studio (Dassault, 2021) suggests that bond, angle, and torsion distortion terms contribute significantly to the intramolecular deformation energy. The intermolecular energy is dominated by van der Waals repulsions. The hydrogen bonds are better analyzed using the results of the DFT calculation.
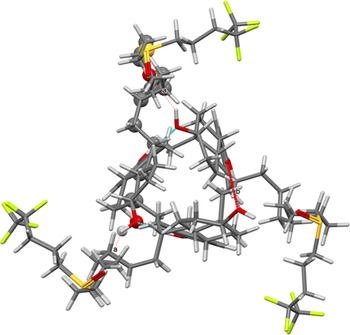
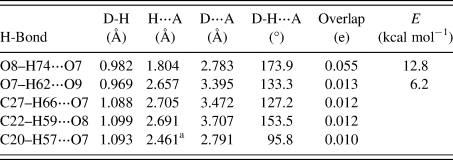
There are only two traditional O–H⋯O hydrogen bonds in the structure (Table I), as well as three C–H⋯O hydrogen bonds. The hydroxyl group O8 acts as a donor to the hydroxyl group O7 in a moderately strong hydrogen bond, while the hydroxyl group O7 acts as a donor in a weak H-bond to the sulfinyl oxygen atom O9. The energies of these H-bonds were calculated using the correlation of Rammohan and Kaduk (Reference Rammohan and Kaduk2018). These H-bonds form a large ring (Figure 12), with the graph set R3,3(48) > a > a < b (Etter, Reference Etter1990; Bernstein et al., Reference Bernstein, Davis, Shimoni and Chang1995; Shields et al., Reference Shields, Raithby, Allen and Motherwell2000). The two hydroxyl groups also act as acceptors in C–H⋯O hydrogen bonds.
The O–H⋯O hydrogen bonds in fulvestrant, indicating the formation of the large hydrogen-bonded ring.

Hydrogen bonds (CRYSTAL14) in fulvestrant hydrate (ethyl acetate)

a Intramolecular.
The Bravais–Friedel–Donnay–Harker (Donnay and Harker, Reference Donnay and Harker1937; Bravais, Reference Bravais1866; Friedel, Reference Friedel1907) morphology suggests that we might expect isotropic morphology for fulvestrant hydrate (ethyl acetate). A second-order spherical harmonic model for preferred orientation was incorporated into the refinement. The texture index was 1.037(2), indicating that the preferred orientation was small for this rotated capillary specimen. The powder pattern of fulvestrant hydrate (ethyl acetate) from this synchrotron data set has been submitted to ICDD for inclusion in the Powder Diffraction File.
IV. DEPOSITED DATA
The Crystallographic Information Framework (CIF) files containing the results of the Rietveld refinement (including the raw data) and the DFT geometry optimization were deposited with the ICDD. The data can be requested at info@icdd.com.
SUPPLEMENTARY MATERIAL
The supplementary material for this article can be found at https://doi.org/10.1017/S0885715622000239.
ACKNOWLEDGEMENTS
The use of the Advanced Photon Source at Argonne National Laboratory was supported by the U.S. Department of Energy, Office of Science, Office of Basic Energy Sciences, under Contract No. DE-AC02-06CH11357. This work was partially supported by the International Centre for Diffraction Data. We thank Lynn Ribaud and Saul Lapidus for their assistance in the data collection, and Andrey Rogachev for the use of computing resources at IIT.
CONFLICTS OF INTEREST
The authors have no conflicts of interest to declare.