Introduction
As one of the important soft magnetic materials, high silicon content and grain-oriented Fe–Si alloy exhibits relatively high permeability, low iron loss, and coercive force [Reference Honma, Ushigami and Suga1, Reference Takada, Abe, Masuda and Inagaki2, Reference Ouyang, Chen, Liang, Macziewski and Cui3]. When the Si content reaches 6.5 wt%, the alloy has the best magnetic properties due to its high electrical resistivity and near-zero magnetostriction [Reference Haiji, Okada, Hiratani, Abe and Ninomiya4, Reference Zhang, Chen, Bei, Ye, Chen and Liu5, Reference Fu, Zhang, Jiang and Xie6, Reference Zhang, Chen, Bei, Li, Ye and Chen7, Reference Cui, Ouyang, Ma, Macziewski, Levitas, Zhou, Kramer and Cui8]. It has wide application prospects in high-frequency fields because of its advantages in reducing noise pollution and consumption of energy, by using power generators, transformers, and electric relays.
However, owing to its intrinsically limited ductility and formability, it is extremely hard to manufacture 6.5 wt% Si steel by conventional casting and rolling process [Reference Ros, Ruiz, Houbaert and Vandenberghe9, Reference Zhang, Liang, Wen, Wang, Shi, Ye and Lin10, Reference Liang, Ge, Fang, Ye and Lin11]. To avoid the rolling problem, several methods have been developed to produce the alloy, such as hot dipping and diffusion [Reference Ros, Houbaert and De12], direct powder rolling [Reference Li, Shen, Zhang and Zhang13], and rapid quenching [Reference Bouchara, Fagot, Degauque and Bras14]. However, these processes have some obstacles in efficiently producing electrical steel with high silicon content, and the magnetic properties of the steel are also poor due to its unsatisfactory texture.
Over recent years, high magnetic field has been widely applied to improve materials’ properties during solidification and other processes of material preparation [Reference Liu, Wang, Kazuhiko, Yuan, Liu and He15, Reference Zheng, F Zhou, Wang, Shuai, Zhong, Ren, Ren, Debray and Beaugnon16, Reference Wang, He, Li, Li, Kou, Zhang and Beaugnon17]. Rango et al. [Reference Rango, Lees, Lejay, Sulpice, Tournier, Ingold, Germi and Pernet18] reported that YBa2Cu3O7-oriented materials were successfully prepared by magnetic field at high temperature. Wang et al. [Reference Gao, Liu, Dong, Yuan and Wang19] observed an aligned structure in Tb0.27 Dy0.73Fe1.95 alloy during solidification in a strong magnetic field. Zheng et al. [Reference Zheng, Zhong, Lei, Ren, Ren, Wang, Wang, Debray, Beaugnon and Fautrelle20] found that the Bi–Zn alloy oriented along a certain direction under a high magnetic field. Fe–Si alloy has apparent magnetocrystalline anisotropy; furthermore, the preferred axis of magnetization is the direction of 〈100〉 [Reference Fu, Zhang, Jiang and Xie6]. Such behavior makes it possible to improve the magnetic property of the Fe–Si alloy by controlling the microstructure and texture during the solidification process under a high magnetic field.
In our previous work [Reference Liu, Zhong, Shen, Dong, Zheng, Ren, Lei and Ren21], the effect of a transverse weak magnetic field on the Fe–1.0 wt% Si alloy during bulk solidification was investigated experimentally, and it was found that the application of a transverse weak magnetic field modified the texture of the Fe–1.0 wt% Si alloy. This work extends the work in Ref. Reference Liu, Zhong, Shen, Dong, Zheng, Ren, Lei and Ren21 and investigates on the effect of a high magnetic field on the morphology and magnetic anisotropy of the Fe–6.5 Si–0.05 B alloy. In the present work, the evolution of grain morphology and magnetic anisotropy in the Fe–6.5 Si–0.05 B alloy are analyzed under different magnetic field intensities. It is demonstrated that the strong magnetic field not only causes the dendrites to align in a certain direction, but also changes the crystal orientation significantly. The alloy treated at 0 T shows near-magnetic isotropic behavior, whereas the alloy treated at 1 and 2 T show magnetic anisotropic behavior. This finding is of significance as it highlights the role of magnetic field on the magnetic anisotropy during bulk solidification. This may open a promising way for producing silicon steel material with magnetic anisotropy.
Results and discussion
Effect of an axial high magnetic field on microstructure evolution
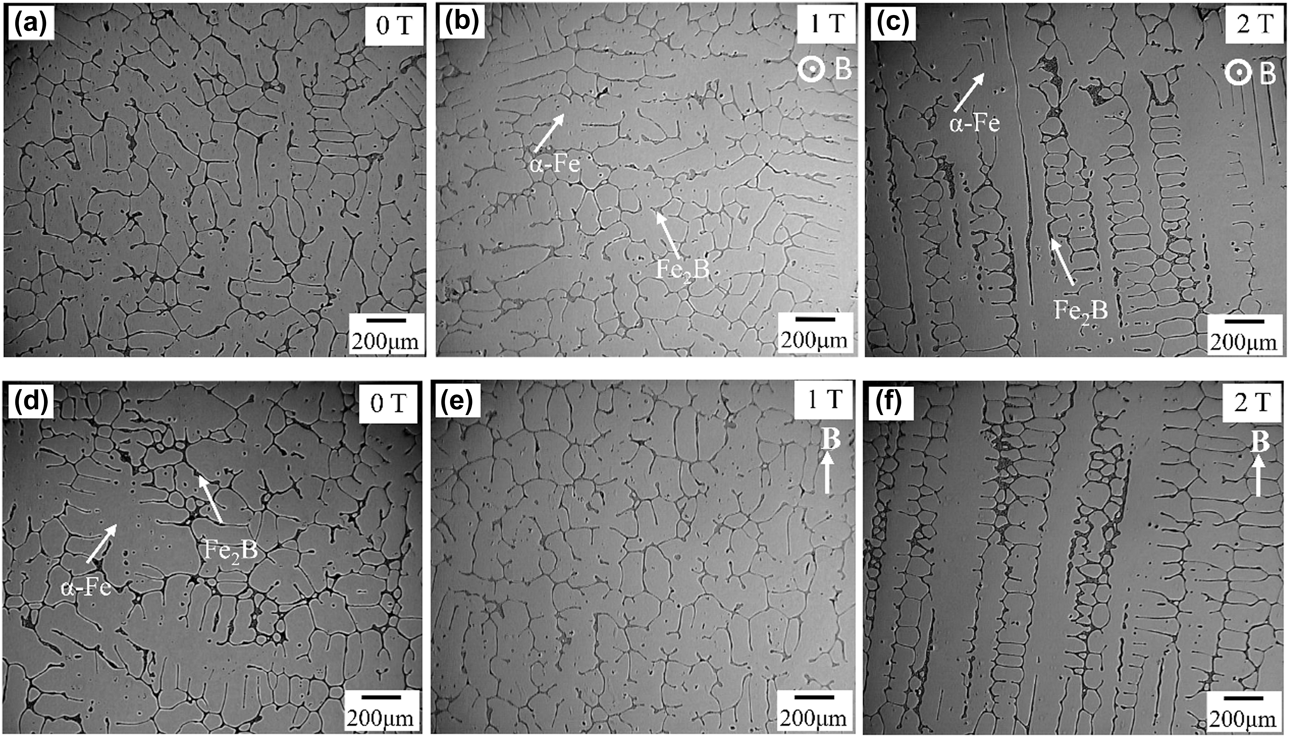
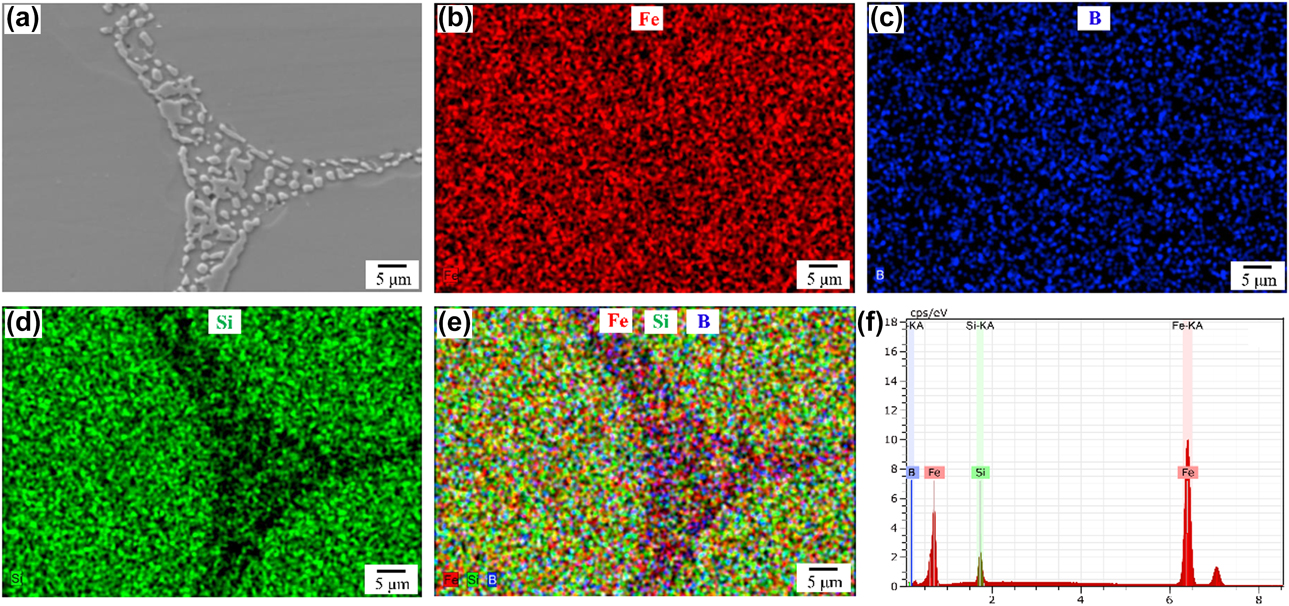
To observe the grain arrangements, the transversal and longitudinal sections of the sample microstructure were examined. Figure 1 shows metallographic micrographs of the specimens under different magnetic field intensities. Figures 1(a) and 1(d) show the transverse and longitudinal microstructures in the case of no magnetic field; there is no distinct grain arrangement. Typical elemental mapping images of the microstructure are displayed in Fig. 2. The energy-dispersive spectrometer (EDS) image in Fig. 2(e) reveals that the precipitates contained an enrichment of boron and dilution of silicon. The peaks of Fe and Si in the EDS spectrum [Fig. 2(f)] were attributed to the contribution of the ferrite matrix as the EDS spot size was larger than the size of the precipitate. Previous studies [Reference Fu, Zhang, Wu and Xie22, Reference Fu, Yang, Zhang and Xie23, Reference Fu, Zhang, Yang and Xie24, Reference Kim, Pan, Lin, Wang, Lin and Chen25] have shown that there are mainly two phases of the α-Fe matrix and interdendrite precipitates in the Fe–6.5 Si–0.05 B alloy. The composition of the alloy phases was quantitatively analyzed by an electro-probe microanalyzer. According to the composition analysis and the X-ray diffraction (XRD) pattern, it is determined that the main precipitates between dendrites are in the Fe2B phase. It can be seen that the α-Fe dendrite in the alloy is developed and disordered. The second-phase distribution at the interdendritic regions in Fig. 1 has been identified as the Fe2B phase that forms in the final stages of solidification. When the magnetic field intensity increases to 1 T, as can be seen from Figs. 1(b) and 1(e), small-sized and obvious dendrites are observed in the sample. When the magnetic field intensity increases to 2 T, as can be seen from Figs. 1(c) and 1(f), a clear alignment of the α-Fe dendrite is observed. When a uniform static magnetic field is applied to an electrically conducting fluid, the crystal is mainly subjected to two forces [Reference Utech and Flemings26, Reference Asai, Sassa and Tahashi27]: One is the Lorentz force, which is induced by the relative movement between the melt and the magnetic field, and the other is the magnetic force caused by magnetocrystalline anisotropy [Reference Wang, Wang, Wang, Li, Nakajima and He28]. These two forces will influence the growth behavior of the α-Fe crystal and, thus, affect its orientation behavior. When the magnetic field intensity increases to 2 T, the fluid motion is reduced because of the interaction between the imposed magnetic field and the electric current. The natural convection and thermal convection were suppressed dramatically [Reference Mathiak and Frohberg29]. The arms of equiaxed grains are almost the same length, and the secondary dendrite arms are well developed. Moreover, the alignment of the dendrite under the magnetic field should be attributed to the rotating alignment caused by the magnetocrystlline anisotropy of the α-Fe crystal, as will be discussed in detail below.
Microstructure of the Fe–6.5 Si–0.05 B alloy under various magnetic field intensities. Transverse: (a) 0 T, (b) 1 T, (c) 2 T; longitudinal: (d) 0 T, (e) 1 T, (f) 2 T.

(a)–(e) Elemental maps scanning and (f) EDS analysis of a typical precipitate.
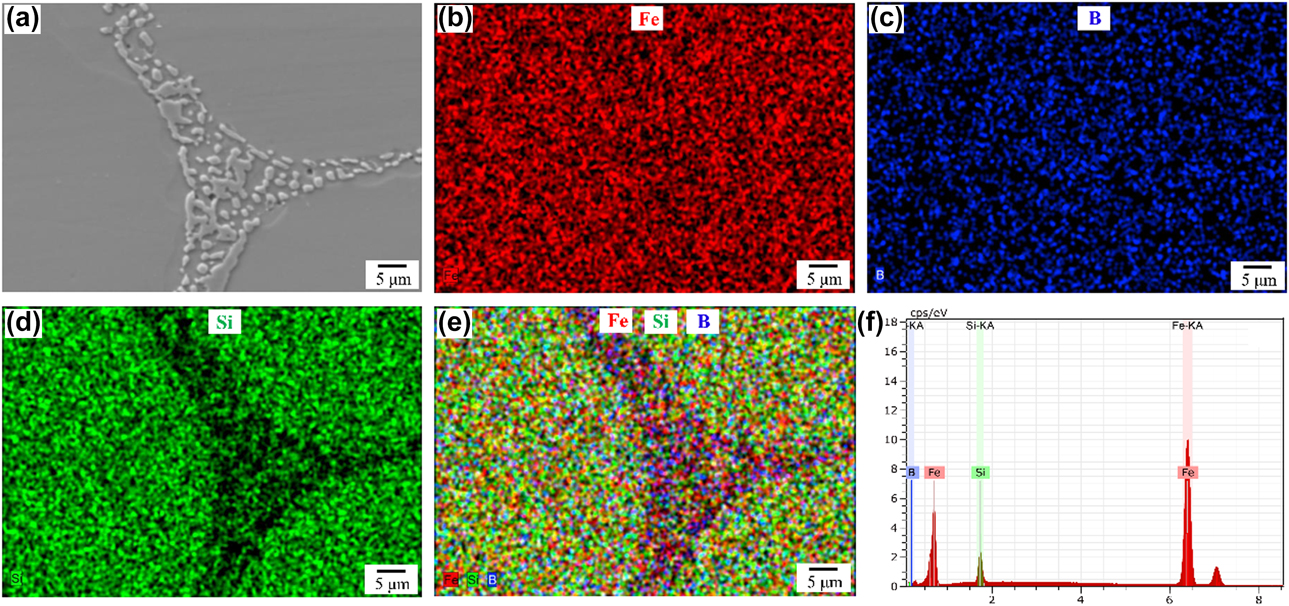
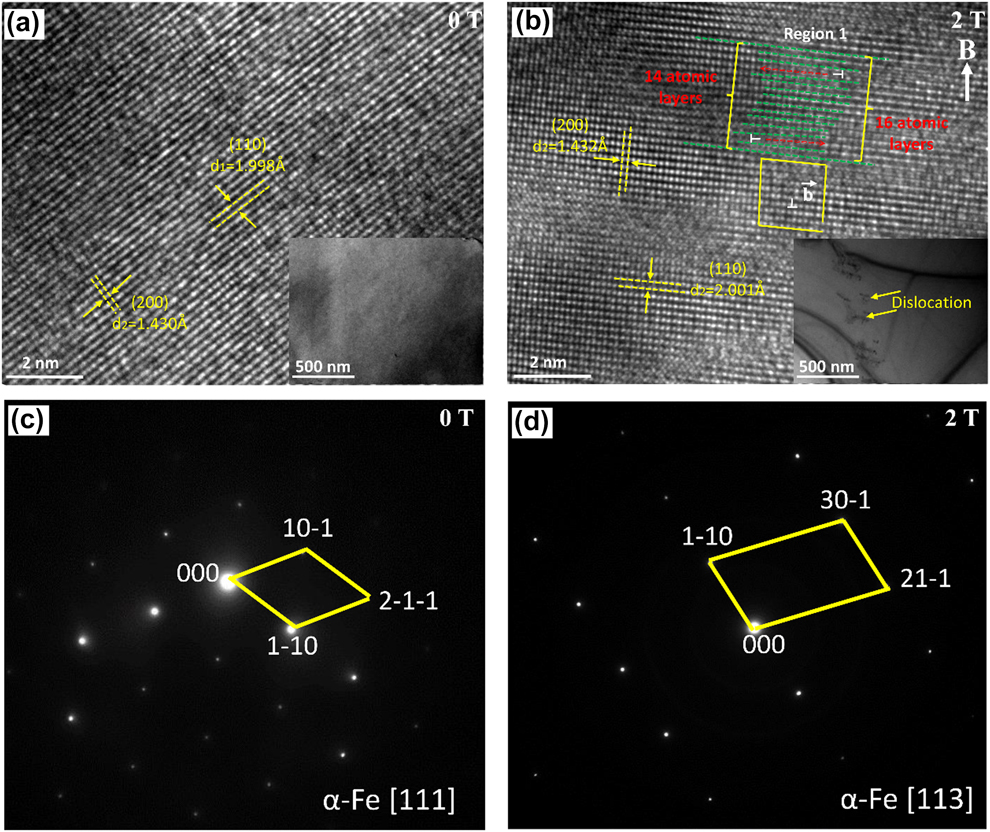
Figure 3 shows the transmission electron microscopy (TEM), high-resolution TEM (HRTEM), and selected area electron diffraction (SAED) images of Fe–6.5 Si–0.05 B alloys under different magnetic field intensities. The arrangement of atoms is regular when the magnetic field is 0 T, while it is irregular when the magnetic field is 2 T, as shown in Figs. 3(a) and 3(b). The typical atomic planes are marked with arrows and the interplanar distance d values are also measured in Fig. 3. The d value of (110) for α-Fe is about 1.998 Å. What is more, the dislocation along the (110) atomic layer is identified in Region 1. The 14 atomic layers are marked with dotted lines from the top left corner of the HRTEM image, but the atomic layer number increases to 16 at the bottom right. The thicknesses of the 14 and 16 atomic layers are, respectively, about 2.72 and 2.74 nm. The selected area electron diffraction pattern (SADP) shows that the samples consist of the α-ferrite single phase with body-centered cubic (bcc) crystal structure with or without a magnetic field. The TEM observations show that there are no clear dislocation tangles in the non–field-treated specimens [Fig. 3(a)]. However, a large number of dislocation tangles or pile-ups and networks in the α-Fe phase were found in the specimen treated with a magnetic field [Fig. 3(b)]. This suggests that the application of a magnetic field produces many dislocations. The Burgers vector is shown as arrowhead b. This phenomenon has been discussed in previous works [Reference Li, Ren, Fautrelle, Zhang and Esling30].
TEM results of Fe–6.5 Si–0.05 B alloys. (a) HRTEM and TEM images, 0 T; (b) HRTEM and TEM images, 2 T; (c) SAED image, 0 T; (d) SAED image, 2 T.

Effect of an axial high magnetic field on crystal orientation and texture evolution
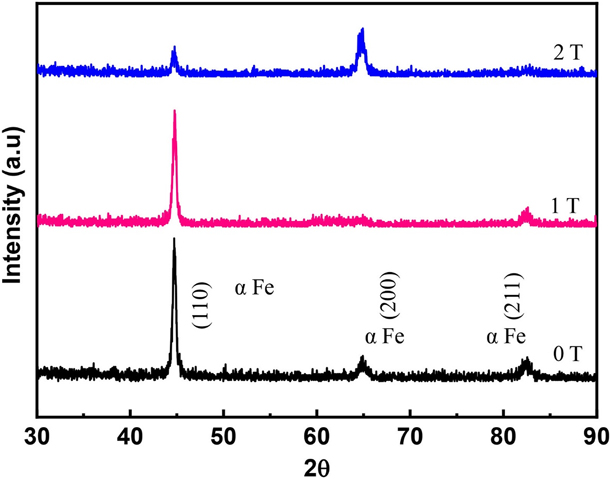
Figure 4 shows the XRD patterns of the alloys solidified in different magnetic field intensities. These patterns were taken from the transverse section, which is perpendicular to the magnetic field direction. This work focuses on the α-Fe phase, so we only indexed diffractions from the α-Fe phase. For the field-free sample, the highest diffraction peak of the α-Fe phase is along the (110), (200), and (211) planes, and the entire sample has no obvious preferred orientation. With a 1 T magnetic field intensity, the diffraction peak of the (110) decreases. It indicates that the magnetic field changes the orientation of the crystal. However, with a 2 T magnetic field intensity, the (200) plane is enhanced, becoming the highest diffraction peak in the sample. The diffraction peak intensity of (110) and (211) is reduced. The 〈200〉 direction is dominant, and the preferred orientation forms along its easy magnetization axis parallel to the magnetic field direction. In conclusion, the texture of the specimens has changed from being random to being 〈100〉-directed as the magnetic flux density increases from 0 to 2 T.
XRD patterns of the transverse plane of the Fe–6.5 Si–0.05 B alloys under various magnetic field intensities.

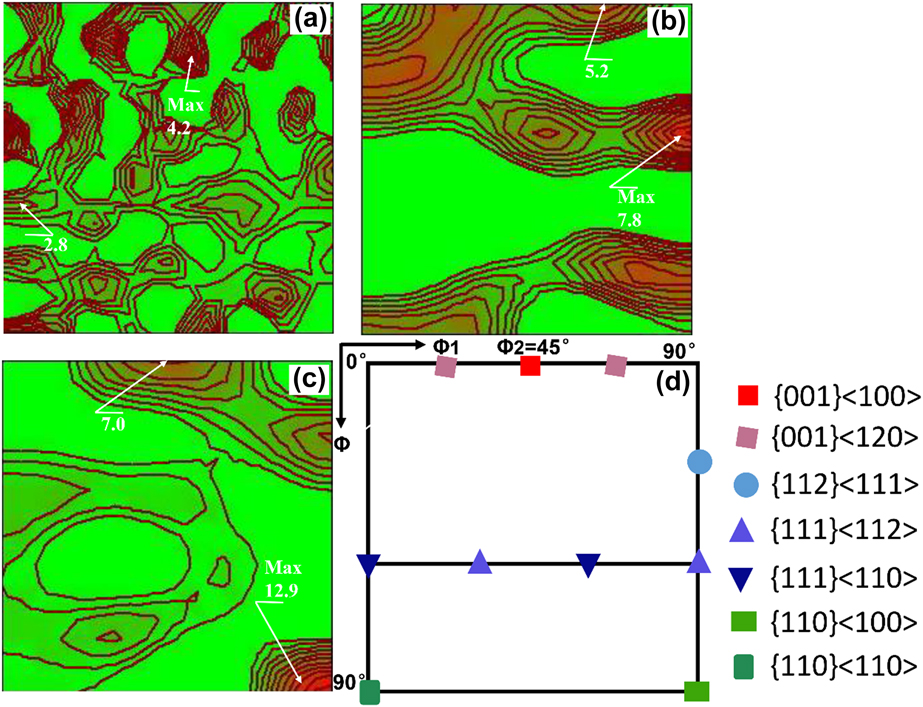
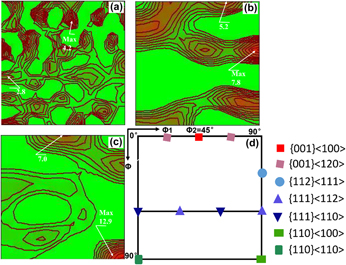
The orientation distribution functions (ODF) at the Φ2 = 45° section of the samples measured by the XRD method are shown in Fig. 5. The sample without a magnetic field was characterized by a typical texture of α-Fe showing random component [Reference Sandoval Robles, Salas Zamarripa, Guerrero Mata and Cabrera31], with the maximal orientation intensity at 4.2. This texture distribution was in good agreement with the microstructural observation [Fig. 1(a)]. When the magnetic field intensity was increased to 1 T, the texture was significantly different from that of the sample without a magnetic field. The maximal orientation intensity of the sample was located close to the {111} 〈112〉 and {100} 〈120〉 components; all the γ fiber components were weakened. However, when the magnetic field intensity was increased to 2 T, a strong λ-fiber texture with maxima at the {001} 〈100〉component and a strong Goss texture at the {110} 〈100〉 component were present in the sample. The intensity of texture in the samples treated with a magnetic field was significantly higher than that of the sample without a magnetic field. The maximum orientation intensity was 12.9, which is 3.05 times random, located at the {110} 〈100〉 component. This is quite different from that observed at 0 T. It can be concluded that magnetic field is an effective means to wipe out the deteriorated texture and tune the texture of silicon steel materials.
The ODF at Φ2 = 45° of the Fe–6.5 Si–0.05 B alloy under various magnetic field intensities: (a) 0 T, (b) 1 T, (c) 2 T (d) ODF section of Euler space showing typical texture fibers and components.

When a crystal with magnetocrystalline anisotropy is placed in a static magnetic field, in order to reduce the energy of the system, when the crystal is free to rotate, it tends to make the axis of easy magnetization parallel to the direction of the magnetic field [Reference Sun, Guo, Vleugels, Van and Blanpain32]. The magnetic torque T of the crystal in a uniform magnetic field can be expressed by the following equation [Reference Mikelson and Karklin33]:
 $$T = {{\Delta \chi } \over {2{\mu _0}}}{B^2}V\;\sin \;2\theta \quad ,$$
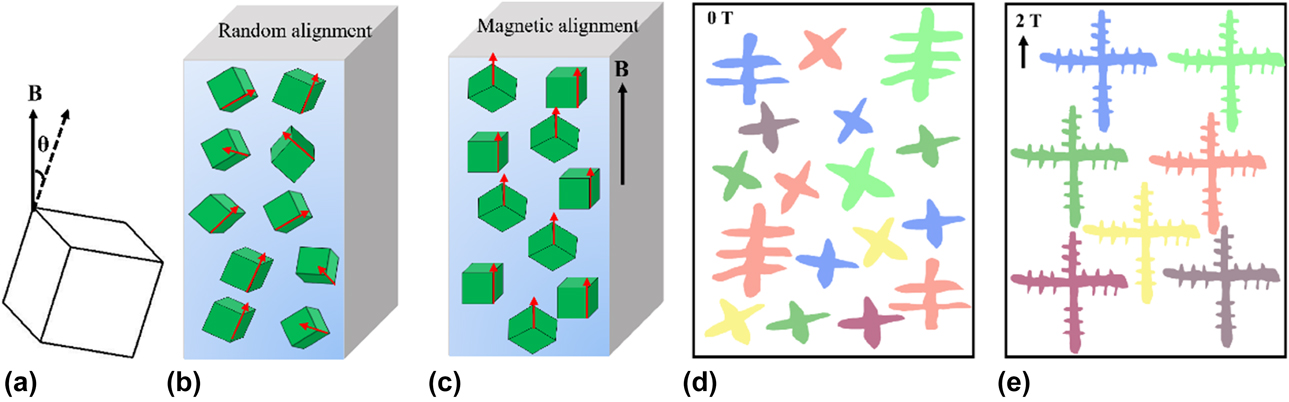
where Δχ is the difference between the two crystal orientations of the crystal, μ0 is the vacuum permeability, B is the magnetic field intensity, V is the crystal volume, and θ is the angle between the magnetic field and the maximum crystal orientation of the magnetic susceptibility. When V is larger than a critical size, the T induced by the magnetic field will overcome the thermal disorder energy. The crystals will rotate in their easy magnetization axis in the magnetic field direction such that the free energy of the system will be at the lowest energy. The ferrite crystal possesses a distinct magnetic anisotropy and 〈100〉 is its easy magnetic axis [Reference Fu, Zhang, Jiang and Xie6]. So the crystal tends to be orientated with 〈100〉 crystal orientation along the magnetic field direction. When the magnetic field intensity is 2 T, a large number of crystal grains are oriented along the easy magnetization axis parallel to the magnetic field direction. Therefore, the specimen at 2 T has a strong Goss and cube component. In order to promote a better understanding of the Goss and cube texture development during bulk solidification, the schematic of alignment of the α-Fe crystal and dendrite growth under different magnetic field intensities is illustrated briefly in Fig. 6. Therefore, it can be expected that better silicon steel products textured along the easy magnetization axis direction can be produced on an industrial scale when the magnetic field intensity is sufficient and a certain temperature strategy is applied.
Schematic of alignment of the α-Fe crystal under magnetic field: (a) The magnetic torque caused by the magnetic anisotropy of the crystal; (b–c) the process of rotation and re-orientation when the magnetic field is applied. (d–e) Schematic of dendrite growth under different magnetic fields.

Soft magnetic property
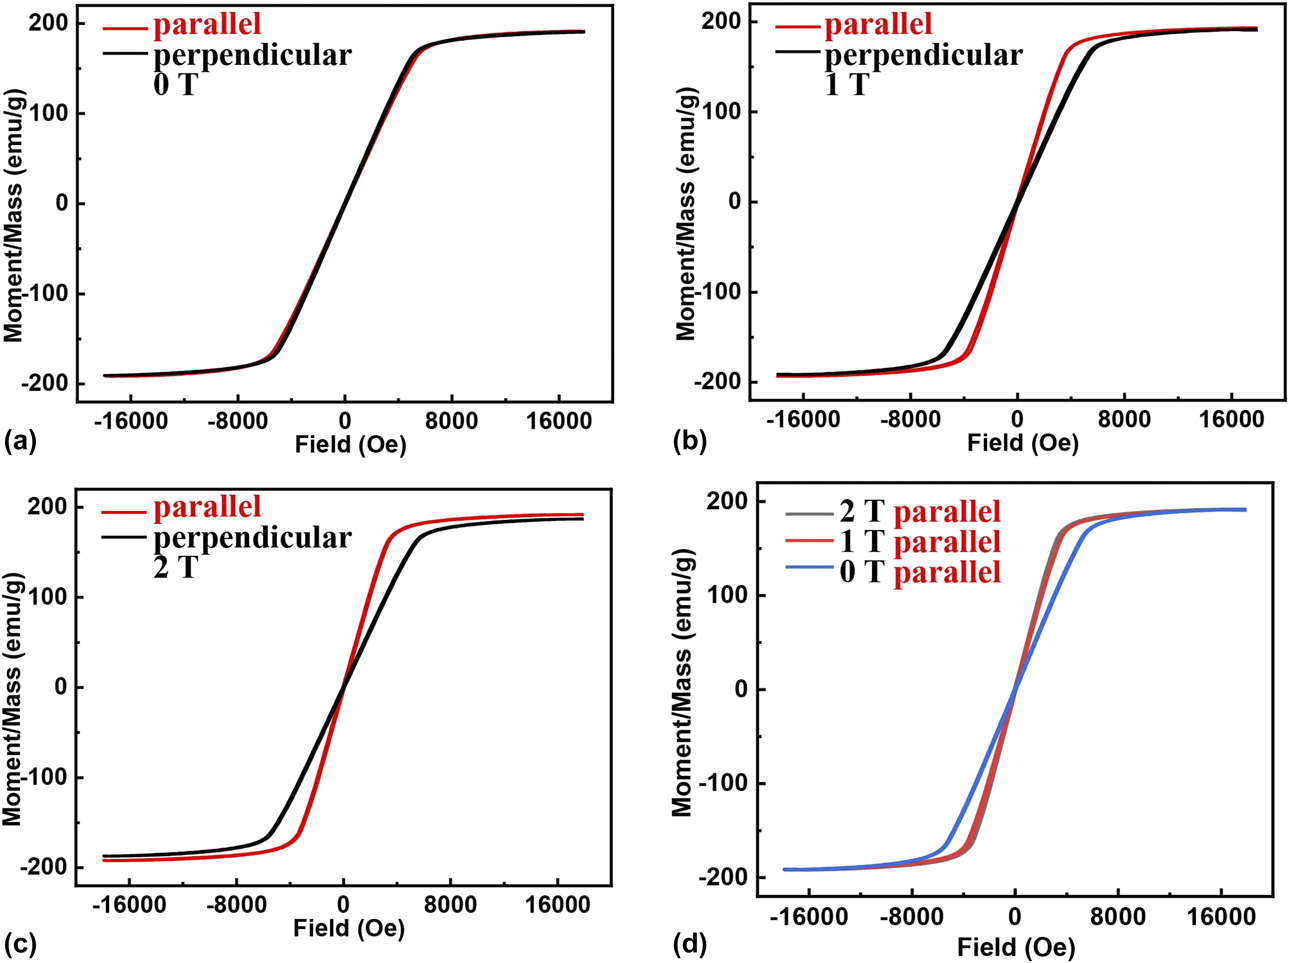
The microstructure and XRD results demonstrate that magnetic fields have a significant influence on both grain alignment and crystal orientation. This will change the physical properties accordingly. Therefore, hysteresis loops of the three samples were measured with VSM at room temperature. The measurement results for the planes, which are parallel and perpendicular to the direction of the applied magnetic field, are shown in Fig. 7. The field-free sample is magnetically isotropic, as indicated in Fig. 7(a) by the strong overlap of the hysteresis loops corresponding to the two different directions. However, the loops in Figs. 7(b)–7(c) show clear indications of magnetic anisotropy. It can be seen that magnetization saturates more easily with the field applied parallel to the magnetic field direction than the one perpendicular to the magnetic field direction. This magnetic anisotropy is distinct, especially in the 2 T–treated sample, and accords well with the XRD results.
Hysteresis loops at room temperature of the Fe–6.5 Si–0.05 B alloy under various magnetic field intensities: (a) 0 T, (b) 1 T, (c) 2 T, (d) parallel plane. “Parallel and perpendicular” indicate directions of the magnetic field imposed for the magnetization measurement with respect to the magnetic field imposed during the solidification.

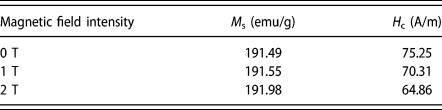
From the magnetism point of view, the magnetic domains in the substance rotate on their easy magnetic axes toward the magnetic field direction by moving their magnetic domain walls during the magnetization process. Since the 〈100〉 direction is the easy magnetization direction in the Fe–Si alloy, the {100} texture component is favorable for the improvement of magnetic property, but the {111} texture component is deleterious [Reference Stojakovic, Doherty, Kalidindi and Landgraf34]. On the basis of the microstructure and XRD measurement results, application of a magnetic field adjusts the orientation of the α-Fe crystal. So the magnetic anisotropy change induced by the high magnetic fields can be linked to the orientation evolution of the α-Fe crystal. As shown in Fig. 5(a), the sample forms a random texture. With the increase in magnetic field intensity, both the {110} 〈100〉 and {100} 〈100〉 components were strengthened, resulting in an increase in initial susceptibility. The VSM measurement in Fig. 7(d) shows that the effect of 1 T and 2 T is nearly the same. This may be due to the optimization of the texture, as the magnetic field strength increases, the dislocation density in the solidified structure increases at the same time. The dislocations will hinder the movement of the magnetic domain wall [Reference Umakoshi and Kronmuller35, Reference Hayashi and Echigoya36], which results in similar magnetic performance measurements. However, further clarification of the exact mechanism of the magnetic property evolution will be done in our future work. Table I lists the H c and M s of specimens under difficult magnetic field intensities. It is found that the H c decreases as the magnetic field strength increases. This is because the crystallographic texture affects the magnetic properties. The coercivity decreased to a minimum of 64.86 A/m because of the strengthening of near 〈100〉 and weakening of near 〈111〉 components in this direction. This result indicated that the soft magnetic property could be changed dramatically by the action of a magnetic field.
Magnetic properties of Fe–6.5 Si–0.05 B alloy.

The above results show that the application of a magnetic field during solidification has a great influence on the magnetic properties of the alloy, and for this alloy, a magnetic field of 2 T strength can optimize its magnetic properties. This may be attributed to the alignment of ferrite grains and to the optimization of texture. In summary, bulk solidification under a high magnetic field can be applied to change the crystallographic texture and to improve the soft magnetic property of silicon steel materials.
Conclusions
Based on the magnetocrystalline anisotropy of Fe–Si alloys, bulk solidification technology under a high magnetic field can be applied to improve the soft magnetic properties of the Fe–6.5 Si–0.05 B alloy by controlling the microstructure and crystal orientation. In this article, Fe–6.5 Si–0.05 B alloy with excellent magnetic property was produced by bulk solidification under a static high magnetic field. Meanwhile, the influence of different magnetic field intensities on the microstructure, crystal orientation, and magnetic property of the Fe–6.5 Si–0.05 B alloy was investigated. Furthermore, a method for producing magnetic anisotropy silicon steel material was proposed. Conclusions were obtained as follows:
(1) The specimen at 0 T has a typical random texture of α-Fe. For the specimen at 1 T, the main components are {111} 〈112〉 and {100} 〈120〉. When the magnetic field intensity increases to 2 T, the strong magnetic field not only causes the dendrites in the solidified structure to align in a certain direction, but also changes the crystal orientation significantly. The associated texture was characterized by a mixture of cubic and Goss texture.
(2) There are no clear dislocation tangles in the non–field-treated specimens; however, a large number of dislocation tangles or pile-ups in the α-Fe phase were found in the specimen treated with a magnetic field.
(3) The alloy treated at 0 T shows near-magnetic isotropic behavior, whereas the alloy treated at 1 and 2 T show magnetic anisotropy. The change in microstructure results in the change in magnetic properties. So the magnetic field is an effective method to optimize the texture and produce magnetic anisotropic silicon steel materials.
Experimental procedure
The Fe–6.5 Si–0.05 B alloy used in this study was prepared by high-purity Fe (99.99 wt%) and Si (99.99 wt%), which was first induction-melted and cast in an argon protection furnace. Pure boron with the content of 0.05 wt% was added to the alloy because boron element can effectively reduce the brittleness of some intermetallics at room temperature [Reference Kim, Pan, Lin, Wang, Lin and Chen25]. A solidified ingot, 12 mm in length and 10 mm in diameter, was cut from the cast specimen and enveloped in a high-purity corundum crucible for the bulk solidification experiment. All samples were heated to 1550 °C and held at 1550 °C for 1 h to completely melt them, and then cooled down to room temperature at the cooling rate of 8 °C/min without and with a vertical high static magnetic field. The furnace was set in the center of the magnet and the temperature in it could reach 1600 °C. The magnetic field–treated specimens were cut longitudinally (parallel to the direction of magnetic fields) or transversely (perpendicular to the direction of magnetic fields).
Specimen surfaces were prepared using a standard metallographic technique and etched with a natal solution. The microstructure of the specimens was examined using an optical microscope (OM) and a scanning electron microscope (SEM). The compositions were characterized by EDS analysis. Textures of the samples were quantitatively investigated by measuring three complete pole figures {200}, {110}, and {211} with Cu radiation in a Bruker D8 Discover XRD system. The illuminated area size of the X-ray and the pole figure is 2 × 2 mm2. Dislocations were determined by high-resolution electron microscopy (TEM; JEM-2100F). The magnetization was measured using a vibrating sample magnetometer (Lakeshore 7407VSM) at room temperature, and the shape of the specimens used for VSM measurement is the same.
Acknowledgments
The authors acknowledge the financial support of the National Key Research and Development Program of China (2016YFB0300401, 2016YFB0301401, and 2018YFF0109404), the National Natural Science Foundation of China (U1860202, U1732276, 50134010, and 51704193), and the Science and Technology Commission of Shanghai Municipality (13JC14025000 and 15520711000).