

Introduction
Risk is pervasive: individuals are often required to make decisions without knowing which possible outcome will occur.Footnote 1 These decisions range from the mundane to the extraordinary. From the decision to pack an umbrella based on a weather forecast to the choice of occupation – countless decisions that individuals make are done without knowing which of the possible outcomes will actually occur. A particular class of decisions in which risk plays an important role is consumer demand for insurance against low-probability, high-consequence (LPHC) events, such as natural disasters.
Numerous studies in both the cognitive psychology and behavioral science literature examine how individuals interact with risk information in LPHC settings. In general, the literature finds that when making decisions associated with risk, individuals tend to either neglect or overweigh low-probability risks (Slovic et al., Reference Slovic, Fischhoff, Lichtenstein, Corrigan and Combs1977; Lichtenstein et al., Reference Lichtenstein, Slovic, Fischhoff, Layman and Combs1978). Moreover, individuals’ tendency to do so can be correlated with various factors such as their emotional state, the framing of the risk and outcomes and past experiences (Johnson et al., Reference Johnson, Hershey and Meszaros1993; Thaler et al., Reference Thaler, Tversky, Kahneman and Schwartz1997; Kunreuther et al., Reference Kunreuther, Novemsky and Kahneman2001; Tom et al., Reference Tom, Fox, Trepel and Poldrack2007; Browne et al., Reference Browne, Knoller and Richter2015).
A particular policy setting in which this behavior is observed is the market for flood insurance: experiments have confirmed that many individuals neglect low-probability flood risks and do not purchase insurance, while others reveal a willingness to pay (WTP) for flood insurance that exceeds the loss's expected value. This observed behavior violates common rational agent-based theories of decision-making under risk that assume individuals make decisions – such as the amount they are willing to pay for insurance – by maximizing their expected utility or payoff. Empirical evidence validates this behavior in the larger population (Botzen & van den Bergh, Reference Botzen and van den Bergh2012; Botzen et al., Reference Botzen, de Boer and Terpstra2013). Kunreuther (Reference Kunreuther2018) describes cognitive biases that may explain the neglect of low-probability flood risk in the context of the US flood insurance market: myopia, amnesia, optimism, inertia, simplification and herding. The literature suggests that the use of the availability and affect heuristics – mental shortcuts that rely on immediate examples or emotional salience, respectively, to evaluate in this case the likelihood of flooding – may also lead certain individuals to inflate their perceptions of the risk of these events (Keller et al., Reference Keller, Siegrist and Gutscher2006).
In light of these findings relating to consumer behavior, this paper seeks to examine the relative effect of different behaviorally informed interventions on the demand for insurance against LPHC events. Interest in behavioral policy interventions has increased in recent years (Oliver, Reference Oliver2013; Shafir, Reference Shafir2013; Chetty, Reference Chetty2015). These policies assume many different forms; however, a helpful taxonomy within the set of non-incentivizing, choice-preserving behavioral policies distinguishes between ‘nudges’ and ‘boosts’ (Grune-Yanoff et al., Reference Grune-Yanoff, Marchionni and Feufel2018). Generally, nudges are defined as changes to a decision frame – the manner in which a decision is presented – that alter individuals’ behavior in predictable ways without excluding options or altering the incentive structure (Thaler & Sunstein, Reference Thaler and Sunstein2008). Boosts are interventions characterized by their goal of expanding the decision-maker's set of competences in order to enable them to accomplish their objectives (Grune-Yanoff & Hertwig, Reference Grune-Yanoff and Hertwig2016).
Focusing in particular on the context of demand for flood insurance, this paper seeks to compare the effects of nudges and boosts designed to increase consumer demand for insurance against LPHC events. To do so, this paper elicits WTP for flood insurance in a hypothetical scenario involving coastal flood risk using a web-based survey in which 331 participants recruited from an online labor pool are randomly assigned to receive either a nudge, a boost or neither. Given the large literature suggesting that affect and availability heuristics impact agent decision-making in these settings, two nudges are included in the study: one purely informational (henceforth, ‘informational nudge’), the other adding affective and availability cues to the informational nudge (henceforth, ‘affective nudge’). Whereas in the control condition the risk of flooding is presented as an annual probability, the informational nudge alters the presentation of the flood risk by translating this annual probability into the probability of experiencing a flood over a 30-year period. The affective nudge adds information about coastal flooding in the USA to the informational nudge's decision frame, to include information on current and future exposure of at-risk populations and assets and a reference to a particularly damaging US hurricane season. Lastly, based on a large literature on statistical training, the boost condition is designed to provide individuals with an intuitive heuristic applying the Law of Large Numbers, a theorem that states that under general conditions the sample average will be close to the population average with very high probability when the sample size is large, as is the case when considering the probability of flooding over a large sample of homes.
Ultimately, the study finds that nudges are the more effective behaviorally informed policy tool in this setting. In particular, by using a two-limit Tobit model to estimate WTP for flood insurance, this paper finds that the affective and informational nudges result in increases in WTP for flood insurance of roughly $21/month and $11/month relative to the boost, respectively. Moreover, this paper finds that the efficacy of a nudge relative to the baseline condition of no behavioral intervention is contingent on targeting the affect and availability heuristics. These findings suggest that policy-makers may prefer nudges over boosts in the context of flood insurance or insurance against other LPHC events. Ultimately, this study provides two key takeaways for policy-makers interested in increasing take-up of insurance against LPHC events: behavioral policies can play a large role in accomplishing this objective, and particular attention should be given to the framing of the risk in question. The next section discusses the differences between nudges and boosts and introduces the relevant literature.
Background
Nudges and boosts are associated with two distinct programs in the behavioral sciences: the former is viewed as a product of the Heuristics and Biases program (Tversky & Kahneman, Reference Tversky and Kahneman1986; Kahneman & Tversky, Reference Kahneman and Tversky1996) and the latter the Fast and Frugal Heuristics program (Gigerenzer & Todd, Reference Gigerenzer and Todd1999). While these two forms of behavioral policy are the results of different strains of research, they are similar in that they both seek to alter agents’ behavior without substantially changing incentives or restricting agents’ autonomy through legal mandates. Moreover, nudges and boosts both assume that individuals use a finite set of heuristics (i.e., mental processes or ‘shortcuts’) to make decisions and that the result of the use of these heuristics depends on the properties of the decision frame (Gigerenzer & Todd, Reference Gigerenzer and Todd1999; Thaler & Sunstein, Reference Thaler and Sunstein2008; Grune-Yanoff & Hertwig, Reference Grune-Yanoff and Hertwig2016; Grune-Yanoff et al., Reference Grune-Yanoff, Marchionni and Feufel2018).
Much of the literature discussing the differences between nudges and boosts focuses on the ethical implications of each policy type (Grune-Yanoff et al., Reference Grune-Yanoff, Marchionni and Feufel2018). Some contend that any effort to draw a normative distinction between these two forms of policy is ill-founded (Sims & Muller, Reference Sims and Muller2018). This paper brackets the ethical implications of nudging and boosting and focuses instead on evaluating the different effects of these two policy types in a specific setting.
While there are those who argue that the distinction between nudges and educative boosts is perhaps tenuous, particularly in the case of informational nudges (Sunstein, Reference Sunstein2015), this paper adopts the view that this distinction is well-founded on mechanical grounds. In particular, nudges and boosts differ in both: (1) the point in the cognitive decision-making process that they target; and (2) the mechanism that they employ to accomplish their desired outcome. Assuming that agents’ sets of heuristics are stable, nudges target the decision frame as a means of using cognitive biases to accomplish an outcome. In comparison, while boosts assume that agents make use of cognitive heuristics, they do not assume that the set of heuristics is fixed. Boosts therefore target agents’ supply of cognitive heuristics directly, seeking to either improve existing heuristics or provide decision-makers with heuristics to apply to the decision in question (Grune-Yanoff et al., Reference Grune-Yanoff, Marchionni and Feufel2018).
While this is possibly an imperfect classification, the purpose of this paper is not to further clarify the distinction between nudges and boosts. Given that the literature has largely adopted a distinction between nudges and boosts, this paper seeks to provide evidence of the relative effect of each form of policy in a specific setting. Though there are numerous areas in which nudges and boosts can be and are currently employed, the analysis herein focuses on the effect of a nudge and a boost in the context of decision-making with respect to LPHC events, given that there exists a robust behavioral science literature on this topic.
LPHC events: behavioral biases and nudges
The behavioral science literature has established numerous facts regarding agents’ decision-making under risk.Footnote 2 Several studies have found that individuals tend to overestimate small probabilities and underestimate large probabilities (Lichtenstein et al., Reference Lichtenstein, Slovic, Fischhoff, Layman and Combs1978; Hertwig et al., Reference Hertwig, Barron, Weber and Erev2004). Moreover, individuals’ perceptions of the likelihood of an event appear to be driven in part by the exposure, memorability or imaginability of the event for that individual (Slovic, Reference Slovic2000; Hertwig et al., Reference Hertwig, Barron, Weber and Erev2004), which suggests that individuals make use of the availability and affect heuristics when making decisions regarding low-probability outcomes (Tversky & Kahneman, Reference Tversky and Kahneman1973; Finucane et al., Reference Finucane, Alhakami, Slovic and Johnson2000). Overall, when asked to make decisions under conditions of risk, the evidence suggests that individuals depart from conventional models of expectational reasoning (Johnson et al., Reference Johnson, Hershey and Meszaros1993; Kunreuther et al., Reference Kunreuther, Meyer, Zeckhauser, Slovic, Schwartz, Schade, Luce, Lippman, Krantz, Kahn and Hogarth2002).
The field of regulatory focus theory builds on findings in the cognitive psychology literature, emphasizing the role that motives play in individual decision-making. In particular, regulatory focus theory contends that two motivational systems shape decision-making: the promotion and prevention systems (Higgins, Reference Higgins1998). In general, promotion motivations are those that seek to improve on the status quo, whereas prevention motivations are those that seek to maintain the status quo by avoiding loss. Krantz and Kunreuther (Reference Krantz and Kunreuther1998) emphasize the role of motivational reasoning in decision-making under risk, particularly in the context of LPHC events such as the decision to purchase flood insurance. Botzen et al. (Reference Botzen, de Boer and Terpstra2013) demonstrate that both situational motivation (motivation directly related to a specific context) and global motivation (motivation that applies to all contexts) play important roles in driving individual decision-making in the context of flood insurance.
It appears as though when making decisions regarding low-probability events, agents have a threshold probability value below which they neglect a given outcome (Slovic et al., Reference Slovic, Fischhoff, Lichtenstein, Corrigan and Combs1977; McClelland et al., Reference McClelland, Schulze and Coursey1993; Schade et al., Reference Schade, Kunreuther and Koellinger2012). Examining motorists’ seatbelt use behavior, Slovic et al. (Reference Slovic, Fischhoff and Lichtenstein1978) find that reporting the probability of serious injury over the course of a lifetime of automobile trips rather than over a single trip leads more people to wear seatbelts. Browne et al. (Reference Browne, Knoller and Richter2015) find evidence to suggest that individuals neglect low-probability outcomes and overweigh high-probability outcomes in the market for insurance. A possible reason for this behavior is that individuals are unable to internalize probabilities below a certain threshold, as they do not believe that such unlikely events could ever happen to them, a phenomenon known as probability neglect (Tversky & Shafir, Reference Tversky and Shafir1992; Sunstein, Reference Sunstein2002). In short, nudges have been shown to affect individual decision-making with respect to LPHC events.
Boosting statistical reasoning
Numerous studies examine the effects of training, or boosting, on biased decision-making. In particular, there exists a robust literature that seeks to use the cognitive model of heuristics to address well-defined biases by either providing agents with new heuristics or enhancing the application of existing heuristics. Several studies find that brief training in formal, inferential rules may enhance agents’ use of statistical reasoning – their understanding of and ability to apply statistical concepts – in everyday life (Nisbett et al., Reference Nisbett, Fong, Lehman and Cheng1987). Evidence suggests that providing individuals with an intuitive heuristic applying the Law of Large Numbers improves their statistical reasoning (Fong et al., Reference Fong, Krantz and and Nisbett1986; Fong & Nisbett, Reference Fong and Nisbett1991).
Other efforts to measure the effects of training on statistical reasoning have sought to examine the impact of interventions on agents’ Bayesian reasoning, which refers to individuals’ ability to use new information to update their prior beliefs about the likelihood of an event. A key result of this literature is that providing individuals with probabilities in frequency format as opposed to probability format improves their ability to conduct Bayesian reasoning (Gigerenzer & Hoffrage, Reference Gigerenzer and Hoffrage1995; Gigerenzer, Reference Gigerenzer1996, Reference Gigerenzer2014). The reason for this improvement is argued to lie in the mechanics of solving these types of problems: it is argued that Bayesian computations are simpler to perform with natural frequencies than with probabilities (Sedlmeier & Gigerenzer, Reference Sedlmeier and Gigerenzer2001).
These findings have led some to contend that training or boosting decision-making can produce persistent reductions in cognitive biases (Gigerenzer & Brighton, Reference Gigerenzer and Brighton2009; Morewedge et al., Reference Morewedge, Yoon, Scopelliti, Symborski, Korris and Kassam2015). In the context of agents’ behavior with respect to LPHC events, this literature suggests that boosting individuals’ expectational reasoning enhances the biased decision-making discussed in the previous subsection (Kunreuther et al., Reference Kunreuther, Meyer, Zeckhauser, Slovic, Schwartz, Schade, Luce, Lippman, Krantz, Kahn and Hogarth2002; Slovic et al., Reference Slovic, Finucane, Peters and MacGregor2002). This paper is not aware of previous studies examining the effects of boosts on decisions to insure against LPHC events, not to mention comparing their effects relative to nudges in this setting.
Flood insurance demand
The market for insurance against flooding represents a particularly important and policy-relevant area in which individuals’ departures from rational agent-based models of behavior in the context of LPHC events are observed. In the USA, the take-up rate (i.e., the proportion of households purchasing insurance) for flood insurance in high-risk areas remains around 49%, despite mandates requiring the purchase of coverage (Kousky, Reference Kousky2018; Kunreuther, Reference Kunreuther2018). Moreover, several revealed preference studies of insurance demand in the USA indicate that many homeowners do not internalize flood risk and fail to purchase flood insurance, even when it is partly subsidized (Kunreuther & Slovic, Reference Kunreuther and Slovic1978; Atreya et al., Reference Atreya, Ferreira and Michel-Kerjan2015).
While it is possible that the low take-up rates for flood insurance observed in practice represent unbiased preferences in the population, this is unlikely. Several studies have found that WTP for flood insurance is conditional on a number of factors that are suggestive of biased behavior in these markets. Examining the market for flood insurance in the state of Georgia, Atreya et al. (Reference Atreya, Ferreira and Michel-Kerjan2015) find that experience with recent flood events temporarily increases purchases of policies. Surveys of coastal residents in the Netherlands suggest that the framing of risk as well past experience with flooding alter WTP for insurance (Botzen & van den Bergh, Reference Botzen and van den Bergh2012; Botzen et al., Reference Botzen, de Boer and Terpstra2013; de Boer et al., Reference de Boer, Botzen and Terpstra2015).
Hypotheses and survey methodology
Despite the presence of financial incentives as well as an albeit poorly enforced mandate requiring the purchase of flood insurance, relatively few at-risk households in the USA do so. While there are a number of non-behaviorally informed policy remedies that are likely necessary to address this issue (e.g., see Kunreuther, Reference Kunreuther2018), the poor performance of incentives and mandates to increase the purchase of flood insurance coupled with the many applicable insights available from the behavioral sciences literature begs the consideration of possible behavioral policies in this area. With this in mind, this paper seeks to provide early evidence of the relative performance of two such types of policy: nudges and boosts.
Hypotheses
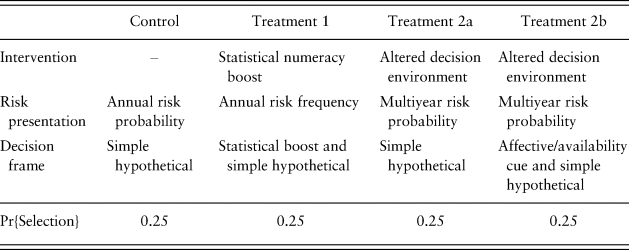
To compare the relative effects of nudges and boosts in this setting, a survey is constructed in which respondents are randomly assigned to one of a Control condition, a boost (Treatment 1), an informational nudge (Treatment 2a) or an affective nudge (Treatment 2b) and then asked to consider their WTP for insuring a hypothetical endowment against a given annual probability of flooding. The differences between the two forms of a nudge (Treatments 2a and 2b) as well as the boost (Treatment 1) and Control conditions are outlined in the subsections that follow and in Table 1.
Summary of different treatment and control conditions.

Each condition is characterized by: (1) its intervention type; (2) the format in which the inundation risk is presented; and (3) the structure of its decision frame. ‘Simple hypothetical’ refers to the hypothetical scenario used to elicit willingness to pay.
Below is the set of hypotheses (H) based on the relevant literature that the survey instrument seeks to test:
• H1: There will be a large number of respondents who will not purchase insurance independent of treatment status (i.e., in all treatment and control groups).
• H2: Providing respondents with a brief statistical reasoning boost intended to give them an intuitive heuristic applying the Law of Large Numbers will have a relatively minor effect on their WTP for insurance.
• H3: Obtaining a non-zero treatment effect of a behaviorally informed nudge on WTP for flood insurance is conditional on targeting the availability/affect heuristics.
The above hypotheses are informed by previous findings in the literature. In particular, H1 is informed by the finding that, all else being equal, individuals often fail to purchase insurance against LPHC events in both experimental and empirical settings. H2 is based on the numerous findings in the literature that suggest that certain well-documented biases affect individuals’ decisions to forgo insurance in LPHC settings. This paper contends that the cognitive biases that affect individuals’ probabilistic reasoning in this setting are sufficiently strong to ensure that any attempt to increase take-up and WTP without making explicit use of these biases will be unsuccessful. Lastly, H3 is informed by the finding that affect and availability play a significant role in determining individuals’ insurance decisions with respect to LPHC events. The subsections that follow describe the survey instrument used to test the above hypotheses.
Eliciting WTP for flood insurance
Following assignment of treatment status, respondents are presented with a hypothetical scenario in which they are informed that they own a single-family, detached home located in the coastal USA with a total value of $300,000.Footnote 3 Respondents are told that their home faces a 1% probability in any given year of experiencing flooding resulting in approximately $75,000 worth of damages.Footnote 4 Thus, the expected damages to the endowed home in the hypothetical scenario are 0.01 × $75,000 = $750/year or $62.50/month.
After being asked to imagine this hypothetical scenario, respondents are informed that there exists an annual insurance policy that will cover the cost of damages associated with the flooding risk described. Respondents are then asked to consider this policy and indicate their prior belief regarding the cost of the policy on a sliding scale ranging from $0 to $125/month. This question is included to prime the respondents to consider the actual cost of such a policy before eliciting their WTP for coverage. Interest in purchasing an annual flood insurance policy for the home described in the hypothetical scenario is then elicited. If the respondents answer ‘Yes’ or ‘Maybe’, then they are asked to indicate the ‘highest amount’ that they are willing to pay to purchase the annual insurance policy described in the hypothetical scenario on a sliding scale ranging from $0 to $125/month. If the respondents answer ‘No’, they are assigned a WTP value of $0/month. The use of this elicitation format introduces methodological challenges, which are discussed and addressed below.
The different treatment and control conditions vary in their presentation of the hypothetical scenario (see Supplementary Appendix A, available online). In particular, the descriptions of the hypothetical scenarios across treatment and control conditions vary in their presentation of the risk of flooding (holding the description of the loss associated with flooding constant). In the Control condition, respondents are presented with the flooding risk in probabilistic terms (i.e., “There is a 1% chance, in any given year, that you will experience flooding…”). This risk presentation is chosen as the baseline as this aligns closely with the format in which risk is presented to homeowners in practice (see Footnote 4).
Nudge and boost design
Prior to being presented with the hypothetical scenario, respondents assigned to Treatment 1 are provided with a brief description of how to interpret probabilities in frequency terms (see Supplementary Appendix A). This includes a description of a simple example as well as an easy-to-use inferential rule to interpret probabilities in frequency terms. This boost is designed based on the relevant literature on statistical training: the objective of the boost is to provide individuals with an intuitive heuristic applying the Law of Large Numbers (Fong et al., Reference Fong, Krantz and and Nisbett1986; Nisbett et al., Reference Nisbett, Fong, Lehman and Cheng1987; Fong & Nisbett, Reference Fong and Nisbett1991). Respondents in this treatment group are then shown the hypothetical scenario in which flooding risk is presented in both probabilistic and relative frequency terms (i.e., “There is a 1% (or 1 in 100) chance, in any given year, that you will experience flooding…”). This risk presentation is intended to improve respondents’ Bayesian reasoning (Gigerenzer & Hoffrage, Reference Gigerenzer and Hoffrage1995; Gigerenzer, Reference Gigerenzer1996; Sedlmeier & Gigerenzer, Reference Sedlmeier and Gigerenzer2001).
Similar to the Control condition, respondents assigned to Treatment 2a are shown the hypothetical scenario prior to eliciting their WTP for insurance and are presented the flooding risk in probability terms. However, in addition to presenting the risk of flooding on an annual basis, respondents in Treatment 2a observe the probability of inundation over a 30-year period (i.e., “…over the course of 30 years of home ownership, the probability of experiencing a severe flood of this type is approximately 26%”), which corresponds to the modal amortization period for fixed-rate mortgages in the USA.Footnote 5
Prior to being presented with the hypothetical scenario, respondents in Treatment 2b are provided with information on coastal flooding in the USA, to include: a description of at-risk populations and assets, a summary of coastal flooding projections resulting from climate change and a description of damages resulting from salient tropical cyclones that made landfall in the USA during the 2017 hurricane season. Respondents in this group are then shown a set of images of flooding in coastal areas (see Supplementary Appendix A). This intervention is intended to elicit an affective response and to prime respondents to consider salient, recent examples of coastal flooding. Respondents in this treatment group are then presented with the same hypothetical scenario and risk presentation as in Treatment 2a.
Motivation and prior beliefs
Based on the regulatory focus theory literature (Higgins, Reference Higgins1998), respondents are asked to consider a set of questions designed to measure the situational and global motivations behind their stated WTP value similar to Botzen et al. (Reference Botzen, de Boer and Terpstra2013) and de Boer et al. (Reference de Boer, Botzen and Terpstra2014). Two questions are specifically designed to measure the degree to which respondents’ maximum WTP for flood insurance is motivated by the risk described in the frame (‘situational’ motivation) and another two questions are designed to measure respondents’ general motivations to insure against risk (‘global’ motivation). These questions are designed to target both the prevention and promotion systems in both the situational and global cases. For a full description of the motivation elicitation questions, see Supplementary Appendix B.
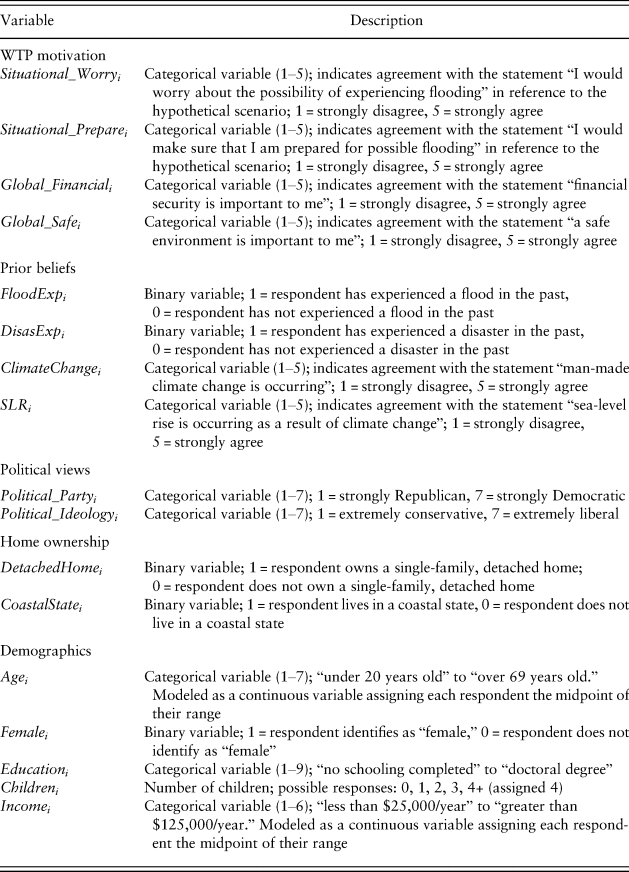
Respondents’ prior beliefs regarding climate change and sea-level rise are also elicited in order to control for strong or weak priors on future flooding in coastal areas. Given the possible role of previous exposure to flooding or similar natural disasters on insurance demand, respondents’ prior experience with these events is also elicited. Additional demographic variables are elicited, including age, education, income, home state and home ownership status. A complete description of variables elicited via the survey instrument is given in Table 2.
Description of primary explanatory variables elicited via survey instrument.

WTP = willingness to pay.
Empirical methods
A single model is estimated for WTP elicited via the survey instrument. Due to the method employed to elicit respondents’ WTP, a two-limit Tobit model is used to estimate the marginal effects of treatment on individuals’ WTP for flood insurance.
Linear WTP model
It is assumed that, for each respondent i ∈ {1, …, N}, WTP is a linear function of the form:
 $$ {{WT}{P}_{i} = {\,f}( {{X}_{i},{D}_{i},{P}_{i}} ) + { \unicode{x03B5}} _{i}} $$
where f( · ) is a linear function, X i is a 1 × j vector of j individual attributes, D i is the value of property exposed to flood damage, P i is the probability of inundation and  $\unicode{x03B5} _i\sim {\rm {\cal N}}( {0,\sigma_\unicode{x03B5}^2} ) $ is a normally distributed error term with mean zero and variance
 $\sigma _\unicode{x03B5} ^2 $. In particular, WTP is parameterized as the following:
 $$ {{WT}{P}_{i} = {\beta} _0 + {X}_{i}{\beta} _1 + {D}_{i}{\beta} _2 + {P}_{i}{\beta} _3 + {\unicode{x03B5}} _{i}} $$
The literature finds that individuals may follow a belief-updating pathway suggestive of Bayesian reasoning when they are provided with novel information regarding the likelihood of adverse outcomes (Viscusi, Reference Viscusi1985; Botzen & van den Bergh, Reference Botzen and van den Bergh2012). Assuming that respondents possess a prior belief regarding the likelihood of flooding in the hypothetical scenario, then WTP should be a function not of the flood probability stated in the survey, P i, but rather of the posterior belief regarding flooding in the hypothetical scenario. This posterior belief is modeled as a function of respondents’ prior beliefs, π i, and the probability information presented in the hypothetical scenario:
 $${{{\tilde{P}}}_{i} = \displaystyle{{{\eta} _1{\pi} _{i} + {\eta} _2{P}_{i}} \over {{\eta} _1 + {\eta} _2}}} $$
where η 1 and η 2 are the weights assigned to the prior belief about the probability of flooding in the hypothetical scenario, π i, and the probability of the hypothetical endowment experiencing flooding that is given in the survey, P i (Viscusi & O'Connor, Reference Viscusi and O'Connor1984; Viscusi, Reference Viscusi1985).
Given that numerous studies show that individuals often do not follow a Bayesian model of belief updating, largely due to the existence of certain behavioral biases (Kahneman et al., Reference Kahneman, Slovic and Tversky1982; Cameron, Reference Cameron2005), Bayesian updating is not imposed on agents in this model. Similarly to Botzen and van den Bergh (Reference Botzen and van den Bergh2012), the framework of Bayesian updating is introduced herein to incorporate the possibility of a meaningful relationship between WTP for flood insurance and individual flood risk perceptions. In fact, much of the behavioral sciences literature suggests that including factors that influence individual priors on flood risk (e.g., past experience of a flood) is important. Incorporating equation (3) into equation (2) gives:
 $$ {{WT}{P}_{i} = {\beta} _0 + {X}_{i}{\beta} _1 + {D}_{i}{\beta} _2 + \left( {\displaystyle{{{\eta}_1{\pi}_{i} + {\eta}_2{P}_{i}} \over {{\eta}_1 + {\eta}_2}}} \right){\beta} _3 + {\unicode{x03B5}} _{i}} $$
Respondents’ prior beliefs regarding the probability of flooding in the hypothetical scenario presented in the survey are likely informed by their prior beliefs regarding flooding in coastal areas. These prior beliefs are not observed; however, similarly to Botzen and van den Bergh (Reference Botzen and van den Bergh2012), a vector of variables, C i, is used as proxy for π i in equation (4):
 $$ {{WT}{P}_{i} = {\beta} _0 + {X}_{i}{\beta} _1 + {D}_{i}{\beta} _2 + {C}_{i}\widetilde{{{\beta} _3}} + {P}_{i}\widetilde{{{\beta} _4}} + {\unicode{x03B5}} _{i}} $$
where
 $${\widetilde{{{\beta} _3}} = \displaystyle{{{\eta} _1} \over {{\eta} _1 + {\eta} _2}}{\beta} _3} \quad \quad {\widetilde{{{\beta} _4}} = \displaystyle{{{\eta} _2} \over {{\eta} _1 + \eta _2}}{\beta} _3} $$
Lastly, adding treatment assignment, T i, to equation (5) gives the following model of WTP that is used to measure the effect of the different treatments:
 $$ {{WT}{P}_{i} = {\beta} _0 + {X}_{i}{\beta} _1 + {D}_{i}{\beta} _2 + {C}_{i}\widetilde{{{\beta} _3}} + {P}_{i}\widetilde{{{\beta} _4}} + {T}_{i}{\gamma} + {\unicode{x03B5}} _{i}} $$
where T i assumes the values T i ∈ {0, 1, 2, 3} corresponding to the Control condition, Treatment 1, Treatment 2a and Treatment 2b. For a discussion of the two-limit Tobit model used to estimate WTP, see Supplementary Appendix C.
Results
To test the above hypotheses, 331 participants are recruited to take the survey instrument using Amazon's Mechanical Turk in exchange for a modest payment. Of the 331 respondents recruited via Mechanical Turk, 10 are excluded from the final sample due to incomplete responses. An additional respondent is flagged and removed from the final sample due to invalid and inconsistent answers. The final sample used in the analysis therefore includes 320 total respondents.
Sample characteristics
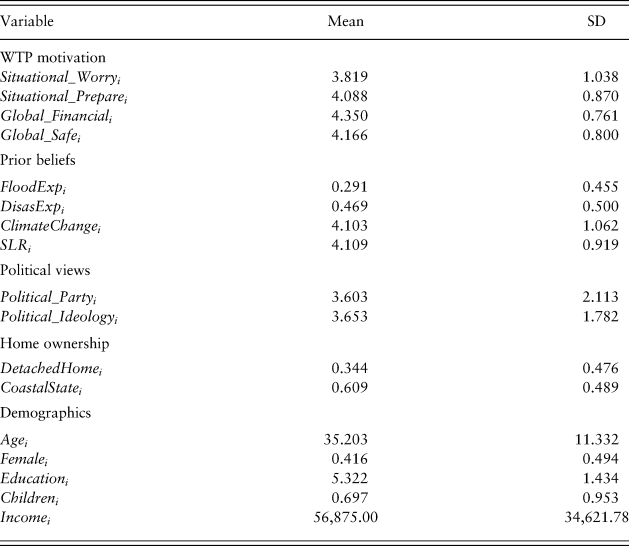
Summary statistics for the main explanatory variables elicited from the pool of Mechanical Turk respondents are given in Table 3.Footnote 6 Overall, the sample characteristics match those of the broader USA, up to a point.Footnote 7 The sample has slightly more male (57.81%) than female (41.56%) respondents. Respondents in the sample have more children and are more educated than the US population: approximately 42.13% of the sample indicated that they have at least one child, and 63.44% of the sample have a bachelor's degree or higher. Overall, the sample skews towards younger individuals, with only 4.52% of the final sample over the age of 60 years. The median annual pre-tax household income in the sample is $62,500, which corresponds to the category ‘$50,001–$75,000’ and is similar to the median household income in the USA in 2017.
Summary statistics of the explanatory variables.

WTP = willingness to pay.
Descriptive analysis of WTP
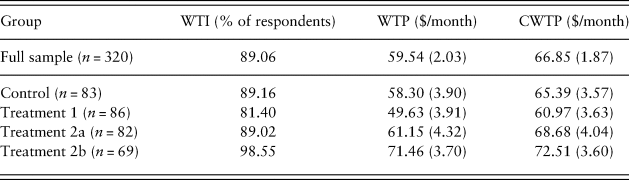
The results of the questions eliciting WTP for insurance against flooding of a hypothetical endowment are reported in Table 4. The proportions of respondents who indicate that they are willing to insure (WTI), the mean WTP of all respondents and the mean WTP conditional on indicating positive interest (i.e., answering ‘yes’ or ‘maybe’) in purchasing insurance (CWTP) are shown for the full sample, Control condition, Treatment 1, Treatment 2a and Treatment 2b.
Willingness to insure (WTI), mean willingness to pay (WTP) and mean conditional willingness to pay (CWTP) for the full sample, Control condition, Treatment 1, Treatment 2a and Treatment 2b.

Note: Standard errors reported in parentheses.
Each of these values measures different components of respondents’ insurance demands. The WTI measure captures the percentage of respondents who, when presented with information about the hypothetical flood risk, are willing to pay a non-zero amount for flood insurance. The mean WTP value for each group measures the utility respondents receive from the flood insurance policy described in the hypothetical scenario under each treatment status. Lastly, the CWTP value is computed as the mean WTP of respondents who are willing to pay a positive amount for flood insurance. This value is of interest as it captures the premium that respondents are willing to pay for the insurance product above or below the expected value of the loss described in the hypothetical scenario. In particular, for individual i:
 $$\eqalign{{Risk\; Premium}_{i} & = {CWTP}_{i}-( {Flood\; Probability} \times {Flood\; Damages} ) \cr & = {CWTP}_{i}-62.50} $$
The CWTP values reported in Table 4 average CWTP i values across all individuals in each group.
WTI across Treatment and Control groups ranges from 81.40% to 98.55%. A cursory comparison of WTI values across the Treatment and Control groups reveals that, relative to the Control subsample, the Treatment 1 subsample has a considerably lower (approximately 8 percentage points) WTI and the Treatment 2b subsample has a considerably higher (approximately 10 percentage points) WTI, whereas the Treatment 2a subsample's WTI is roughly equal to that for the Control subsample.
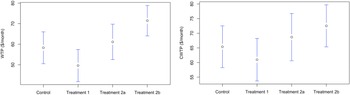
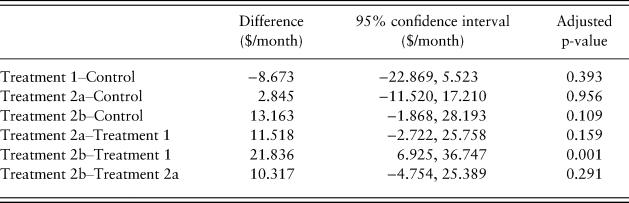
A similar pattern across treatment status emerges along the WTP and CWTP variables (see Figure 1). Ranging from $49.63/month to $71.46/month, mean WTP values for each of the Treatment and Control subsamples show that, relative to the Control group, individuals assigned to Treatment 1 have on average lower WTP values; individuals assigned to Treatment 2b have on average higher WTP values; and individuals assigned to Treatment 2a have on average roughly similar WTP values. Table 5 summarizes the results of a pairwise comparison of the difference in mean WTP across Treatment and Control groups using Tukey's honestly significant difference (HSD) test.
Mean and 95% confidence intervals for willingness to pay (WTP) and conditional willingness to pay (CWTP) across Treatment and Control groups.

Pairwise treatment/control group comparison of mean willingness to pay (Tukey's honestly significant difference [HSD] test).

Note: Tukey's test (Tukey, Reference Tukey1949) assumes independent and identically distributed random sampling, that observations are normally distributed within groups and homoscedasticity. Examination of the within-sample distributions and consideration of the data-generating process suggest that these assumptions are reasonable (see Supplementary Appendix D). One-way analysis of variance testing H 0: no difference between the mean willingness to pay across Treatment and Control groups rejects the null hypothesis with F-value of 4.859 (p = 0.003).
Mean CWTP ranges from $60.97/month to $72.51/month across Treatment and Control groups. Using the CWTP results for each Treatment and Control group reported in Table 4 and equation (8), the risk premium across Treatment and Control subsamples ranges from –$1.53/month to $10.01/month. In particular, whereas the mean risk premium for individuals in the Control group is estimated to be positive ($2.89/month), the mean risk premium for individuals in Treatment 1 is estimated to be negative (–$1.53/month), suggesting that these individuals either derive negative utility from the acquisition of the insurance policy described or are systematically underestimating their risk exposure. Individuals in the nudge treatments – Treatments 2a and 2b – have mean risk premiums greater than two and three times that of the Control group, respectively. This suggests that individuals assigned to these treatment groups either derive positive utility from the acquisition of insurance or are systematically overestimating their risk exposure.
Estimation results of two-limit Tobit model
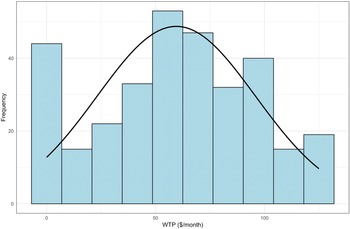
Inspection of the distribution of WTP results for the full sample suggests that the use of a two-limit Tobit model is appropriate (see Figure 2 and Supplementary Appendix C for a discussion). Table 6 reports the coefficients and standard errors of the two-limit Tobit model estimated by Newton–Raphson maximization, as well as the resulting estimated marginal effects of a unit change in the explanatory variables on WTP.
Distribution of willingness to pay (WTP) values for the full sample (n = 320). A normal distribution with moments equal to the sample moments is overlaid to show the censoring at the tails of the sample distribution.

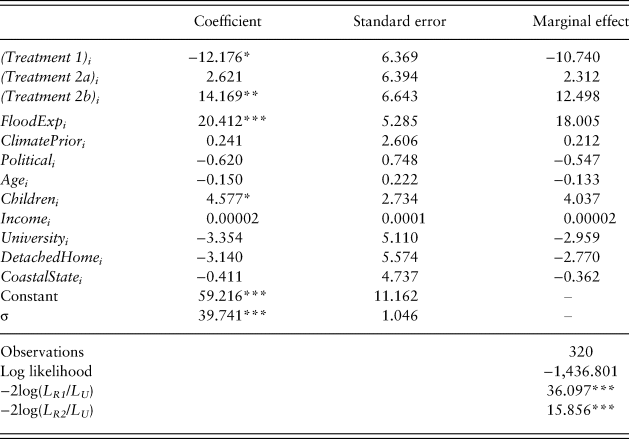
Estimation results of the two-limit Tobit model of willingness to pay.

Note: (Treatment 1) i, (Treatment 2a) i and (Treatment 2b) i are binary variables indicating individual i’s treatment assignment. ClimatePrior i is generated as the sum of ClimateChange i and SLR i for individual i (α = 0.84) and is normalized to have a mean of 0 and a variance of 1. Political i is generated as the sum of Political_Party i and Political_Ideology i for individual i (α = 0.76) and is normalized to have a mean of 0 and a variance of 1. University i is a binary indicator variable that equals 1 if individual i’s highest schooling completed is greater than or equal to a bachelor's degree. L R1 is the likelihood value for the completely restricted (i.e., just a constant) model. L R2 is the likelihood value for the restricted model excluding just the treatment status variables.
*p < 0.1; **p < 0.05; ***p < 0.01.
Overall, point estimates for the parameter values have the expected valence, with several exceptions. The test for joint significance of all the covariates is the log-likelihood ratio, which is generated as the statistic − 2log(L R/L U). In this case, the log-likelihood ratio is sufficient to reject the null hypothesis that all of the coefficients on the covariates in the model are equal to zero at the 1% significance level (p = 0.0003). The log-likelihood ratio is also sufficient to reject the null hypothesis that all of the coefficients on the treatment status indicator variables are equal to zero at the 1% significance level (p = 0.001).
Assignment to several of the treatment conditions appears to have a significant effect on WTP for flood insurance. In line with the findings of the descriptive analysis, assignment to Treatment 1 is estimated to result in a large decrease in WTP that is statistically significant at the 90% confidence level, and assignment to Treatment 2b is estimated to result in a large increase in WTP that is statistically significant at the 95% confidence level. The estimated marginal effects for assignment to Treatments 1 and 2b are –$10.74/month and $12.50/month, respectively. The point estimate on the coefficient of the binary variable indicating assignment to Treatment 2a is positive; however, the size of the standard error on this term suggests that it is not possible to distinguish this parameter from zero at any common level of statistical significance. This is also in line with the findings of the descriptive analysis.
Past exposure to flooding and prior beliefs regarding climate change and sea-level rise also appear to have positive effects on WTP. In particular, past experience with a severe flood is estimated to have a large, statistically significant effect on WTP for flood insurance. Though the point estimate for the coefficient on prior beliefs regarding climate change and sea-level rise is positive (i.e., stronger beliefs that climate change and resulting sea-level rise are occurring/will occur result in a higher WTP value), the estimated effect is small and not guaranteed to be non-zero. Of the remaining explanatory variables, few appear to have a large effect on WTP.
The role of situational and global motivation
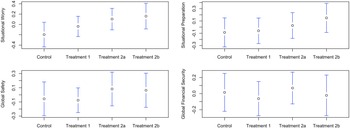
Figure 3 shows the group means for the two situational and two global variables across the treatment and control groups. Overall, there does not appear to be significant variation in each of the motivation variables across treatment status, particularly in the case of the two global motivation variables. The two nudge treatments (Treatments 2a and 2b) do have slightly higher mean levels of worry and prevention motivation; however, it is unclear whether these differences across treatment groups are non-trivial.
Mean and 95% confidence intervals for the four motivation variables across Treatment and Control groups: worry (situational), preparation (situational), safety (global) and financial security (global). The motivational variables are transformed into z-scores.

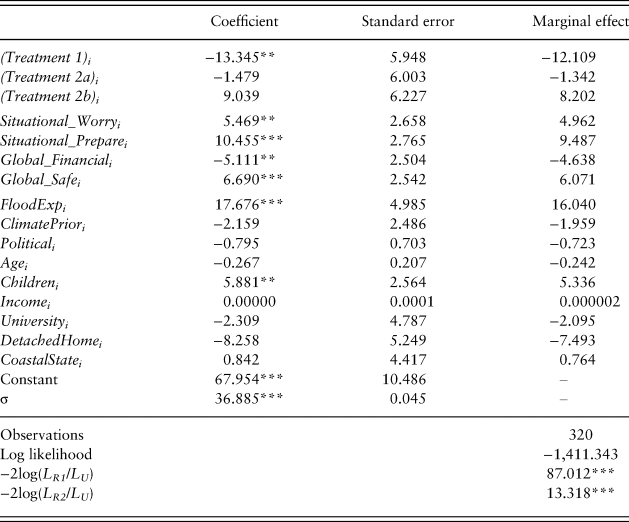
To further examine the role of situational and global motivation, the four motivation variables are added to the two-limit Tobit model. Table 7 reports the coefficients and standard errors of the two-limit Tobit model including transformations of the motivation variables as z-scores, as well as the resulting estimated marginal effects of a unit change in the covariates on WTP.
Estimation results of the two-limit Tobit model of willingness to pay observing motivation.

Note: (Treatment 1) i, (Treatment 2a) i and (Treatment 2b) i are binary variables indicating individual i’s treatment assignment. The motivation variables are normalized to have a mean of 0 and a variance of 1. ClimatePrior i is generated as the sum of ClimateChange i and SLR i for individual i (α = 0.84) and is normalized to have a mean of 0 and a variance of 1. Political i is generated as the sum of Political_Party i and Political_Ideology i for individual i (α =0.76) and is normalized to have a mean of 0 and a variance of 1. University i is a binary indicator variable that equals 1 if individual i’s highest schooling completed is greater than or equal to a bachelor's degree. L R1 is the likelihood value for the completely restricted (i.e., just a constant) model. L R2 is the likelihood value for the restricted model excluding just the treatment status variables.
*p < 0.1; **p < 0.05; ***p < 0.01.
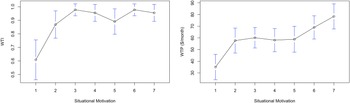
Overall, the estimated model parameters match those estimated in the model in which motivation is not observed. All of the motivation variables are statistically significant at the 95% confidence level or greater. The marginal effect of the financial security global motivation variable is large and negative, which is a somewhat counterintuitive result. As expected, the estimated marginal effect of the global safety variable is large in magnitude and positive. Moreover, the estimated marginal effects of the situational variables on WTP for insurance are both large in magnitude and positive. This strong relationship between situational motivation and insurance demand is shown in Figure 4.
The effect of situational motivation on willingness to insure (WTI) and mean willingness to pay (WTP). The situational motivation categorical variable is generated by summing the values of the situational worry and prevention variables, generating the associated z-score for the resulting sum and dividing individuals into seven equally sized quantiles. Motivation values range from 1 = lowest z-score to 7 = highest z-score.

Interestingly, the effect of assignment to Treatment 2b is somewhat smaller than the specification in which motivation is not observed and is no longer statistically significant, whereas the coefficient on the variable indicating assignment to Treatment 1 is larger in magnitude and now statistically significant at the 95% confidence level. This, coupled with Treatment 2b's higher group mean for both situational motivation variables shown in Figure 3, suggests that a significant portion of the effect of assignment to Treatment 2b found in the model in which motivation is not observed is due to higher levels of situational motivation.
Discussion
The above results contribute to five key findings, which are now discussed in the context of the set of hypotheses (H) enumerated previously, as well as the broader literature on this topic.
First, WTI in the final sample is far higher than anticipated, ranging from approximately 81% to 98%, which contradicts hypothesis H1. This is a relatively high range compared to other findings in the literature; however, these studies examined individuals’ insurance preferences using either monetary payoffs (e.g., McClelland et al., Reference McClelland, Schulze and Coursey1993) or real-world endowments (e.g., Botzen & van den Bergh, Reference Botzen and van den Bergh2012), so it is natural that WTI would be lower in these cases. Moreover, the inclusion of the option ‘maybe’ in response to the question eliciting interest in purchasing an insurance policy rather than a simple binary response format may contribute to higher WTI values.
Second, respondents demonstrate relatively effective expectational reasoning skills in the contingent valuation experiment employed herein. As previously noted, expected damages to the endowed home in the hypothetical scenario are held constant at $62.50/month. The fact that the mean WTP and mean CWTP for the Control group are $58.30/month and $65.39/month, respectively, suggests that individuals in this sample are relatively well equipped ex ante to calculate the actuarially fair premium (i.e., the premium equal to the expected damage amount) in this experimental setting. Again, this is likely an artifact of the manufactured scenario in which agents’ demand is elicited: the relatively easy-to-manipulate numbers used in constructing the scenario, the lack of real-money consequences and numerous other factors likely mitigate the behavioral biases that are evident in other experimental (e.g., Slovic et al., Reference Slovic, Fischhoff, Lichtenstein, Corrigan and Combs1977; McClelland et al., Reference McClelland, Schulze and Coursey1993) and real-world settings (e.g., Kunreuther & Slovic, Reference Kunreuther and Slovic1978; Atreya et al., Reference Atreya, Ferreira and Michel-Kerjan2015). Moreover, Botzen and van den Bergh (Reference Botzen and van den Bergh2012) similarly find that respondents’ risk premiums for hypothetical flood insurance policies are relatively small. Given that the primary objective of this research is to compare the relative effect of different behaviorally informed policies, this finding does not invalidate the core findings regarding the nudge and boost interventions.
Third, the statistical numeracy boost as designed and implemented herein reduces respondents’ WTI and WTP for insurance in the hypothetical scenario. In both specifications of the two-limit Tobit model of WTP, assignment to the boost is shown to have a statistically significant, negative effect on WTP for flood insurance. This is a partial validation of H2: though a null effect of the boost is hypothesized, a robust negative effect is not. There are several possible explanations for this finding. First, it is possible that the boost employed herein is not designed effectively given its objective of improving statistical reasoning. This would possibly explain a null effect; however, it is unlikely that this alone would produce a robust negative effect. Second – and more likely – it is possible that the boost design inadvertently targets an existing behavioral bias that effectively nudges insurance demand downward. Slovic et al. (Reference Slovic, Fischhoff and Lichtenstein1978) may prove useful here: with respect to LPHC events, individuals appear to have a threshold probability value below which they effectively ignore the risk. Perhaps equipping individuals with a prescriptive heuristic to interpret probabilities in frequency terms in the case of flood insurance simply underscores the fact that the risk in question is below the threshold probability at which they ignore the risk.
Fourth, relatively simple, inexpensive nudges are more effective at increasing take-up and WTP for flood insurance than boosts. As shown in Table 5, the mean differences in WTP between Treatment 2a and Treatment 1 and between Treatment 2b and Treatment 1 are both positive, though the former is not statistically significant. This is in line with previous results suggesting that altering the risk framing (Johnson et al., Reference Johnson, Hershey and Meszaros1993; Botzen et al., Reference Botzen, de Boer and Terpstra2013) is an effective means of enhancing risk perceptions in the insurance context. In particular, this matches Slovic et al.’s (Reference Slovic, Fischhoff and Lichtenstein1978) finding that extending the scale over which an LPHC risk is presented results in greater attention being paid to the given risk. Overall, this paper finds sufficiently strong evidence to justify a weak preference for nudges over boosts in the context of flood insurance based on a comparison of their effects on WTP for insurance. While other factors may enter into the policy-maker's objective function, these are outside of the scope of this paper and should be weighed against the results presented herein.
Fifth, targeting the affect and availability heuristics in addition to altering the risk presentation results in a significant increase in WTP for flood insurance, thereby validating H3. In fact, it appears as though in order for a nudge to effectively alter risk perceptions in the context of flood insurance relative to the baseline of no behaviorally informed intervention, it is necessary to explicitly target the affect and availability heuristics. As shown in Table 6, assignment to Treatment 2b (the affective nudge) is estimated to have a statistically significant marginal effect on WTP for flood insurance of $12.50/month. While including the motivation variables in the estimation of WTP diminishes this effect (see Table 7), this is likely due to the fact that individuals assigned to Treatment 2b report, on average, higher levels of situational motivation (see Figure 3), which is associated with higher WTP (see Figure 4 and Table 7). While this suggests that the affect and availability heuristics are responsible for the large, positive effect of Treatment 2b, additional research is necessary to causally identify the role of these mechanisms.
Though great care is taken to ensure the robustness of these findings, there are several limitations to the analysis conducted herein that are worth noting explicitly. First, as discussed above, the lack of monetary consequences to insurance decisions made in the hypothetical scenario likely influences individuals’ stated insurance preferences. Future work comparing these two policy types in this setting or similar settings should structure choice experiments in which insurance decisions have real monetary consequences. Second, the use of an open-ended contingent valuation method does raise some concern regarding the validity of the results; however, certain estimation techniques are employed to address this issue. Additional work in this area should make use of discrete choice experiments or other closed-form referendum formats in eliciting WTP for insurance against LPHC events.
Conclusion
That individuals in both experimental and empirical settings fail to purchase insurance against LPHC events – even in settings where premiums are partially subsidized – is a well-established fact. This finding challenges many conventional microeconomic models of consumer behavior in insurance markets (e.g., see Rothschild & Stiglitz, Reference Rothschild and Stiglitz1976). In light of the many findings in the cognitive psychology and behavioral sciences literature suggesting that this phenomenon is likely the result of behavioral biases, behaviorally informed policy tools are appropriate candidate solutions for increasing low take-up of insurance. Two categories of behaviorally informed policies that are often used to address behavioral biases are nudges and boosts.
This study provides experimental evidence comparing the effectiveness of nudges and boosts in increasing low take-up rates in the context of flood insurance. Overall, this study finds that nudges are more effective than boosts in increasing take-up of and WTP for flood insurance. Moreover, the effectiveness of a nudge in increasing WTP for flood insurance relative to the baseline case in which no behaviorally informed intervention is implemented appears to be conditional on the provision of information intended to elicit an affective response and to prime respondents to consider salient, recent examples of coastal flooding.
These findings provide novel insights to policy-makers seeking to increase take-up rates for insurance against flooding or other LPHC events. In particular, this study suggests two main takeaways for policy-makers and practitioners. First, behavioral policy matters: the differences between individuals’ WTP for flood insurance in two of the three behaviorally informed interventions used in this study and the control condition in which no behaviorally informed intervention is used are significant. Thus, any effort to increase take-up of insurance against flooding or other LPHC events should make use of behaviorally informed interventions.
Second, policy-makers should pay particular attention to the framing of risk when providing information in LPHC settings. Extending the time horizon over which risk probabilities are provided and presenting risk information alongside salient examples increases the attention individuals pay to the risk in question. In the case of flood insurance, this finding suggests that the common practice of presenting flood risk in terms of annual probability thresholds (i.e., a 1% probability of flooding in a given year) is ineffective and that this risk should be reframed if policy-makers are to increase the salience of this risk communication. Though additional work is necessary to provide an empirically based framework for understanding those conditions under which nudges or boosts are most effective in this setting, this paper suggests that policy-makers should consider using relatively inexpensive, affective nudges to increase take-up of insurance against LPHC events.
Supplementary material
To view supplementary material for this article, please visit https://doi.org/10.1017/bpp.2019.31.
Acknowledgements
I would like to thank Cass Sunstein and an anonymous reviewer for their valuable feedback on earlier drafts of this paper. I am grateful to Arevik Avedian for her helpful comments on the survey instrument, as well as to the students in the Behavioral Economics, Law, and Public Policy Seminar at Harvard Law School for their engaging discussion on this topic.
Disclaimer
The author is solely responsible for any errors contained herein.
Note
Data and code to replicate the analysis in this paper are available from the author on request.