


1. Introduction
The rapid progress in the science of global climate variability initiated in the 1980s enabled scientists to develop seasonal climate forecasts for various regions of the world. By climate forecasts we mean the prediction of the probability distribution of future weather conditions several months ahead. These forecasts have potential economic benefits to the extent that the impacts of current decisions depend on future weather conditions. The prospect that climate forecasts can be a valuable piece of information for society spawned the recent creation of a number of national and international institutions dedicated to linking climate science to socially relevant applications (Mjelde et al., Reference Mjelde, Hill and Griffiths1998). Reports of efforts to close the gap between scientific climate knowledge and applications exist, but progress seems to be slow, with the existing experiences showing limited success.Footnote 1
How important though are climate oscillations to the economy in general? Some scholars argue that the importance of climate goes far beyond agricultural markets, with significant implications to the aggregate economy, especially for (but not limited to) developing countries. Brunner (Reference Brunner2002) for example, establishes a significant connection between climate variability and world primary commodity prices, world consumer price inflation, and world economic activity. Datt and Hoogeveen (Reference Datt and Hoogeveen2003) find that the impact of the Asian financial crisis of the late 1990s on poverty and income inequality in the Philippines was in fact dwarfed by the impact of the 1997/98 El Niño. At a more general level, Gallup and Sachs (Reference Gallup and Sachs2000) suggest that climate forces are a key variable in explaining the development gap in the tropics.
This paper uses climate information to forecast the yield of rainfed corn in the semi-arid state of Ceará, a representative area of the Brazilian semi-arid region predominantly located in the Brazilian Northeast. Current scientific knowledge enables relatively successful predictions of climate variability in this region. Furthermore, the rainfed corn market is closely associated with climate variability and works as a barometer for socio-economic impacts of droughts in the Brazilian semi-arid region. This market is also a good indicator of the impact of climate variability on local drought-related public finances. Hence, by focusing on the local corn market we effectively gain insight into the broader consequences of droughts in the region. By forecasting quantity and prices in this market, we hope to buy policymakers time in the process of responding to a climate-induced crisis, thus possibly improving the efficiency of drought-related public spending in the region.
That accurately forecasting climate impacts can have positive impacts on public spending policies is clearly illustrated by the 1997/1998 El Niño. The forecast of a strong El Niño by the scientific community prompted the government of Peru to seek financial help from the World Bank to help the country to prepare for the anticipated impacts. A loan of US$150 million was made available to Peru and enabled the country to better respond to the economic impacts of the El Niño. That same year, Kenya experienced heavy rains that took a toll on life and property in the country. In contrast to Peru, Kenya's government did not initially pursue a pro-active plan to tackle the possible consequences of an El Niño, but eventually appealed to the World Bank. The Bank approved a loan to the country conditional on close scrutiny to address concerns involving governance and efficient use of the resources meant to mitigate the effects of adverse climate (Glantz, Reference Glantz2001: 119–122).
Some important lessons emerge from the Peruvian and Kenyan experiences. First, useful climate forecasts must be rooted in a well-established link between climate determinants and local impacts. The fact that Kenya did not adopt pro-active measures in 1997 in contrast to Peru is probably rooted in a weaker and not so well-established connection between the El Niño phenomenon and its consequences to the country. In fact, the unusually warm sea surface temperature of the western Indian Ocean towards the end of 1997 probably was a major determinant of local rainfall. As in the case of Kenya, climate in the Brazilian Northeast is influenced by other climate forces (Atlantic Ocean) in addition to the El Niño phenomenon. Before proceeding with forecasting the impact of climate in the region, we need to establish a quantitative link between local climate determinants and their impacts. Second, governance problems may undermine fund raising efforts and the use of climate forecasts to mitigate the socio-economic impacts of extreme weather has to take governance into account. Whereas past efforts to mitigate the effects of droughts in the Brazilian semi-arid region have been severely crippled by corruption and bureaucratic inefficiencies, recent governance improvements (Tendler, Reference Tendler1998) make it a good laboratory for the use of climate forecasts in the design of innovative policies.
We estimate a set of econometric models to investigate the forecast of the impacts of droughts in Ceará. In doing so, we use a continuous measure of physical variables relevant to local climatic events.Footnote 2 We use a semi-parametric algorithm to study the impact of climate variability on the rainfed corn market in the State. We implement our analysis in two steps. First, we estimate a simultaneous equation model for the supply of and demand for local rainfed corn conditional on climate. We thus establish the link between local climate forces and their impacts, and identify the main variables that determine yield of corn in the State. Second, we use those variables identified in the first step to forecast severe droughts (defined as large decreases in yield) and the probability of their occurrence conditional on current climate determinants.
Although we frame our discussion here in terms of public spending, the rationale of our analysis is applicable to any decision-making processes that involve attention to future climate realizations. Furthermore, this type of analysis can be applied to several areas of the globe, especially in the region between the tropics, where many developing nations are located.Footnote 3
This paper is organized in five sections. Section 2 briefly discusses the nature of the impact of droughts in the Brazilian semi-arid region and the efforts to reduce it. Section 3 reviews the main determinants of climate and the corn market in the State and presents a preliminary graphical analysis of the data. Section 4 estimates the link between local climate and its economic impacts, and Section 5 concludes.
2. Droughts in the Brazilian semi-arid region
The Brazilian semi-arid region extends for over 900,000 km2 in the northeast and for a small portion of the southeast regions of the country. With 19 million inhabitants, it houses 11.4 per cent of the Brazilian total population (Brazilian Institute of Geography and Statistics, IBGE, 2000 Census). This part of the country is subject to recurrent droughts and has challenged the ability of the local and national governments to design effective and efficient policies to mitigate the effects of local climatic shocks. Since the ‘very strong’ El Niño (Quinn, Reference Quinn, Diaz and Markgraf1992: 122) of 1877–1879, when over 150,000 people died from starvation and the quick spreading of diseases in overpopulated urban centers, the national government has sought actions and policies to prevent and mitigate the effects of droughts in the region.
Policies and actions to combat the consequences of droughts in the region can be classified as emergency intervention or actions to reduce climate vulnerability in the long-run. Emergency spending typically involves the supply of potable water, provision of medical services, and distribution of food and medicines in dry years. Long-term spending comprises investment in the local water supply infrastructure such as the construction of reservoirs and canals. These actions have been funded mainly by discretionary transfers from the federal government to affected states and municipalities (Magalhães, Reference Magalhães1991). However, these transfers have been subject to inefficiencies stemming from the bureaucratic lethargy at various levels of government, lack of planning of expenditures common to situations of crises, and corruption.
In this paper, we focus on the State of Ceará, not only because data are readily available for the state, but also because it can be considered representative of the Brazilian semi-arid region and a good laboratory for innovative drought-related policy making. First and foremost, around 95 per cent of the Ceará territory (146,817 km2) is classified as semi-arid, and a large portion of its population is highly vulnerable to the effects of droughts (World Bank, 2000). This population consists mostly of families engaged in subsistence farming, and is characterized by indices of human development (based on education, health, and income variables) that are well below the regional and national averages (IPECE, http://www.ipece.ce.gov.br/).Footnote 4 Secondly, the State of Ceará has experienced significant governance improvements in the last few decades (Tendler, Reference Tendler1998). Better governance is an essential component for the successful use of climate information in the implementation of welfare-improving policies.
The bulk of drought-related resources available to the State comes from discretionary transfers following an already established crisis situation. Hence, these transfers are subject to costly delays and there is often little time to plan for an appropriate course of action. The assumption underlying this study is that understanding the connection between climate, its impacts, and their forecasting potential (conditional on current climate information) can help policy makers buy time to design more efficient, expeditious, and transparent drought-related policies. For example, a committee involving stakeholders and representatives from the local and federal governments could meet before the beginning of the rainy season (February through May) and recommend a course of action based on current climate information. Threshold levels of climate indicators could be used to send warnings to funding agencies (as in the case of Peru discussed above) and secure resources to be released in a pre-programmed fashion. This process would help expedite the transfer of resources if they were needed. Additionally, early involvement of stakeholders would add transparency to the appropriation and allocation of resources.
For the aforementioned benefits to accrue to the region, two important conditions must be met. First, a better quantitative link between droughts in the region and their socio-economic impacts must be established. Second, a reliable forecasting mechanism of these impacts must be in place. This study contributes to the meeting of these two conditions by analyzing the market for rainfed corn in Ceará, an indicator variable for the impacts of droughts in the region.
3. Corn and climate in Ceará
In this study we focus on rainfed agriculture in Ceará as our indicator for welfare impacts of local droughts. Although agriculture accounted for only 5.58 per cent of the State GDP in 2000, it employed 40 per cent of the State labor force, mostly on small rainfed and subsistence farms that are highly vulnerable to recurrent droughts.
Among the rainfed crops that are produced in the State, corn is likely to be the most important to local farmers' consumption and income. Furthermore, rainfed corn production serves as a barometer for the economic consequences of droughts in the region and for public spending on the alleviation of these consequences. Figure 1 shows total transfers from the federal government to the State of Ceará and local corn production. The correlation between federal government transfers and corn production in the State was −0.7.Footnote 5 Although other indicators of social well-being for the semi-arid region exist, they were first calculated only recently. Examples are the human development index at the municipal level (1991, 2000), index of municipal development (1998, 2000, 2002, and 2004), and the very recent municipal warning index (2005). By contrast, data on corn production, yield, and prices date back to the late 1940s. Finally, a typical indicator would be local GDP, but because of the importance of industry and services (especially tourism) in the region as well as high levels of income concentration, local GDP seems fairly insensitive to droughts and is a poor indicator of the effects of droughts on the large vulnerable population. Hence, by studying and forecasting the rainfed corn market in the State we actually seek to understand and forecast more than the direct information contained in this market. In other words, by focusing on the corn market, we effectively gain insight into the broader consequences of droughts in the region.
Corn production and total transfers (standardized and detrended values)
Source: Planning Secretariat, Ceará (SEPLAN/CE).

To investigate the link between climate and corn production in Ceará, we turn to the likely most important driving force of local climate, namely sea surface temperatures (SSTs) of specific regions of the tropical Pacific and Atlantic oceans (Moura and Shukla, Reference Moura and Shukla1981; Hastenrath, Reference Hastenrath1984). As SSTs in the central and eastern portions of the tropical Pacific increase above their climatological averages, this region of the globe experiences low atmospheric pressure and increased rainfall. These changes tend to be associated with increased atmospheric pressure and decreased rainfall in the Brazilian Northeast (Ropelewski and Halpert, Reference Ropelewski and Halpert1987). This is the so-called El Niño effect, whereas the opposite phenomenon, with arguably symmetrical consequences for the Brazilian northeast, is known as the La Niña effect.Footnote 6
Another determinant of local climate is the position of the Inter Tropical Convergence Zone (ITCZ) – an east to west wind current around the globe that is associated with low pressure and rainfall. The position of the ITCZ in the Atlantic is strongly influenced by the difference between average southern and northern Atlantic SSTs, a gradient termed the ‘Atlantic Dipole’. In general, a strong Atlantic Dipole – defined here as average southern Atlantic SSTs minus average northern Atlantic SSTs – causes the ITCZ to migrate south and towards the Brazilian northeast (Moura and Shukla, Reference Moura and Shukla1981). Thus, the Atlantic Ocean can either reinforce or compensate for the influence of the Pacific Ocean over climate in the Brazilian semi-arid region.
In order to study the impacts of droughts in Ceará, we investigate the link between climate and the corn market in the State as a basis for the econometric analysis in section 4. We first explore the relationship between precipitation, production, and price of rainfed corn in Ceará, followed by the relationship between SSTs, production, and prices. But before we proceed, some qualifications on the data are in order. First, prices and quantities of corn are aggregated at the State level and include data from humid regions as well as arid ones. This however is not a serious problem, since most of the production of corn takes place in the semi-arid portion of the territory. Second, precipitation data for the State are disaggregated by geographic regions, which do not necessarily coincide with the regions where only rainfed corn is produced. To tackle this problem, we use indices of precipitation for the Sertão Central geographic region, a semi-arid region of the State where rainfed agriculture prevails.
Figure 2 depicts the link between the corn market and precipitation in Sertão Central. Also shown are the estimated curves depicting the relationships between quantity, price, and precipitation.Footnote 7 These curves were obtained through a non-parametric algorithm – smoothing spline – based on the local regression of the dependent variable (quantity and price) on the explanatory variable (precipitation) and smoothed over the entire range of the explanatory variable. The estimated curves characterize crop losses due to droughts as well as excessive rains causing siltation, excessive soil humidity, and floods. The pattern for precipitation and prices is the opposite. In a small open economy where local prices fully responded to external forces from a larger market, prices would be uncorrelated with local climate.Footnote 8 However, the graphs for prices suggest otherwise. The graphs in figure 2 along with the fact that local corn production is carried out by small price-taking farmers suggest that a competitive partial equilibrium model has some explanatory power over the determination of prices and quantities of corn in the State. This, in turn, justifies the instrumental variables regression models we estimate in section 4.
Precipitation, quantities and prices of corn in Ceará (1964–1997).

Next we turn to the relationship between the main determinants of local climate and the corn market. In particular, we calculate simple and rank correlations between average SSTs for the rainy season in the State (February through May) and quantities and prices of corn, followed by correlations between lagged SSTs and quantities and prices of corn. By doing that we hope to gain insight into the potential to forecast rainfed agriculture in Ceará given information on SSTs. When calculating correlations between SSTs and rainfed agriculture indicators, we expect the tropical Pacific Ocean SSTs to be negatively correlated with production and positively correlated with prices (El Niño effect). The North Atlantic SSTs are expected to be negatively correlated with production and positively correlated with prices, whereas the opposite is expected for South Atlantic SSTs (Atlantic Dipole effect).
3.1. Trends in the local corn market
Before proceeding, we need to remove the effect of a myriad of forces that affect prices, quantities, and yield to be able to isolate the effect of climate on these variables. These include the institutional and technological forces that play a role in different periods of our data sample. Notable examples are the new hybrid corn types introduced in the late 1980s in Brazil, the ‘Hora de Plantar’ seed distribution plan implemented by the Ceará government in 1987 (Santana et al., Reference Santana, Folhes, Mayorga and Mayorga1999), and recent barriers to the importation of transgenic corn in Brazil. At the international level, King (Reference King2001) identifies the Asian financial crises of the late 1990s, US, Chinese, and Argentine policies since the 1970s, and differentiated treatment of corn and soybeans (a substitute for corn) during the GATT and WTO negotiations as important forces affecting the world market for corn.
The national, state, and international institutional and technological factors that prevailed in different periods in our data set (1953 through 1997) resulted in potentially non-linear trends for quantities and prices. Furthermore, planted area has changed during the period covered by our sample. In addition, the data-generating process for these variables is possibly non-stationary. To tackle these problems, we first use corn yield (metric tons of corn output per hectare of planted area) in place of simple quantities produced. Second, we purge long-term and transitory trends in yield and prices from these variables. To do this, it is necessary to estimate predicted yield and prices as functions of time through local regressions capable of capturing the interplay of different economic forces at different time periods within the data set. Furthermore the span for the local regressor should be flexible enough to optimally vary for each data point. Friedman's supersmoothing non-parametric local regression does precisely that (Friedman, Reference Friedman1984). For each date xt of the time series  , the smoother symmetrically chooses the k-nearest neighbors xi and implements a linear least squares procedure to estimate yt. Three values of k are used initially (n/2, n/5 and n/20, where n is the length of the time series) and the optimal k for each xt is chosen through cross-validation and interpolation between the three initial values. The result is a smooth non-parametric local regression function representing the time trends present in the different time periods within our sample. We then proceed by using the detrended data or the residuals from the non-parametric local regression of yield (quantity for graphing purposes) and price on time. These residuals are not autocorrelated, a feature that is not present in the original yield and price data, and that simplifies our subsequent econometric analysis.Footnote 9
3.2. Climate determinants and the Ceará corn market
Figure 3 plots the linear correlation between the Pacific and Atlantic Oceans SST anomalies (standardized difference between observations and climatologic averages – SSTA) during the rainy season in Ceará and detrended state corn production.Footnote 10 The figure depicts the expected correlation patterns within the inter-tropical band of the oceans. On the one hand, the warming up of the tropical Pacific SSTs contributes to reduced rainfall and crop losses in Ceará (El Niño effect). On the other hand, however, warming up of the South Atlantic SSTs tends to promote the opposite effect, whereas colder than average SSTs in the North Atlantic can reinforce the El Niño effect. More precisely, the correlation pattern in the Atlantic suggests the role played by the Atlantic Dipole in determining local precipitation and corn production.
Linear correlation between corn production and SSTAs averaged over the Feb–May period.

Figure 4 shows the correlations between the SSTAs and detrended prices. The observed pattern is opposed to that of figure 3, consistent with a competitive partial equilibrium model, where climatic shocks shift the supply, but not the demand curve. It is clear that the climatic signal is weaker for prices than for quantities produced in the State. Nevertheless, several regions of the oceans have correlation coefficients that are significant at the 2.5, 5, and 10 per cent significance levels, and a few have correlation coefficients that are significant at the 1 per cent level. A likely explanation for the weaker relationship between climate and prices is that corn markets in other regions may influence local prices to some extent.
Linear correlation between corn prices and SSTAs averaged over the Feb–May period.

Figures 3 and 4 help us to establish the link between SSTAs during the rainy season and the corn market in Ceará. Next, we investigate whether the climate signal can be observed before the rainy season. This is relevant as we pursue corn yield forecasts based on lagged climate signals. Current understanding of climate points at SSTAs, especially in the Pacific Ocean, as the main variable containing signals of future climate. Along these lines, we investigate the linear correlation between average SSTAs for October through December with data on production and prices of corn for the following year.Footnote 11 Forecasting the effect of a drought in the beginning of the calendar year, several months before crop harvesting,Footnote 12 can contribute to the preparation of drought contingency plans and to more efficient drought relief expenditures.
The correlation maps for lagged SSTAs and quantity and prices of corn in Ceará (not shown here for space considerations) show strong evidence of the El Niño effect. As we could expect, the correlation pattern for the tropical Pacific lagged SSTAs is not as strong as in the case of concurrent SSTAs. Nevertheless, the signs of the correlations are as expected. This is the case because the configuration of the Pacific Ocean SSTs takes place relatively slowly, already indicating by the end of the calendar year the predominant pattern for the first semester of the following year. This is due to the peculiar characteristics of the Pacific Basin, which is deeper and much larger than that of the Atlantic. The configuration of the Atlantic Ocean SSTs for the rainy season becomes clear only later on, during the first semester of the calendar year. Hence, the correlations between the Atlantic lagged SSTAs and quantities produced and prices differ more markedly from those in figures 3 and 4.
Finally, figure 5 captures the likely functional forms for the relationships between SSTAs, production and prices through non-parametric smoothing spline regressions. In constructing these figures, we turn to the climate literature to select the SSTAs from specific regions of the Pacific and Atlantic Oceans. SSTAs from the Niño 3 region of the tropical Pacific capture the El Niño effect, and the Atlantic Dipole, defined as the anomalies of the South Atlantic SSTAs minus the North Atlantic SSTAs, characterize the effect of the Atlantic Ocean during the rainy season. The tropical Pacific seems to have an approximately linear impact on the production and prices of corn. This general pattern holds true even if we eliminate the large SST outliers from the sample. On the other hand, the Atlantic Dipole influences production and prices in a non-monotonic fashion. There is a range of values for the Atlantic Dipole that contributes to the highest levels of production and lowest levels of prices for corn. Departures from this range in either direction contribute to crop losses and price increases.
Corn production and prices in Ceará and Niño 3 and Atlantic Dipole SST anomalies.
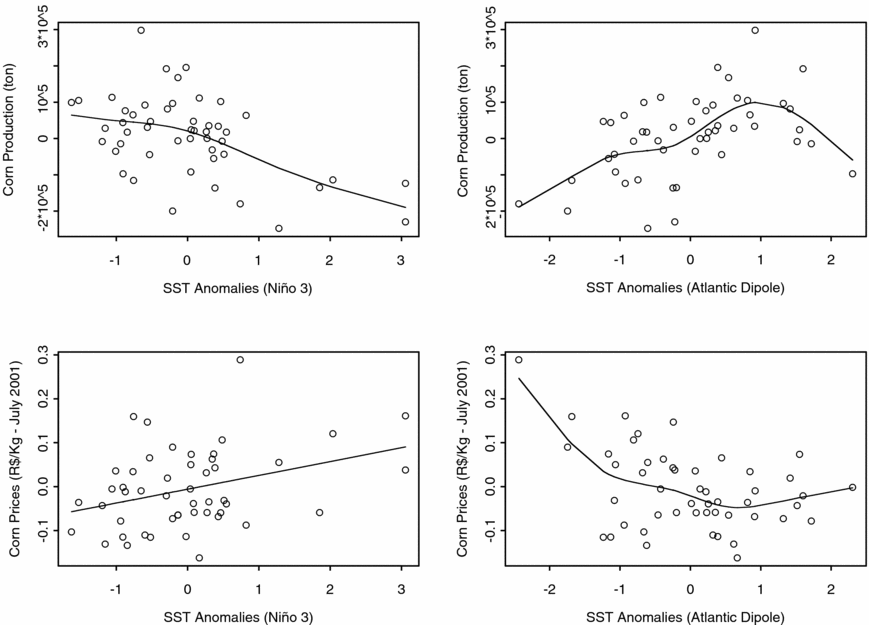
Figure 5 suggests an interesting interpretation of the effect of the oceans on rainfed agriculture in Ceará. Crop losses and price increases due to excessive rains are most likely due to large positive Atlantic Dipole anomalies. Ropelewski and Halpert (Reference Ropelewski and Halpert1987) show that colder than average SSTs in the tropical Pacific (La Niña) tend to result in increased precipitation in the Brazilian Northeast. However, our results suggest that, holding everything else constant, this effect does not seem to be strong enough to cause crop losses in Ceará. This observation corroborates the hypothesis that the impacts of extreme ENSO events are not symmetrical (Hoerling, Reference Hoerling and Glantz2002).
The preceding results help us to establish benchmark relationships for our analysis based on single-equation models for the relationships of interest. In the next section, we relax this assumption and estimate such relationships using a simultaneous equation model to better quantify and forecast the effect of the Oceans on the corn market in Ceará.
4. Results
In this section we estimate the impact of climate determinants on current and future equilibrium outcomes in the corn market. Our goal is to explore whether climatic information and the corn market contain early information that may expedite the process of transfers of resources, and buy time in the planning process for how these resources should be used. As in the successful Peruvian experience during the 1997/1998 El Niño, this information may help local policy makers seek resources before a situation of emergency is established. It may also help the federal government plan its discretionary transfers as a response to an imminent drought. We implement our objective in two steps. First, in order to provide theoretical guidance to our forecast model, we estimate a simultaneous equation model to describe the supply of and demand for corn in Ceará conditional on concurrent climate determinants. Second we forecast future equilibrium price and corn yield conditional on climate predictors.
Our second step is similar to the approach in Souza-Filho and Lall (Reference Souza-Filho and Lall2003). They use a k-NN algorithm (described in section 4.3) to forecast streamflow into local reservoirs conditional on current climate information. In contrast to their work, the object of study of our paper requires us to address a more complex behavioral system connecting climate and a socio-economic institution, namely the local corn market. We first need to identify market responses to variations in seasonal weather to pin down a theoretical benchmark for our forecasting model. We thus extend their technical analysis by including step 1. We also extend their forecasting exercise by calculating the probability of future extreme events conditional on current climate information.
We use the detrended data (residuals from the supersmoothing regression) on corn yield and prices to jointly estimate the following supply and demand equations:
Step 1:
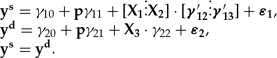
where ys and yd stand for corn yield (metric tons per hectare of planted area) in the supply and demand equations, respectively. Vector p contains corn prices, X1 and X3 are matrices with economic variables, and X2 is a matrix with climate determinants. The model coefficients are represented by the scalars γij and the column vectors γij, and ϵi are the error terms. The estimation procedure also includes a matrix of exogenous instrumental variables Z.
Step 2:
Based on model selection from step 1, we estimate the implied reduced form model with lagged variables for the prediction of the equilibrium yield and price of corn. We do so by estimating the following set of equations through a seemingly unrelated regression estimatorFootnote 13
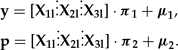
where the vectors y and p are the equilibrium yield and price of corn, X1l, X2l and X3l are the economic and climatic predictors known at time t − 1, πi < TB : break/ >< TB : hspacespace = "8 pt"/ > are parameter vectors and μi are the error terms.
Step 2 estimates a reduced model instead of a structural model for future supply and demand of corn for two reasons. First and most importantly, our focus is on the forecast of equilibrium corn yield. This is the indicator variable for the impacts of droughts in the state which is correlated with the spending of resources on drought mitigation. Second, whereas the estimated coefficients for our climate variables of the reduced model are statistically significant and have the expected signs, forecasting supply and demand proved to be a more difficult exercise. This suggests possible complexities in the forecasting of the structural model that are beyond the scope of this study.
4.1. Data
Data for production of corn refer to annual production in the State of Ceará, measured in tons and covering the period from 1947 to 2000. Corn prices are given in R$ per Kg at the July 2001 price level, according to the IGP-DI price index from Fundação Getúlio Vargas. Data for SSTs were calculated from the Extended Kaplan data set for sea surface temperature anomalies for selected areas of the Pacific and Atlantic Oceans. Data for income were not directly available. Since most corn production is consumed in the rural areas, we used total revenues with the most important rainfed agricultural outputs (beans, cassava, cattle, chicken, and corn) with 0- to 5-year lags as proxies for our income variable. Additional economic variables (described below) were used as instruments in our regressions in step 1. Prices of soybeans at the national level were also collected to reflect the possible influence of this substitute crop on the corn market. The sources of the data for production and prices were the Anuário Estatístico do Brasil, from Instituto Brasileiro de Geografia e Estatística (IBGE), and data manipulated by Instituto de Pesquisa e Estratégia Econômica do Ceará (IPECE). The time series lengths vary for different variables, thus affecting the sample size according to the estimated model.
4.2. Climate and corn
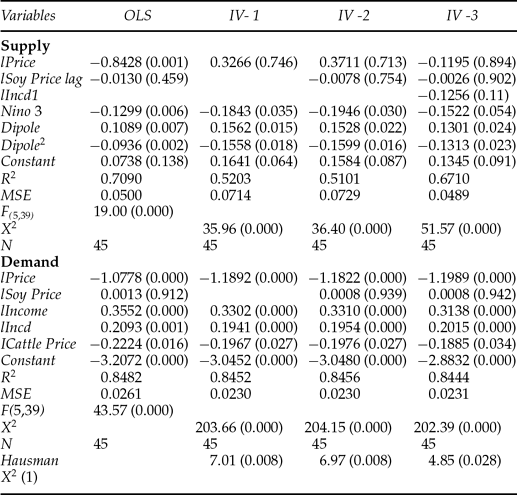
In this section we report the estimation results for the first step of our strategy. Table 1 summarizes the results. We use the natural logarithm of the economic variables, and estimate the corresponding elasticities. The same is not true for SSTAs, since the variable for the Atlantic Dipole can take either positive or negative values. The variables used in the regressions are:
Regression summary – climate and corn supply and demand
p-values in parentheses.
Climate variables
Nino 3: sea surface temperatures of the Nino 3 region of the central portion of the equatorial Pacific Ocean.Footnote 14 Data refer to average sea surface temperatures during the raining season in Ceará (February through May) at year t.
Dipole: difference between average sea surface temperatures from the south and north Atlantic Oceans (south–north). Data refer to average sea surface temperatures during the raining season in Ceará (February through May) at year t.
Dipole 2: squared Atlantic Dipole. Data refer to average sea surface temperatures during the raining season in Ceará (February through May) at year t.
Economic variables
lYield: detrended logarithm of corn yield (tons per hectare) at time t.
lPrice: detrended logarithm of prices of corn (R$ per Kg of July of 2001) at time t.
lIncome: proxy for logarithm of income at time t.
lIncd: proxy for differential of logarithm of income time t (lIncd = lIncomet – lIncomet– 1).
lIncd1: proxy for differential of logarithm of income at time t − 1 (lIncd1 = lIncomet− 1− lIncomet− 2).
lSoy Price: logarithm of price of soybeans, a substitute for corn, at time t.
lSoy Price lag: logarithm of price of soybeans at time t – 1.
lCattle Price: logarithm price of ton of bovine cattle at time t.
Exogenous instruments
iv 1: logarithm of price of corn at time t – 1.
iv 2: logarithm of bovine cattle stock at time t.
iv 3: logarithm of poultry stock at time t.
iv 4: logarithm of price of ton of bovine cattle at time t – 1.
iv 5: logarithm of price of poultry a time t – 1.
iv 6: proxy for differential of logarithm of income at time t–2 (lIncomet – 2– lIncomet– 3).
iv 7: proxy for differential of logarithm of income at time t – 3 (lIncomet– 3– lIncomet– 4).
Unfortunately, data for fertilizer costs are not available. However, we do not expect this to introduce serious problems to our results, since local experts indicated that the use of fertilizers by small farmers on rainfed corn crops in Ceará is negligible.Footnote 15
The second column of table 1 shows single equation OLS estimates for the supply and demand equations, whereas the subsequent columns show the estimated results for three instrumental variables models. An important feature of the reported estimates is the robustness of the qualitative results for the coefficients of the climate predictors. Even the naive single-equation OLS estimator produces the expected signs for the climate predictors: The El Niño effect negatively influences yield, and the Atlantic Dipole affects yield in an expected non-monotonic way (see figure 5).
In the columns labeled IV-1 through IV-3 we report the results of the simultaneous estimation of the system under different assumptions. Model IV-1 is a parsimonious formulation, where supply depends on the price of corn and climate determinants and demand is a function of price, income, incremental income, and the price of cattle.
The rationale for the inclusion of incremental income at time t (lIncomet – lIncomet –1) is that income shocks at time t relative to time t – 1 may influence the demand for corn at time t. This is due to the smooth consumption and permanent income hypotheses.Footnote 16 Several studies addressed whether rural households in less developed countries actually smooth consumption and to what degree, and found evidence of some smoothing but to a lesser degree than predicted by Pareto optimality.Footnote 17 Testing whether small farmers in Ceará smooth consumption over time is beyond the scope of this study, nor do we have the necessary data to do so. We do not pursue the estimation of the farmers' behavioral equations to perform such tests. We should thus be careful when interpreting the incremental income coefficients. They suggest a statistically significant relationship between income shocks and the demand for corn, but not much can be said about how income shocks affect consumption or income in the long run. This is because corn can be demanded for current or future consumption (savings through increase in the stock of grains), and because we do not estimate a set of behavioral equations consistent with a theoretical foundation for consumption smoothing.
Models IV-1 through IV-3 also include the variable ‘lCattle Price’ in the demand equation. Much of the local corn production is used to feed livestock (cattle stock is correlated with poultry and goat stocks, two other important livestock forms raised in the region). If the price of cattle increases, farmers have more of an incentive to sell their livestock and thus reduce their demand for corn. This effect seemed to be captured by the regression results. All variables in model IV-1 except for the logarithm of price in the supply equation are statistically significant at least at the 4 per cent significance level.
In model IV-2 we augment model IV-1 by including the logarithm of price of soybeans, a typical substitute for corn, in the supply and demand equations. We use price of soybeans at time t – 1 in the supply equation to capture the possible effect of this variable in the production decisions of the farmer at the time of planting. These variables are not statistically significant. This result is not surprising given the negligible importance of soybeans production in Ceará. Perhaps more importantly, the estimated coefficients and standard deviations for the price of soybeans help reinforce the assumption that the market for rainfed corn in Ceará is mostly locally based, with only limited external influence. This finding endorses the treatment of the market for rainfed corn in the State as relatively competitive and the estimation of the associated supply and demand model. It is pretty clear that the inclusion of the variables for price of soybeans in model IV-2 does not add to the results in model IV-1 and a more parsimonious formulation should be favored here.
Lastly, in model IV-3, we include the proxy for income shock ‘lIncd1’ at time t – 1 in the supply equation. This variable tries to capture the effect of income shocks at the time farmers make their planting decisions. Because corn is important for the local farmers' incomes and is also used for subsistence, shocks in income may affect the decision to plant, consume, or change the stock of grains to be consumed later. That is, ‘lIncd1’ tries to capture the effect of consumption and income smoothing on production and supply of corn. The coefficient for this variable is only statistically significant at the 11 per cent confidence level. Although its introduction does not change the qualitative results from the previous models with respect to the climate variables, the coefficient for price in the supply equation now has the wrong sign. As in the case of the effect of income shocks on demand, the significance of the estimated coefficient does not constitute a test of the consumption smoothing or permanent income hypotheses.
The estimated coefficients for price in the simultaneous equation models suggest that demand for corn is responsive to the price of this crop, whereas supply is relatively insensitive to price variation in the corn market. Other formulations – not shown here for space considerations – containing lagged prices of corn in the supply equation were estimated to capture the effect of this variable on production decisions during the planting season. However, the results reinforce the finding that price variation does not play an important role in the production decisions by the farmer. This result is not surprising. The perception of local experts is that, everything else constant, poor farmers have little to gain and a lot to lose if they refrain from planting their small stock of grains in response to forecasted corn prices. Lagged prices of corn are instead included in the matrix of exogenous instruments in order to capture the possible albeit limited influence of past prices at the national level on current prices.
Exogenous instruments included in the estimation of model IV-1 are iv 1 through iv 7, lSoy Price, lSoy Price lag, and lIncd1. Model IV-2 was estimated using iv 1 through iv 7 and lIncd1 as exogenous instruments, whereas iv 1 through iv 7 appear as exogenous instruments in model IV-3. Table 1 reports the Hausman specification test statistics contrasting the instrumental variables coefficient estimates with OLS. Under the null hypothesis that the residuals of the data generating process are asymptotically independent of the matrix X of explanatory variables, both OLS and the IV estimator produce consistent estimates, whereas if this assumption is not true the OLS estimator will be inconsistent and the IV estimator will be consistent. The test statistics for models IV-1 through IV-3 suggest rejection of the null hypothesis at least at the 3 per cent confidence level, thus lending strong support to our IV approach as opposed to OLS regression.
The estimation of our simple model lends strong support to a sizable link between global climate forces – represented by the Pacific and Atlantic Oceans SSTAs – and the local market for rainfed corn. More specifically, we estimate a linear relationship between tropical Pacific SSTAs and the logarithm of corn yield in Ceará. Everything else constant, a one standard deviation (approximately 0.60°C or 1.08°F) increase in the average sea surface temperature of the Niño 3 region during the rainy season contributes to an average decrease of 18 per cent of corn yield.Footnote 18 The Atlantic Dipole by contrast, affects corn yield in a quadratic form. For an important range of the Atlantic Dipole, increases in this variable contribute to increased production and lower prices. However, a strong Atlantic Dipole favorable to precipitation in Ceará tends to cause crop losses and higher prices in the State. This result is consistent with the smoothing spline curves depicted in figure 5.
In summary, we took initial steps to establish the quantitative connection between climate determinants and the rainfed corn market in Ceará. This was the first step of our analysis. As we pointed out in the Peruvian experience during the 1997/1998 El Niño, establishing the link between climate variability and its impacts is crucial in justifying an action plan based on climate forecasting. The next question we pose is whether currently observed SSTs have any predictive power over future variations in corn yield and prices. Given the relationship between rainfed corn production and government expenditures on drought relief (section 3), this piece of information could contribute to more efficient and expeditious public policies to minimize the effect of droughts in Ceará. We turn to this question next making use of the insights we obtained from the results in table 1.
4.3. Future corn yield and prices
The results from the previous section establish the link between climate and the corn market in Ceará, thus allowing us to identify the main variables that determine corn yield and price. We can now use the information on these variables available at a given point in time to forecast corn yield and price in Ceará. We use lagged economic variables combined with Pacific and Atlantic Ocean SSTAs averaged during the November–January (NDJ) and October–December (OND) trimesters prior to the harvesting season (July and August). Simple and rank correlations of lagged STTAs and the corn market (available from the authors upon request) indicate that the signal from the Pacific Ocean seems to be stronger than that of the Atlantic Ocean during these times of the year.
Attempting to forecast demand and supply proved to be a rather difficult exercise – one that is unlikely to be successfully carried out without more detailed spatial information and better knowledge of climate prediction than is currently available. However, the climate signature on future corn yield and prices is evident months before the harvesting season. Because of that, we pursue the estimation of the reduced model for the future corn market conditional on climate information rather than the forecasting of the structural equations corresponding to those explored in section 4.2.
Table 2 summarizes the estimated coefficients of the reduced models implied by the simultaneous equation models estimated in section 4.2. Models I (NDJ) and I (OND) are derived from the parsimonious model IV-1 and use average SSTAs for the November through January (NDJ) and October through December (OND) periods, respectively. Because models IV-2 and IV-3 imply the same set of lagged explanatory variables, they share a common reduced model. Thus, models II (NDJ) and II (OND) are implied by IV-2 and IV-3 for SSTAs from the NDJ and OND periods, respectively. Since models I (NDJ) and I (OND) do not rely on data on the price of soybeans, we were able to expand the data set to include 52 observations (from 1949 to 2000).
Regression summary – forecasting models

p-values in parentheses.
In addition to the lagged SSTAs for the Pacific and Atlantic Oceans, we used log income at year t – 1 (‘lInc1’) and log income difference at t – 1 (‘lIncd1’) as proxies for lagged information on farmers' income. We also use log price of soybeans (models IV-1 and IV-2) at t – 1 (‘lSoy Price lag’) to capture the possible influence of the price of this substitute on the farmers' decisions. These pieces of information are available at the time of planting, months before actual yield and prices are realized.
The results from table 2 suggest that there is little difference between the two sets of models (I and II) in terms of significance of the coefficients. Furthermore, the more parsimonious formulations (models I(NDJ) and I(OND)) rely on a longer time series. We thus focus on the parsimonious models. The coefficients for the climate variables in the yield equation are significant at the 2 per cent level or lower when we use SSTAs for the NDJ trimester. A one standard deviation increase in the average Niño 3 SSTAs during the NDJ trimester (approximately 0.9°C or 1.62°F) contributes to a 23 per cent drop in yield in the following harvesting season. The El Niño effect is already noticeable during the OND trimester, around 6 months before the harvesting season. The influence of the Atlantic Dipole is also clear early on. A one standard deviation increase in the average Atlantic Dipole for the NDJ period contributes to a 11 per cent increase in corn yield in Ceará (impact evaluated at the average value for the NDJ Atlantic Dipole). The contribution of the quadratic term for the Atlantic Dipole to corn yield is already noticeable in the OND trimester. Finally, although our main interest is in predicting corn production we include the results for the estimated equation for prices for completeness. In fact, combined information on the impact of climate on corn yield and prices offers additional insight into the vulnerability of small corn producers to severe climate. A one standard deviation increase in the Niño 3 SSTAs contributes to only a small expected increase in the price of corn (7 per cent) compared to a large expected decrease in yield (23 per cent).Footnote 19 The signs of the coefficients for the climate variables in the price and yield equations are consistent with a competitive equilibrium model, where the supply function shifts due to a movement in the climate variables. We note however, that only the El Niño effect appears as statistically significant at conventional levels in the NDJ and OND periods.
To obtain further insight into the forecasting potential of our analysis, we use a semi-parametric forecasting algorithm to predict corn yield conditional on current climate information. The estimation algorithm is as follows:
(i) We estimate 52 regressions corresponding to model I(NDJ). Each regression omits the information for a different year t in the sample ranging from 1949 to 2000.
(ii) We estimate the conditional mean and quantiles of the distribution of log corn yield using the k-nearest neighbors (k-NN) resampling algorithm.
(iii) We assess the ability of the model to forecast corn yield for each year of the sample, with special emphasis on years of severe droughts.
For each year t in the sample, the algorithm consists of identifying its k nearest neighbors as the k years with the closest values for the explanatory variables of the model (lInc1, lIncd1, lCtl.pr.lag, Niño 3, Dipole and Dipole 2) during the NDJ trimester. These neighbors are calculated from the distances dit from year i to year t, whose corn yield we want to predict. Distance dit is defined as

where xt is the (1 × p) vector of predictors for the year omitted from the parametric regression, xi is a (1 × p) vector of predictors for the ith year from the sample, and Г is a (p × p) diagonal matrix whose elements in the main diagonal are the estimated coefficients for the log yield equation estimated in step (i), and the off-diagonal elements are zero. That is, we calculate the weighted Euclidean distance between the predictor vectors for the years in the sample and the omitted year, where the weights are the yield regression parameters from step (i). Next, we use the distances dit to rank the set of k nearest neighbors for each year of the sample. We then calculate the average and quantiles of the log yield distribution based on the selected k nearest neighbors and compare them to the actual log yield for the corresponding year.
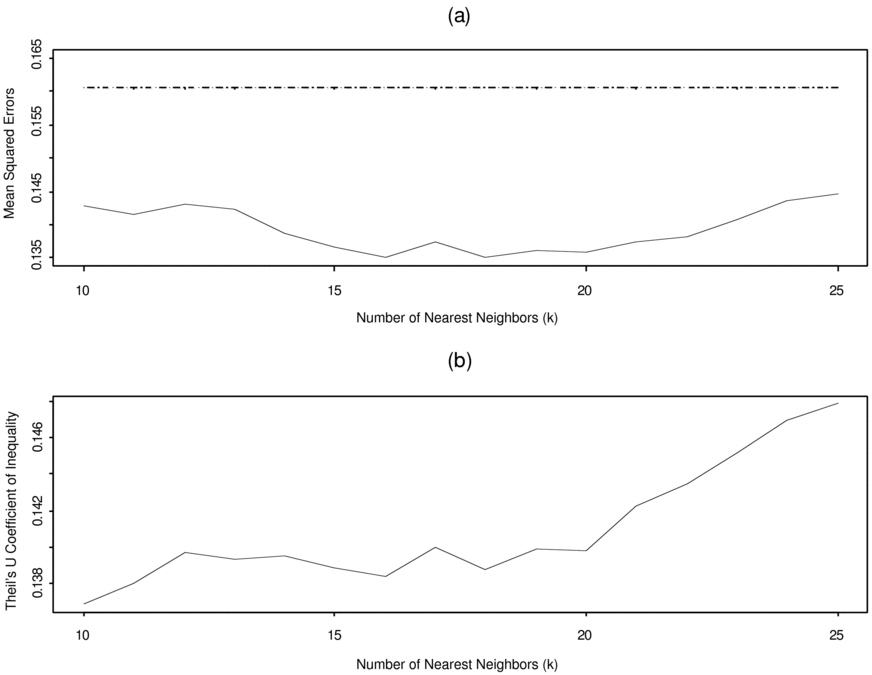
Figures 6 and 7 summarize the results. Figure 6(a) plots the mean squared errors (MSE) for different values of k conditional on climate information (solid line) and contrasts them to the unconditional MSE (dashed line). The MSE for each value of k is computed based on the difference between the predicted average log yield for each year and the actual log yield for the corresponding year. Since the choice of k will determine the conditional average log yield, we calculate a different MSE for each k. The unconditional MSE is based on the difference between the historical average log yield and the realizations for each year. All choices of k shown in the picture result in a lower MSE relative to the unconditional MSE. The values of k corresponding to the lowest MSE are 16 and 18. Between these two values, k = 18 produces the highest correlation between the actual series and the predicted mean.Footnote 20Figure 6(b) plots Theil's U coefficient of inequality. Theil's U ranges from 0 to 1, with 0 indicating perfect forecast and 1 just the opposite. The calculated Theil's U coefficients for different choices of k range from 0.1369 to 0.1478 highlighting the good performance of our forecasting algorithm.
Mean squared error and Theil's U Coefficient for selected k.
Observed and forecasted corn yield.
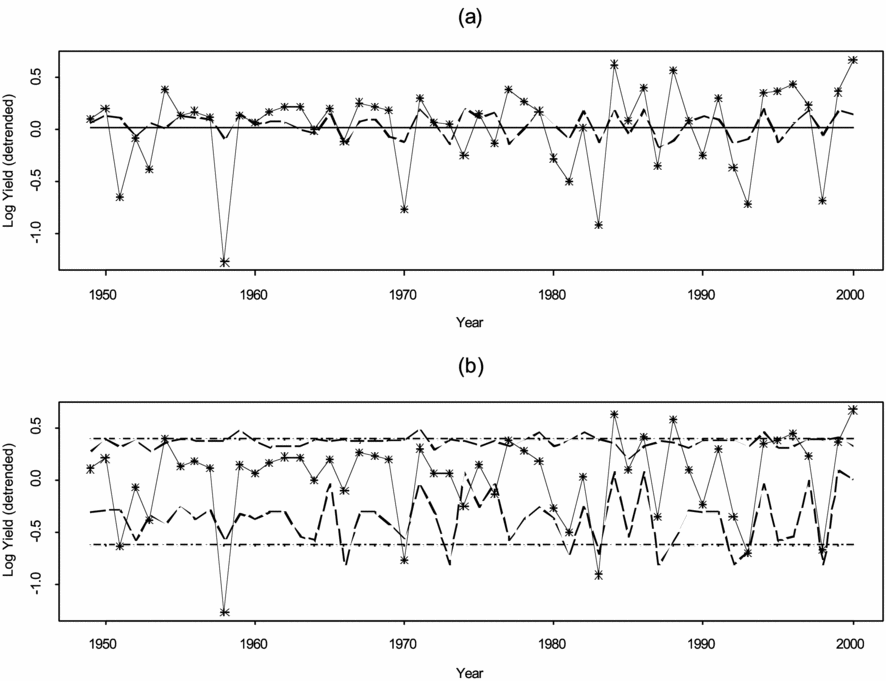
Figures 7(a) and (b) illustrate the performance of the forecasting algorithm when k = 18. Figure 7(a) plots the actual log yield series against the conditional (heavy dashed line) and marginal averages (solid horizontal line). If we define a severe drought to involve a log yield decrease of about 1 standard deviation or more from the expected mean, then the model predicts 8 out of 10 droughts in the series.Footnote 21Figure 7(b) shows the actual series and the conditional (heavy dashed lines) and unconditional (horizontal dashed lines) 0.1 and 0.9 quantiles, thus depicting the conditional and unconditional 80 per cent confidence intervals. A notable feature of this graph is that the correlation between the lowest conditional quantile and the actual series starting in 1980, when droughts seem to have become more frequent, is 0.69.
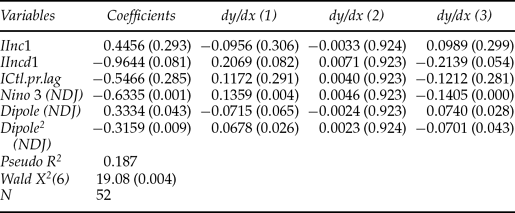
Lastly, we highlight the probabilistic nature of any forecasting exercise and consider information that might be directly valuable to policy makers. To do that we estimate an ordered probit version of the yield equation from model I(NDJ) with the dependent variable, de-trended log corn yield, ordered in three categories: smallest 20 per cent values (10 smallest yields or severe droughts as previously defined), middle 60 per cent values (32 ‘typical yields’), and largest 20 per cent values (10 largest yields). The results appear in table 3. The second column of the table shows the estimated coefficients and their corresponding p-values. The lagged climate variables are all statistically significant at conventional levels. Columns 3 to 5 list the marginal effects for each category of the dependent variable. For example, from the third column, a 1 standard deviation increase in the average Niño 3 SSTs during the November through January trimester (0.9°C) increases the probability of a severe drought by 14 per cent. The marginal effects for the climate variables are statistically significant for extreme outcomes, that is severe decreases in yield as well as large increases in yield, but not for typical yields. In other words, our model suggests that lagged SSTs contain significant information for extreme corn yield outcomes in the subsequent cropping season.
Ordered probit (Y = 1 (low), 2 (medium) and 3 (high corn yield levels))
p-values in parentheses.
Finally we reinforce the warning that climate forecasts (or any probabilistic forecasts) should not be oversold to the public and policy makers. ‘Scientists should label their forecasts as experimental and should include warnings about the potential misuses of a probability based El Niño forecast’ (Glantz, Reference Glantz2001: 117, 118). Often times, due to poor communication between the scientific community and/or biased perception of probabilistic information, decision makers interpret a probabilistic forecast as a categorical statement that a climatic outcome will materialize (Glantz, Reference Glantz2001). This may lead to an uninformed decision process at the policy making level, and the loss of credibility of potentially valuable scientific forecasts in the long run.
5. Concluding remarks
In this paper, we have explored the connection between climate prediction and corn yield in the state of Ceará, Brazil. Corn is a key indicator of socio-economic stress brought about by droughts in the State and in the Brazilian semi-arid region. Because corn production is correlated with inter and intra-government drought-related transfers, and because these transfers are discretionary and usually take place after a drought-driven socio-economic crisis is verified, reliable forecasts of local corn production provide an early foundation for more efficient allocation of drought-relief resources. More specifically, reliable early warnings on the increased probability of crop losses may buy local governments more time to plan and negotiate the appropriation of drought-relief resources, and to help them plan out the distribution of these resources.
We forecast corn yield conditional on climate information (sea surface temperatures of selected regions of the Pacific and Atlantic Oceans) in two steps. We first investigate the link between climate determinants and the local corn market. We then use this information to implement a semi-parametric approach to forecast the expected variation in corn yield and the probability of occurrence of extreme events conditional on climate predictors.
Our results first establish the link between climate and the corn market in Ceará. The importance of the Pacific Ocean many miles away from the Brazilian semi-arid region is remarkable. A 0.6°C (1.08°F) increase in the average SST of the Niño 3 region during the rainy season in Ceará contributes to a 18 per cent decrease in corn yield. The Atlantic Ocean may exert a counterbalancing or reinforcing influence on the local corn market given the Pacific Ocean SSTs.
Our second set of results indicates that we successfully forecast extreme variation in corn yield. More directly relevant to this study, our model predicts 8 out of 10 severe droughts in the period from 1949 to 2000. By classifying yield into three categories (low, medium, and high levels) we verify the good performance of the forecast model in both extreme categories. This not only indicates the ability of the model to predict extreme droughts, but also suggests that an extension to this research could focus on the economic impact of extreme precipitation, especially in the large cities on the coast of the Brazilian Northeast region. These localities could benefit from an early warning system and the ability to prepare for severe storm events.
Using the Southern Oscillation Index (SOI), another measure of the ENSO effect, produces inferior results relative to those relying on Niño 3 SSTs. The choice of a specific measure to explain the teleconnection between the ENSO effect and corn yield increases the chance that we produce a spurious result to be unveiled as a longer time series becomes available in the future. However, there are two important reasons why we do not expect this to be the case. First, the model exhibits good out-of-sample properties as discussed in section 4.3. Second, different El Niños may involve different ocean dynamics and different warming of different regions of the tropical Pacific Ocean.Footnote 22 These specificities might be relevant to the teleconnection between climate and corn in Northeast Brazil, but might be left out if we focus on a summary measure of the ENSO effect such as the SOI.
In summary, we find encouraging evidence that information on SSTs can effectively be used for prediction of socio-economic impacts of severe climate, provided the nature of the forecasts are properly used by policy makers and communicated to stakeholders. The nature of a probabilistic, as opposed to a categorical (dry vs. normal vs. wet) forecast, should be explicitly recognized and well communicated to end users. As other commentators have observed, poor communication between the scientific community and end users has caused costly misunderstandings and undermined the use of potentially valuable climate forecasts. The notion of risk is familiar to most decision-makers and communication of the forecasts presented in this paper should take advantage of this fact by exploring how often the algorithm correctly/incorrectly predicts droughts.
Our analysis for the state of Ceará can be extended to the rest of the Brazilian semi-arid region. It can also be extended beyond droughts and agricultural production. The impacts of climate oscillations around the globe are varied, including, in the case of ENSO, droughts in southeastern Africa, Australia, and Southeast Asia; increased temperatures in India, Northeast and Northwest North America; typhoons in Southeast Asia; and the outbreak of tropical diseases such as malaria. These may result in thin insurance markets in the presence of correlated risks for large areas, increased energy consumption, large expenditures on the mitigation of the effect of catastrophic climatic events, and pressures on national and world prices and economic activity. To the extent that these impacts can be forecasted, defensive actions can be better planned and implemented. This paper demonstrates how these forecasting models could be estimated.



