Introduction
Inequality in incomes and wealth are potential drivers of social unrest and dissatisfaction as well as symptoms of economic systems that do not provide opportunities for every individual to experience upward mobility, motivating the UN to adopt inequality reduction as a goal in its 2030 Agenda for Sustainable Development.Footnote 1 As more countries have undergone modern economic growth, inequality has decreased at the global level but increased within countries. This has made the historical record of inequality in now-developed countries an even more salient topic, to the extent that it may inform the development process for poorer nations today. There has been a renaissance in studies of inequality and its determinants following the work of Piketty (summarized in Piketty and Goldhammer Reference Piketty and Goldhammer2017), including attempts to move beyond a simple identification of the Kuznets curve to understand how changing demographics, urbanization, and institutions drove the observed patterns. Alfani (Reference Alfani, Diebolt and Haupert2019) provides an overview of much of this work,Footnote 2 and Lindert (Reference Lindert2015) elaborates on his critique of Piketty’s theories, while calling for even more data work on the subject, especially work that allows us to look across the entire distribution of incomes or wealth rather than focusing only on top income shares.Footnote 3 This article provides such a contribution to the literature, presenting estimates of housing inequality for one of America’s most important urban centers, Manhattan, for 1880–1910.
Long-run inequality in income, consumption, or wealth is difficult to measure, as the most commonly used sources—estate and tax records—were typically compiled only for a small share of the population, or available infrequently. Roine and Waldenstrom (Reference Roine, Waldenstrom, Atkinson and Bourguignon2015) describes recent contributions to the methodology, which often build on the work of Simon Kuznets, but add many more countries and longer time spans, to develop the picture of trends in inequality. Milanovic et al. (Reference Milanovic, Lindert and Williamson2010) present preindustrial inequality estimates for 28 countries using their approach of building up income measures from social tables, while Lindert and Williamson (Reference Lindert and Williamson2013) elaborate on this approach for the United States.
Most articles focus on income and wealth inequality. A smaller literature measures inequality in consumption outcomes, for example Meyer and Sullivan (Reference Meyer and Sullivan2017). They present evidence on the evolution of the 90/10 differential in US consumption (including housing), compared to pretax and posttax incomes. The trend in consumption inequality since 1960 is not characterized by the upward trend observed for incomes. They argue that consumption is the more accurate measure of inequality, especially for the lower end of the distribution. This consumption trend makes sense for developed countries like the United States because richer people tend to consume more services, whose prices mostly rise over time, compared to consumer goods whose prices have declined with globalization and retail innovations. In a similar vein, Geloso and Lindert (Reference Geloso and Lindert2020) price the different consumption baskets of richer and poorer types to create a more accurate measure of real inequality. They show that this measure rose more slowly than conventionally measured income inequality for the years 1800–1914.
Other recent work on consumption inequality is found in Albouy and Zabek (Reference Albouy and Zabek2016). In contrast to Meyer and Sullivan (Reference Meyer and Sullivan2017), they identified a U-shaped pattern in house price inequality over the twentieth century in the United States, from a peak in 1930 to similar high inequality levels toward the end of the century, with the top 20 percent of houses in terms of value accounting for over half of total value, using Census data. They find that the pattern for rents is less dramatic than that for home prices, which the authors argue may be because there was more regulation of the rental sector by the late twentieth century. One advantage of analyzing our historical period is that there was little intervention in the market, allowing us to identify nongovernmental forces driving trends in rents and rental inequality.
The ratio between land rents and wages have been used to proxy for inequality in history (Roine and Waldenstrom, Reference Roine, Waldenstrom, Atkinson and Bourguignon2015). Wealth inequality studies may also have included housing as one of the assets. But a few studies before Albouy and Zabek (Reference Albouy and Zabek2016) have used housing rents as an inequality measure, almost exclusively using Dutch data. Soltow and van Zanden (Reference Soltow and van Zanden1998) and McCants (Reference McCants2007) estimated Gini coefficients using rents and compared these to inequality measures built on incomes that were mostly drawn from tax and probate data. To obtain rental prices, the most commonly used sources are institutional and tax records (see Clark [Reference Clark2002], Eicholtz et al. [Reference Eicholtz, Straefmans and Theebe2012], and Reference Drelichman and AgudaDrelichman and Gonzalez Aguda [2014] for examples) and newspaper advertisements. Advertisements have been used for American cities by Rees (Reference Rees1961) and Margo (Reference Margo1996), and for Berlin, in Kholodilin (Reference Kholodolin2016).
This article presents new inequality estimates for Manhattan from 1880 to 1910, using a new sample of housing rents drawn from newspaper advertisements. The Gini coefficient for all 9,962 observations shows declines from 1890 onward, while the subsample of 5,719 apartment listings, where most Manhattanites lived, display fairly constant inequality. The section “Inequality” discusses the findings in more detail. Because the observations were geocoded, I also show that inequality within neighborhoods is much greater than between neighborhoods, reflecting perhaps the varied mix of units even within neighborhoods. This article presents estimates for half-decade intervals, but the sample could be expanded further to calculate annual estimates, which may not be possible for income measures.
Existing work on inequality in urban areas or New York in particular is somewhat sparse. Lindert and Williamson (Reference Lindert and Williamson1983: 70) provided some evidence on wage inequality in nineteenth-century New York City, based mostly on the Aldrich Report data. These data suggested that skill premia increased in the antebellum period before plateauing for the remainder of the century. While there is some debate about whether this was the real trend in wage inequality,Footnote 4 it is more generally accepted that wealth inequality increased over this time and housing may have been a driver of that trend, as property made up a large fraction of preindustrial wealth. In Manhattan, wealth inequality may indeed have risen over the nineteenth century, as landownership was concentrated among only a few of the elite, and Atack and Margo (Reference Atack and Margo1998) showed that vacant land values rose up to the 1890s, in step with the growth of population and productivity.
The contribution of this article, then, is to add evidence on consumption to this literature on inequality in historical urban America and to discuss how the changing composition of the sample affected our estimates of inequality trends. Housing rents are readily available at even the subcity level, and going back further in time than information on income and wealth. They offer relatively comprehensive coverage of the population as a whole—every person lived in a residence, while not everybody had a job, paid income taxes, or left a will at death. In historical New York City, most people were renters—9.63 percent of household heads in the city owned real estate, as reported in the 1870 Census (IPUMS 1 percent sample, Ruggles et al. [Reference Ruggles, Alexander, Genadek, Goeken, Schroeder and Sobek2010]) and spent approximately 23.5 percent of their incomes on housing.Footnote 5 Finally, turnover was high, suggesting that focusing on listings of vacant apartments should well represent actual rents paid. I next discuss housing inequality more generally, before presenting the data and discussing the inequality measures constructed using the newspaper dataset. The data section presents a detailed discussion of the influence of the sampling methodology on our inequality estimates, as well as highlighting how measures of housing inequality might compare to those built from income or wealth data. I discuss which subset of the population these estimates are most relevant for, given the audience of the sources used and the coverage they provided in terms of geography and types of housing—the results presented here measure most accurately inequality in housing consumption above the level of tenement-dwellers and below the level of house-owners on the island of Manhattan.
Determinants of Housing Inequality
Attanasio et al. (Reference Attanasio, Berloffa, Blundell and Preston2002) builds a model of how consumption and income inequality are related. They show that permanent income shocks feed through to consumption, while transitory shocks do not tend to do so, and present data for UK cohorts born from the 1930s to 1950s. In our historical New York City setting with incomplete credit markets, income and consumption should have been even more strongly linked because renters tended to be highly mobile and moved whenever they found a better location or a better price, and were similarly responsive to negative income shocks (Scherzer Reference Scherzer1992: 19). Households were likely to have smoothed their consumption of housing in the face of shocks, where this was possible. In practice this might have meant taking in boarders or sending another family member to work when income was low, but given that government safety nets were undeveloped, moving was also a viable option during hard times. These endogenous actions of renters, which are not generally captured in our data that simply records advertised rents of units and rarely mentions subletting or sharing, imply that the inequality measures derived from rentals understate reality because many families consume less than the full unit advertised, assuming that the rent derived from boarders does not fully offset the loss in unit consumption. This type of selection bias is common when trying to use housing rents or prices as a measure of inequality, and may be worse in our period because immigrant neighborhoods adapted so rapidly to the huge inflows—building and extending rear houses, putting more and more boarders and families into each unit and so forth. One approach is to exclude areas such as the immigrant-packed Lower East Side from the analysis because the selection bias problem will be most intense there. Alternatively, one can try to gather other evidence on the prices paid by those groups, as presented in this article. Other measurement issues are discussed in more detail in the section “Rental Prices.”
Rental inequality also relates to supply conditions. The factors influencing supply for 1880–1910 include the opening of new transportation connections including new elevated rail lines and stations and, in 1904, the subway. Regulatory factors were relatively minimal compared to today but did include attempts to improve tenement conditions in the 1901 Tenement House Law. In practice, the law did not limit the dimensions and particulars of new apartment buildings for the middle classes too much but likely did bite in the case of tenements for the poor and may have reduced tenement construction in the early years of the century.
Part of the inequality identified in this article is driven by the fact that richer households consume more or better-quality housing than poorer households. The other major factor is that we expect richer types to reside in more desirable areas, whether that is defined as closeness to business centers and amenities such as parks and transit or distance from disamenities like breweries and stables that emit noxious odors. I discuss in more detail the findings for Manhattan in terms of breaking down inequality into the component across neighborhoods, which might capture locational advantages, and the within-neighborhood component, which is driven more by differences in unit characteristics, in the “Rental Prices” and “Inequality” sections.
Rental Prices
Gray and Bowman (Reference Gray and Bowman2020) provides a thorough introduction of the new housing dataset, including a discussion of the geocoding process and a comparison with the existing evidence on rents from the historical literature.Footnote 6 Here I discuss briefly the composition of the final 9,962-observation sample and the representativeness of the dataset in overall housing consumption. One substantial advantage of rental information from advertisements is the accompanying indicators of size and quality of units, which motivated their use in this article. Location is useful to allow us to measure inequality within and across neighborhoods and it is also interesting to look at the characteristics of housing and try to assess how much of observed inequality is driven by differences in consumption across the distribution.
Rental prices and characteristics were collected from advertisements in five popular newspapers: New York Herald (NYH), New York Sun (NYS), New York Times (NYT), New York World (NYW), and the Brooklyn Daily Eagle (BDE), the last being used in only a few cases. Gray and Bowman (Reference Gray and Bowman2020) investigates further the circulation of these newspapers and finds that they each had substantial readership and were commonly included in household budgets and used as a main source of information about available housing in the city. Gray and Bowman (Reference Gray and Bowman2020) also presents a summary of information collected on the fees charged by each paper, over time, to place an advert. The price declined over time and was substantial enough that it likely did drive some of the selection bias that we observe—that is, it was not worth paying this amount to advertise a sublet of a tenement apartment throughout the period.Footnote 7 Again, selection issues were minimized somewhat by consulting multiple newspapers, as advertising costs did vary and were higher for papers that seemed to target a more elite clientele (NYT and NYH). A minimum of two newspapers was consulted each year from 1880 to 1910, and I kept advertisements for residential properties that listed an actual address and price, with any other characteristics being recorded too. Each address was geocoded so that neighborhood can be identified and geographic characteristics attached.
All four newspapers used for this study included listings for a variety of housing types, including “rooms for let” or “boarders wanted” as well as apartments and houses. In the data collection process, all types were sampled. There was some specialization by newspaper in housing type and location. One-quarter of units advertised in the NYT were houses, while only 5 percent of the NYW sample comprised houses. The share of apartments was fairly similar across all four papers, at about 60 percent, but was lowest for the NYS which had only 48 percent. The NYS yields the largest proportion of rooms with board in the sample. Sampling across multiple newspapers and all these types of housing and location on the island resulted in a dataset that more accurately represents the bulk of Manhattan residents.
There are two interrelated types of representativeness to consider when looking at the rental sample—does it cover well the entire island and does it cover all forms of housing? Figure 1 displays the geographic coverage of the housing dataset and shows that there are few observations in the densely population Lower East Side area, which was packed with tenement buildings. In general, newspapers tended not to advertise, with prices listed, units at the extremes of the rental price distribution. Large, expensive houses are rare in the listings and became rarer over time. This may be because people were less likely to rent houses in Manhattan—the transit expansion was already opening up house buying in outer boroughs at this time, or some established families may still have owned such properties, but they tended not to openly advertise them for rent—some were available but declined to publicly list a price. On the other end of the housing spectrum, many lived in more chaotic, cheap, and changeable conditions. These show up in the rental advertisements as rooms to let, including those in hotels and boarding houses. And, occasionally, cheap apartments listed in tenement buildings. The secondary literature suggests that tenement families commonly took in boarders or had an entire additional family sharing the living space. These arrangements are not captured in the advertisement sample.
Geographic coverage of rental observations.

I conclude that the newspaper sample is most truly representative of the Manhattan apartment market above the tenement class. This is true especially because of the fluid nature of the housing market on the island and given that apartment-dwellers would be less constrained than those lower in the distribution in terms of moving. Advertisements for available units, therefore, are most relevant for that slice of the population, which is why in this article I present inequality estimates for both the full sample and for apartments only, which takes out the house-dwelling and rooms-to-let segments of the population. This issue of lack of data on the tails of the distribution is not unique to the Manhattan rental sample—most samples of rents fail to capture the very rich and very poor. The Lesger rents sample for the Netherlands had this problem.Footnote 8 Alfani and Ryckbosch (Reference Alfani and Ryckbosch2016) further describe the problem in the data they use for Italian and Dutch regions from 1500 to 1800. This suggests that researchers using this data should focus more on changes in inequality over time, rather than taking the levels at any given point in time as fully accurate of actual inequality, given this bias in the variable construction that would likely understate true inequality.
Fortunately, the literature provides some clues as to the price of tenement units. Riis (Reference Riis1997) listed actual rents around 1900 of $6 for a rear tenement and $17 for four front rooms in more modern tenements. Also around the turn of the century, the Charity Organization Society (1900: 3) reported two families living in three rooms and paying $6 on Elizabeth Street. Chapin (Reference Chapin1909) found that a four-room tenement with bathroom on Essex Street cost $18 per month in 1905. For basic lodging houses, the evidence is even more limited. Nightly lodging on Bayard Street cost 5 cents in 1885, while a basement room on Pearl Street cost 10 cents in 1882 (Anbinder Reference Anbinder2001). There exist some estimates of the numbers living in such tenements. Wright (Reference Wright1970) suggests that about 360,000 lived in slum accommodation in New York in 1893. Laidlaw (Reference Laidlaw1932) provides Census estimates of the share of the New York City population that lived in the Lower East Side, which made up the bulk of the tenement district: it fell over time, from 22 percent in 1855, to 12.9 percent in 1905, and 11.4 percent in 1910. Much of this fall may be explained by the expansion of New York City to the outer boroughs—the share of Manhattanites dwelling in slums may have remained at a level closer to 20 percent, but this at least provides a range. The population living south of 14th Street was 768,360 in 1910—this provides some idea of the volume of people for which there is only patchy secondary evidence on their housing prices and consumption. While coverage is not perfect, it compares quite favorably with, say, income tax-based estimates that cover only top income shares.
The evidence thus suggests that, while newspapers had huge circulations in this period and advertised extensively in the apartment market, tenement-dwellers may have relied on less formal networks to rent out space. This is consistent with the extreme overcrowding witnessed by the Lower East Side, the most densely population area on the planet before 1900, as vacancies were extremely rare.
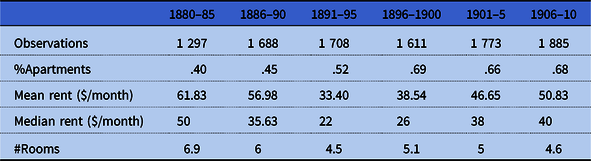
Table 1 provides descriptive statistics across half-decade intervals and shows that in the early years there were more houses and rooms to let advertised, but that apartments became a greater share of the sample over time. Households who could afford to rent whole floors or houses were likely to earn higher incomes than those renting apartments or individual rooms. The “Inequality” section identifies a reduction in inequality in the full newspaper sample over time and this reduction can be partly explained by the reduced prevalence of houses and reduction in number of rooms observed in the average unit. Mean and median rents also see a reduction in the 1890s, a depressed era, which increase again in the 1900s, but do not again reach the levels of the early sample, probably because of the changing sample composition.
Descriptive statistics

Notes: Author’s calculations using newspaper rental data sample described in the section “Rental Prices.”
Inequality
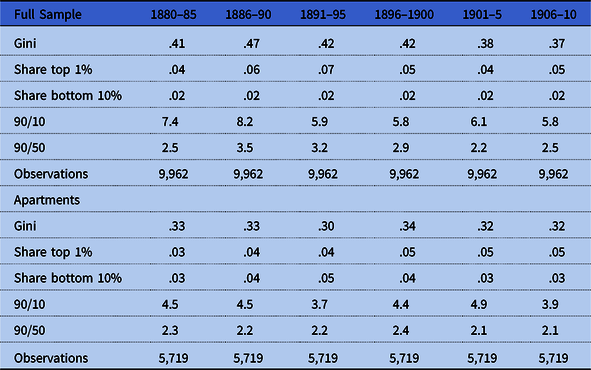
Firstly, in table 2 I take the rental sample at face value and calculate inequality using a variety of measures common in the literature, which gives some idea of the trends over time. What this may miss is that the sample is not drawn to be representative of the population as a whole, as discussed in the preceding text, and so I present results also for apartments only in the second panel, assuming that the newspapers advertised a representative sample for apartments above tenement quality.
Inequality in housing

Notes: Author’s calculations using newspaper rental sample. The share top 1% and share bottom 10% are calculated with total rental value in the denominator. The 90/10 and 90/50 percentiles show the nominal rental ratios for individuals at those parts of the distribution.
Table 2 shows that, for the full sample, there was a reduction in inequality over the 31 years, which is demonstrated most clearly in the Gini and 90/10 percentile ratio measures. The share of the sample rental value that is at the top 1 percent of the distribution and the bottom 10 percent stays remarkably constant over time, and indicate a higher share for the lower end and lower share for the top group compared to, for example, the samples used in McCants (Reference McCants2007) for eighteenth-century Netherlands. It appears to be changes in the 10th–50th percentiles of the distribution that drive the observed reduction in inequality (the Gini tends to be sensitive to this). The panel using only apartment advertisements reveals much less change in consumption inequality over time, with measures except for the 90/10 ratio appearing quite flat and the 90/10 showing a moderate decrease. All the measures display less inequality within this housing type than when looking across all housing types in the first panel.
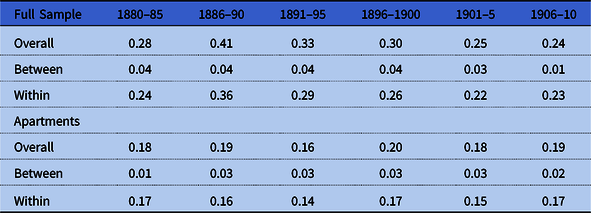
I turn now to using the locations of the units within the dataset to assess how inequality evolved at the neighborhood level. Table 3 presents another measure of inequality commonly used in the broader literature, the Theil index, which can be decomposed into measures of between neighborhood and within-neighborhood inequality. Figure 1 displays the 14 neighborhoods used, which follows a modern shapefile,Footnote 9 aggregated to neighborhood definitions that are sensible for the historical period. The Theil measure also shows more reduction in the full sample than the apartment-only sample. The decomposition highlights that it is really the within-neighborhood variation that drives the overall statistic, indicating that it is factors at a very minute level that drive rental price variations. It is not mainly living in Midtown versus Greenwich Village that explains most of the variation in prices, but unit-specific characteristics, housing type, and proximity to locational advantages. Albouy and Zabek (Reference Albouy and Zabek2016) found a similar pattern, but looking across and within US cities for 1930–2012. This suggests that locational advantages that might be expected to drive rental price variation in the modern period had not yet become of paramount importance, perhaps because of institutional factors such as education not being restricted to neighborhood schools (for New York City in this period). Another way to state the result may be that there was less standardization or homogeneity of housing within neighborhoods historically, and so we find that there was more scope for inequality trends to be driven by differences in unit characteristics than other geographic factors.
Inequality between and within neighborhoods (Theil)

Notes: Author’s calculations using newspaper rental sample. The neighborhoods are 14 historically consistent neighborhoods, aggregated from a modern shapefile’s neighborhood definition.
Conclusion
This article outlined trends in inequality in the most important item in the consumption basket, housing, for the largest city in the United States, New York, for 1880–1910, a period when data that would allow us to compute inequality is generally difficult to find or drawn from a very limited sample of the population, often restricted to the richest 1–15 percent. I found that inequality decreased across all forms of housing consumption but remained fairly constant for the bulk of the population who resided in apartments outside the tenement district. Changes in the typical residence thus drove the overall trend in inequality, which emphasizes the importance of considering carefully how we draw our samples when constructing and understanding measures of inequality. I also showed that inequality measures were dominated by within—rather than between—neighborhood variations in characteristics.
This research may serve as a proof of concept to construct these types of consumption-based inequality estimates for longer time spans and a greater range of cities, which may be especially important before 1930, when the Census begins to have measures (although self-reported) of house values and rents, as used by Albouy and Zabek (Reference Albouy and Zabek2016), although their data only included dwelling characteristics from 1960 on, suggesting that newspaper samples for US cities may be useful right up to 1960. Given that inequality in the United States is thought to have reached a peak in 1929 which it has only recently again become close to, it would certainly be interesting to continue this approach beyond 1910. The arrival of zoning legislation in New York City in 1916 and public housing from 1926 also motivates extending the data collection to analyze their effects.
Acknowledgments
I acknowledge support from an Economic History Association Cole Grant, which facilitated the collection of rental data, and a UC Merced Committee on Research Grant, which facilitated geocoding. Excellent research assistance was provided by Jordan Ahid, Frank Chou, Cecilia Garcia, Roman Guerrero, Justin Holtermann, Sewon Kim, Jason Lee, Alexandra Marr, Charles Martin, Chris Medina, Jacob Miller, Michael Mishkanian, Vanhien Nguyen, Jose Ulloa, Joselyn Ulloa, Daisy Urbina and Victoria Whitford. Carlos Villarreal built the historical GIS maps of Manhattan and geocoded the first round of observations. Richard Wright and Rocco Bowman provided excellent GIS. Thanks to the journal editors for helpful suggestions at each stage of the submission.