


I. Introduction
The board of directors occupies a central role in corporate governance. Its duties include hiring and supervising the executives that run the company, determining their compensation, setting high-level corporate strategy, navigating key corporate transactions (such as mergers and takeovers), and generally representing shareholders’ interests.
It is well established that the number of women directors at public companies has increased substantially over time and that larger companies tend to have more women directors than smaller ones (Knyazeva, Knyazeva, and Naveen (Reference Knyazeva, Knyazeva and Naveen2021), Jiang (Reference Jiang2023)). While this increase long predates the contemporary discussion of diversity and inclusion, commentators often point to State Street’s 2017 “fearless girl” campaign as the beginning of a concerted effort to increase the number of women on corporate boards, particularly at smaller companies. Since then, a number of legal and regulatory interventions have sought to accomplish the same thing, including legislative action in California (Klick (Reference Klick2025)) and regulatory action by the NASDAQ stock exchange.Footnote 1
We study the dynamics of this transition. Using data from BoardEx, we document three sets of patterns. The first represents change. We find that, starting toward the end of the 2010s, women with board experience see a jump in their subsequent board positions relative to their male counterparts. This is consistent with the idea that many companies began to more aggressively seek out female candidates in that period. Women directors are also more likely to be “newcomers” (i.e., to have no previous board experience). Hence, the increase in women directors is coming both through additional positions for existing women directors of public companies and through the addition of women from outside that pool. Two recent diversity initiatives—California Senate Bill 826 and campaigns by the “Big Three” asset managers—especially benefit newcomer women directors.
The second set of patterns—which focus on board committees—speaks to gradual evolution. The rising share of women directors is coupled with a commensurate increase in women serving on or chairing important board committees, with the exception of the executive committee. We also show that women’s committee leadership has increased over time. While relevant experience (measured either as a committee chair or tenure as a member) benefits women less than men in the early part of our sample, this difference has decreased substantially over time.
The third set of patterns represents continuity. Average board size has remained reasonably stable over the last nine decades (Holderness, Kroszner, and Sheehan (Reference Holderness, Kroszner and Sheehan1999), Graham, Kim, and Leary (Reference Graham, Kim and Leary2020)), potentially reflecting both the stickiness of the company characteristics that systematically determine board size and the stability of company-specific idiosyncratic factors (Boone, Field, Karpoff, and Raheja (Reference Boone, Field, Karpoff and Raheja2007)). A company can add women to its board in two ways: by expanding the board or by replacing existing male directors with women. While we find evidence of both, the increase in board size is transitory and disappears quickly. The addition of women, therefore, has largely occurred through replacement. Replacement can occur either through natural attrition (retirement or ordinary board refreshment) or by the removal of men who would otherwise have stayed on as directors. We find no evidence of a decline in the average tenure of departing male directors, suggesting that the former is the norm.
This third set of patterns highlights a tradeoff in board construction: a larger board may benefit from more diversity, but size may also come with costs. It also suggests that companies tend not to remove incumbent directors prematurely to make room for new candidates. Last, our results point to a second reason why efforts to change board composition are likely to be gradual: not only must companies identify new candidates, they may also need to wait for a seat to open up (or be on the verge of opening up) through retirement or the standard board refreshment process.
Our work contributes to two strands of the literature. We add to the literature on board diversity (Knyazeva et al. (Reference Knyazeva, Knyazeva and Naveen2021)). A growing literature examines the causes (Hillman, Shropshire, and Cannella Jr. (Reference Hillman, Shropshire and Cannella2007), Giannetti and Wang (Reference Giannetti and Wang2023)) and consequences (Adams and Ferreira (Reference Adams and Ferreira2009), Kim and Starks (Reference Kim and Starks2016), Ferreira, Ginglinger, Laguna, and Skalli (Reference Ferreira, Ginglinger, Laguna and Skalli2017), Bernile, Bhagwat, and Yonker (Reference Bernile, Bhagwat and Yonker2018), Hwang, Shivdasani, and Simintzi (Reference Hwang, Shivdasani and Simintzi2018), Greene, Intintoli, and Kahle (Reference Greene, Intintoli and Kahle2020), Bakke, Field, Mahmudi, and Virani (Reference Bakke, Field, Mahmudi and Virani2021), Gertsberg, Mollerstrom, and Pagel (Reference Gertsberg, Mollerstrom and Pagel2021), Kuzmina and Melentyeva (Reference Kuzmina and Melentyeva2021), and Maghin (Reference Maghin2022)) of greater board diversity, using a variety of settings and identification strategies. Greene, Intintoli, and Kahle (Reference Greene, Intintoli and Kahle2023) show that women appointed by firms in response to a diversity initiative (California SB 826) are not underqualified relative to other directors and that the market response to the two groups of directors is the same. Their results challenge the findings of Boyallian, Dasgupta, and Homroy (Reference Boyallian, Dasgupta and Homroy2020), who argue that recruiting first-time women directors is particularly costly, suggesting supply frictions in the director labor market.
Our contribution is twofold. First, we use descriptive evidence on the U.S. director labor market for over three decades to show that over time, firms become significantly more likely to add women to their boards who had previous experience at smaller firms, or who had no previous director experience. Smaller firms become especially likely to add women directors who have no director experience. Second, we exploit two quasi-natural experiments—Big Three institutional ownership and California SB 826—and find that both benefit women without previous director experience.
Our results also advance the literature on board size and structure (Lipton and Lorsch (Reference Lipton and Lorsch1992), Jensen (Reference Jensen1993), John and Senbet (Reference John and Senbet1998), Raheja (Reference Raheja2005), and Boone et al. (Reference Boone, Field, Karpoff and Raheja2007)). A larger board can allow for more diversity of both biography and expertise (Fos, Jiang, and Nie (Reference Fos, Jiang and Nie2024)). However, shareholders react positively (negatively) to large reductions (expansions) in board size (Yermack (Reference Yermack1996)), suggesting that a larger board can be value-destroying (Gertner and Kaplan (Reference Gertner and Kaplan1996), Jenter, Schmid, and Urban (Reference Jenter, Schmid and Urban2023)). We shed new light on the interaction between board size, board composition—notably, the percentage of women—and committee structure.
We make three contributions to this literature. First, we show that over time, especially after 2017, women are more likely to join, or even lead, influential board committees. Second, Field, Souther, and Yore (Reference Field, Souther and Yore2020) show that qualifications are less predictive of selection as committee chair for women than for men. Our results indicate that this gap between the value of women’s and men’s qualifications shrinks (and, in some cases, even disappears) during 2018–2022. Third, we show how firms balance the desire to add more women to their boards with preferences to remain at their optimal board size. Absent a preference for a particular board size, firms could add any number of new directors in response to internal or external pressures. In contrast, a strong preference for an optimal board size would lead to a swift reversion to the optimum. Our results are consistent with the latter pattern, suggesting that even as preferences for board diversity change, firms adhere to what they believe is an optimal board size. Conceptually, our analysis of board size is akin to the literature on optimal capital structure and the speed of adjustment toward a target leverage ratio (Fischer, Heinkel, and Zechner (Reference Fischer, Heinkel and Zechner1989), Leary and Roberts (Reference Leary and Roberts2005), and Flannery and Rangan (Reference Flannery and Rangan2006)).
Our findings present an interesting contrast with those in Linck, Netter, and Yang (Reference Linck, Netter and Yang2009), which studies changes on corporate boards as a response to the Sarbanes-Oxley Act of 2002. They find that companies responded to this shock to both the demand for independent directors and director workload at public companies with a modest but persistent increase in board size. In contrast, we study a period during which demand for women directors increases substantially with no concomitant increase in board workload and find only a transitory increase in board size.
II. Research Questions
The focus of our article is the construction and evolution of corporate boards, amid shifting shareholder preferences for board diversity. First, we study where firms find women directors. Firms can add new board members who have experience as independent directors of similar-sized firms, at smaller firms (only), or no such experience at all. We examine how the previous experience of newly appointed women independent directors changes over time. We extend this analysis by exploring the committee assignments of women compared to men.
Second, we study how women directors are added to boards, shedding light on how companies and their shareholders weigh the preference for women directors against the costs of a larger board. Firms can add women directors by increasing the size of the board—temporarily or permanently—or by replacing incumbent board members when their terms end, leading to no change in board size. To understand how firms navigate this tradeoff, we first analyze how board size has changed over the last three decades, particularly as the percentage of women directors increased. Then, we look at how board size changes around the addition of women directors. Last, if firms replace male directors with women, men may be leaving prematurely, before their term was intended to end. To examine this possibility, we study changes in the average tenure of departing male directors when a woman is added.
III. Data Sources and Variable Construction
We obtain data on director biographical information (gender and age), director positions (including tenure), board composition, and committee assignments from BoardEx. We focus on U.S. firms for 1990–2022. We use data on share prices and the number of shares outstanding from CRSP to calculate equity market capitalization, which is our proxy for size. Accounting data are from the CRSP/Compustat Merged Database. Data on classified boards and director attendance are from Institutional Shareholder Services (ISS), which focuses on S&P 500 index firms, yielding a narrower cross section than BoardEx. We link BoardEx and CRSP in three steps. First, we use the BoardEx-CRSP linking file from Wharton Research Data Services (WRDS). We perform a secondary merge using CUSIP and year. Last, we use fuzzy matching for the remaining firms and manually inspect matches with scores below 80%. We use a similar three-step process to match directors between BoardEx and ISS.Footnote 2
We separate firms into four size groups for the empirical analyses. The largest group (mega-cap firms) consists of firms ranked 1–50 by size in a given year, where 1 is the largest firm by market capitalization that year. The second largest group (large-cap firms) contains firms ranked 51–500. The remaining two groups are firms ranked 501–1000 (mid-cap firms) and those ranked 1001 and below (small-cap firms). For individual director-level analyses, an individual’s size group in a given year is based on the size of the largest company that the individual served as a director of that year. For firm-level analyses, a firm’s size group is based on firm size that year.
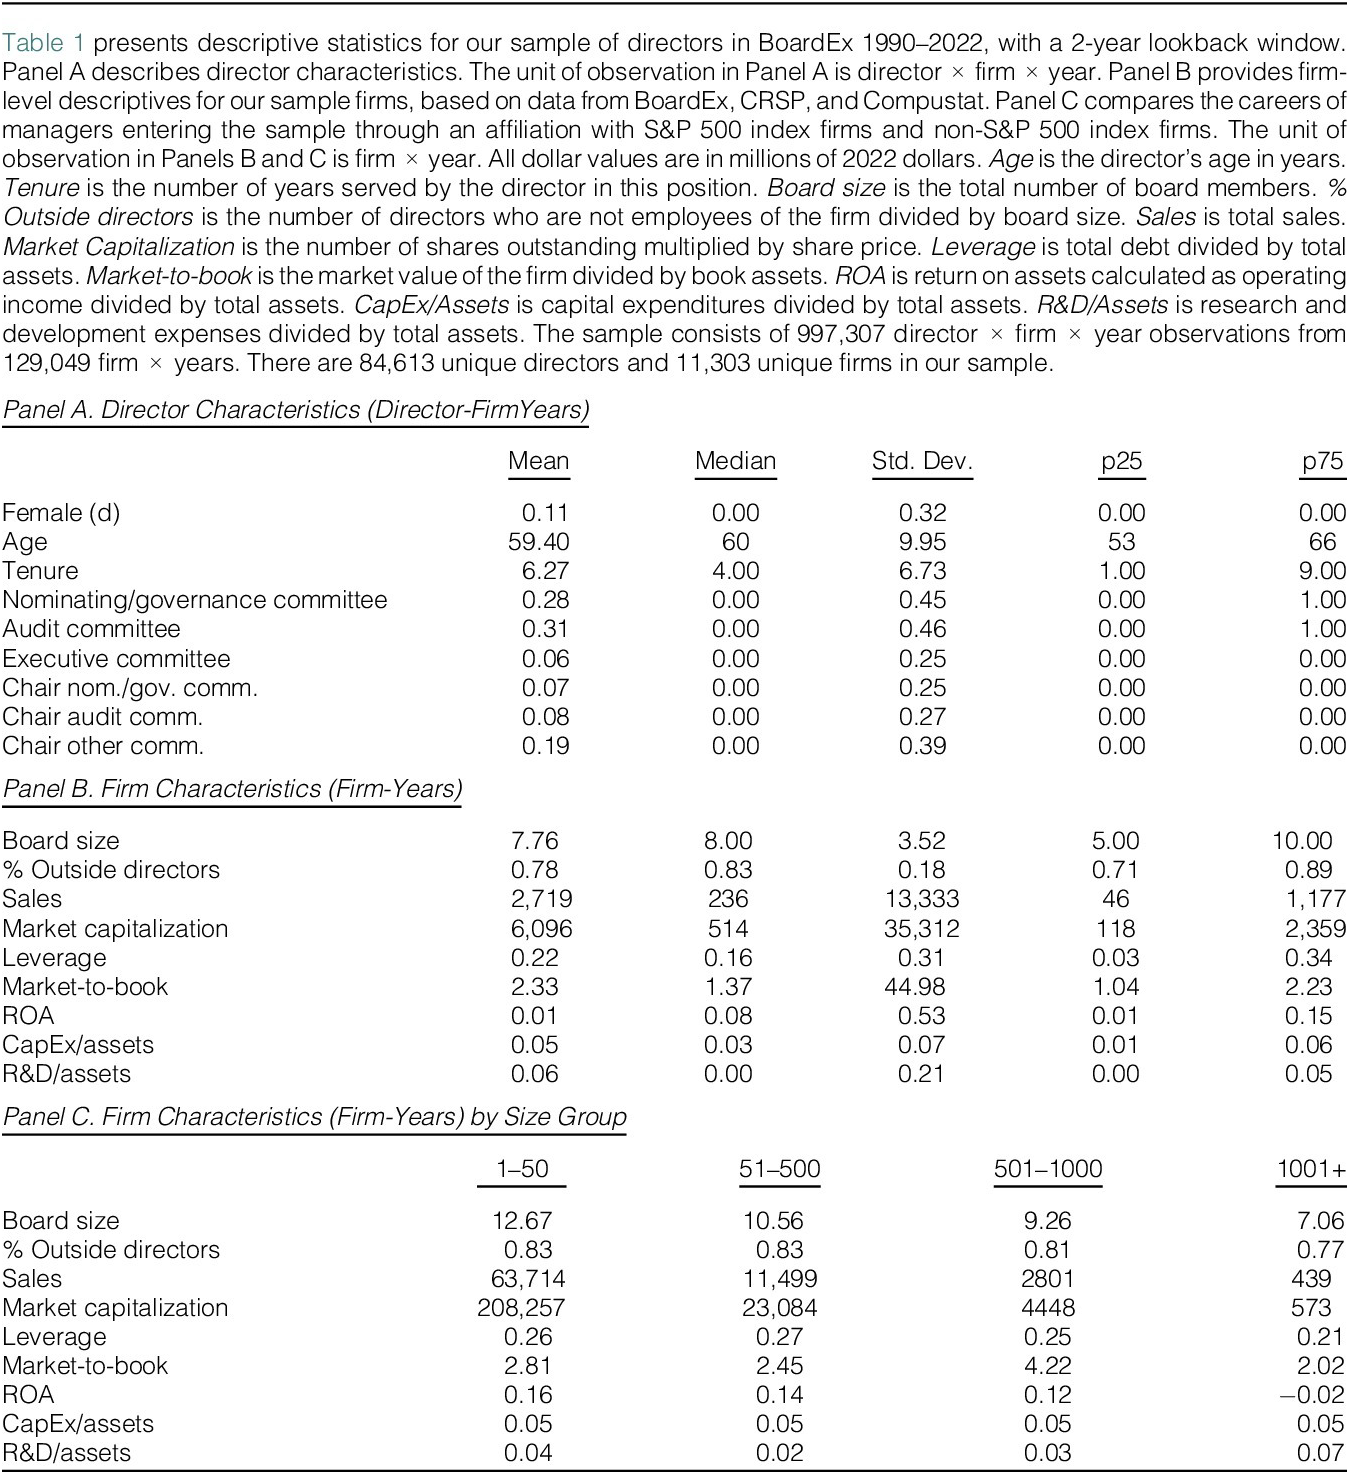
Table 1 describes our sample. Panel A summarizes director characteristics for each director-firm-year observation in our sample. Eleven percent of our sample directors are women, falling between the 9% value in Adams and Ferreira (Reference Adams and Ferreira2009) for 1996–2006 and the 15%–16% mark in Fedaseyeu, Linck, and Wagner (Reference Fedaseyeu, Linck and Wagner2018) and Field et al. (Reference Field, Souther and Yore2020) for 2006–2010 and 2006–2017, respectively. The average director in our sample is aged 59 and has served 6 years in their position. Roughly 30% of independent directors sit on each of the nominating or governance committee (the “Nom/Gov” committee) and the audit committee, and 6% sit on the executive committee. Seven (eight) percent chair the nom/gov (audit) committee, while 19% chair another committee.

TABLE 1 Long description
The table is divided into three panels.
Panel A, Director Characteristics (Director-Firm Years), includes columns for Mean, Median, Standard Deviation, p 25, and p 75. Key rows include:
* Female (d): Mean 0.11, Median 0.00.
* Age: Mean 59.40, Median 60, Standard Deviation 9.95.
* Tenure: Mean 6.27, Median 4.00.
* Committee participation: Nominating/governance (Mean 0.28), Audit (Mean 0.31), and Executive (Mean 0.06).
Panel B, Firm Characteristics (Firm-Years), uses the same statistical columns. Key rows include:
* Board size: Mean 7.76, Median 8.00.
* % Outside directors: Mean 0.78, Median 0.83.
* Sales: Mean 2,719, Median 236.
* Market capitalization: Mean 6,096, Median 514.
* Leverage: Mean 0.22.
* R & D / Assets: Mean 0.06.
Panel C, Firm Characteristics by Size Group, compares four groups: 1-50, 51-500, 501-1000, and 1001+. Key trends show:
* Board size decreases as the size group index increases, from 12.67 in the 1-50 group to 7.06 in the 1001+ group.
* Sales and Market capitalization also decrease significantly across these groups.
* R O A (Return on Assets) is positive for the first three groups (0.16, 0.14, 0.12) but negative for the 1001+ group (-0.02).
Panel B of Table 1 describes our sample of firms. The average (median) board has 7.76 (8) members and 78% independent directors. The latter matches the numbers in Fedaseyeu et al. (Reference Fedaseyeu, Linck and Wagner2018) and Field et al. (Reference Field, Souther and Yore2020) very closely. Our sample characteristics are similar to those in previous work (Adams and Ferreira (Reference Adams and Ferreira2009), Fedaseyeu et al. (Reference Fedaseyeu, Linck and Wagner2018), Field et al. (Reference Field, Souther and Yore2020), Cziraki and Robertson (Reference Cziraki and Robertson2021), and Jiang (Reference Jiang2023)), with slightly more coverage of small listed firms (Bogan, Potemkina, and Yonker (Reference Bogan, Potemkina and Yonker2021)). Panel C of Table 1 breaks down sample averages by firm size groups.
IV. Results
A. Change: New Appointments
We first examine whether women receive more new independent directorships than men, conditional on having similar experience. This analysis is similar in spirit to Field et al. (Reference Field, Souther and Yore2020), with one structural difference. Because firms can reach outside the set of individuals who are already directors at other companies, we separately analyze two potential pools that new directors may come from. First, we study the appointments of new directors with experience at other firms. Second, we examine the addition of “newcomer” directors—those with no previous board experience.
In our first test, we proxy for experience using the size rank of the largest company on which the individual serves as a director (measured by equity market capitalization) in a given year. We then measure the number of independent director appointments the individual has 2 years later. Accordingly, the unit of observation is director
$ \times $
 year. We focus attention on independent director positions because executive positions—which involve working as a top executive at the company—typically involve a more complex search and selection process.Footnote
3 We control for the number of current positions, director age fixed effects, and whether the individual is currently an executive of a public company, as that may affect the amount of time she has to take on additional roles.Footnote
4 The regression model is, for each year
$ t $
 ,

where
$ {NumberPositions}_{i,t} $
 is the number of independent director positions individual
$ i $
 has in year
$ t $
 ,
$ {Female}_i $
 is an indicator variable equal to 1 if individual
$ i $
 is female.
$ {\Phi}_{i,t-2} $
 is a vector of fixed effects for individual
$ i $
 in year
$ t-2 $
 , and
$ {\varepsilon}_{i,t} $
 is the error term. The fixed effects are individual
$ i $
 ’s age in year
$ t-2 $
 and an indicator variable equal to 1 if the individual is an executive in year
$ t-2 $
 . To study changes over time, we estimate this regression each year. Throughout our analysis, we use a Bonferroni correction to account for multiple hypothesis testing.
Figure 1 plots the coefficient of the
$ {Female}_i $
 indicator,
$ \delta $
 . Conditional on experience, women receive more new independent director positions than men, but only in the past few years; prior to that, there was no difference between men and women. With the exception of the first—representing women with experience at one of the 50 largest companies in the relevant year—each of the sub-figures shows a distinct upward trend toward the end of the sample period.Footnote
5 The upward trend is consistent across the remaining three sub-figures. Prior to about 2018 (corresponding to experience obtained in 2016), there was no statistically significant difference between the future career prospects of men and women with experience outside the 50 largest companies.Footnote
6
In Figure 1, the vertical axis represents the point estimate on the female indicator variable from cross-sectional OLS regressions using data from the year indicated on the x-axis for individuals in the indicated size category (1 to 50, 51 to 500, 501 to 1000, and 1001+). A director is assigned to the size rank of the largest company she is a director of in year
$ t-2 $
 , where size is measured by equity market capitalization. The unit of observation is the individual director in the indicated year. The regression model is, for each year
$ t $
 ,

where
$ {NumberPositions}_{i,t} $
 is the number of independent director positions individual
$ i $
 has in year
$ t $
 ,
$ {Female}_i $
 and is an indicator variable equal to 1 if individual
$ i $
 is female. The coefficient on this variable,
$ \delta $
 , is what we plot.
$ {\Phi}_{i,t-2} $
 is a vector of fixed effects for individual
$ i $
 in year
$ t-2 $
 , and
$ {\varepsilon}_{i,t} $
 is the error term. The fixed effects are individual
$ i $
 ’s age in year
$ t-2 $
 and an indicator variable equal to 1 if the individual is an executive in year
$ t-2 $
 . Error bars represent 95% confidence intervals around the point estimate, calculated using robust standard errors and a Bonferroni adjustment to account for the fact that we are displaying 33 different estimates (one for each year between 1990 and 2022). Confidence intervals are truncated at −0.3 and 0.3.

FIGURE 1 Long description
A multi-panel figure containing four line graphs, each representing a different company size category based on equity market capitalization. All graphs share a common x-axis representing years from 1990 to 2022 and a common y-axis representing the point estimate of the female indicator variable ranging from -0.3 to 0.3, with a dashed horizontal line at 0.
* Top-Left Panel (50 Largest Companies): The red line shows high volatility, fluctuating between -0.2 and 0.2. It features deep troughs around 1997 and 2000, followed by a recovery and a peak near 0.2 around 2020. Vertical light blue error bars are wide throughout the period.
* Top-Right Panel (51 to 500): The red line is more stable, hovering near 0 until 2002, where it peaks at approximately 0.15. It then stabilizes between 0 and 0.1 before showing a steady upward trend from 2015 to 2022, ending near 0.1.
* Bottom-Left Panel (501 to 1000): The data begins slightly below 0 in 1990, rises to fluctuate around the 0.05 level for most of the duration, and shows a final increase toward 0.15 in the late 2010s.
* Bottom-Right Panel (1001 and Smaller): This panel shows the least volatility. The red line starts near 0, remains very close to the zero line with minor fluctuations until 2015, after which it trends upward to end at approximately 0.1 in 2022. The error bars in this panel are noticeably shorter than in the ‘50 Largest Companies’ panel.
Around 2018, this changed markedly.Footnote 7 The magnitudes of these differences are both meaningful and strikingly consistent. Women with experience at small-cap companies in 2020 obtained, on average, 0.1 additional board seats (or, alternatively, a 10% greater chance of an additional board seat) in 2022 compared to their male colleagues. The mean (median) number of board seats in 2022 in the regression sample is 1.01 (1), with a standard deviation of 0.65. The point estimates for women with experience at mid- and large-cap companies are similar: 0.11 and 0.12.Footnote 8
When seeking out new directors, many companies prefer candidates who already have board experience (Cziraki and Robertson (Reference Cziraki and Robertson2021)). They might be particularly aggressive in recruiting women with board experience if they feel pressure to diversify their boards relatively quickly (Bakke et al. (Reference Bakke, Field, Mahmudi and Virani2021), Kuzmina and Melentyeva (Reference Kuzmina and Melentyeva2021), and Maghin (Reference Maghin2022)), as it is easy to identify directors of other public companies. This might explain the differences we observe between men and women.
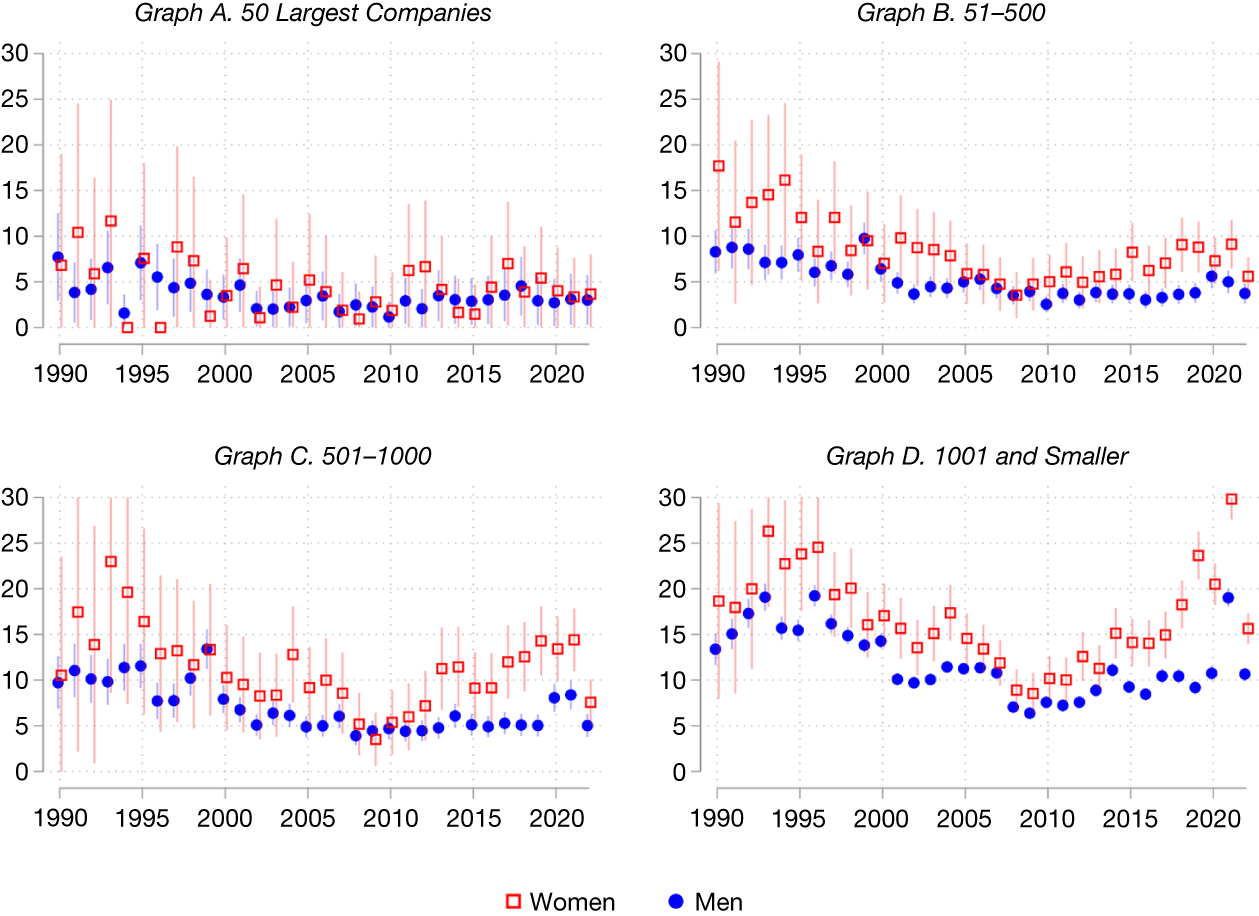
The increase in future board positions for experienced women directors does not account for the entire increase in the number of women directors. Outside the very largest companies, we find that women directors are significantly more likely to be newcomers to the boardroom than their male colleagues. Figure 2 plots, for each year, the average percentage of men and women directors with no previous director experience at any of the companies in our sample. Outside the very largest companies, we find that the percentage of newcomers is substantially higher among women than men.Footnote 9 While this is not an entirely new phenomenon (in contrast to the results in Figure 1, it is particularly pronounced in the last few years, and particularly at smaller companies.Footnote 10
Figure 2 plots the average percentage of men (indicated with blue circles) and women (indicated with red squares) directors with no previous board experience per year. Companies are divided into four groups by equity market capitalization in the year in question, where 1 is the largest company. Error bars represent 95% confidence intervals around the estimates, calculated using a Bonferroni adjustment to account for the fact that we are displaying 33 different estimates (one for each year between 1990 and 2022). Confidence intervals are truncated at 0 and 30.

FIGURE 2 Long description
A four-panel set of line graphs. All panels share a common x-axis representing years from 1990 to 2022 and a y-axis representing the percentage from 0 to 30. Data for women is shown with red squares and data for men with blue circles. Vertical error bars indicate 95 percent confidence intervals.
* Top-left panel (50 Largest Companies): Both genders fluctuate between 0 and 10 percent. The trends are relatively stable with high overlap in confidence intervals.
* Top-right panel (51 to 500): Women start higher at nearly 20 percent in 1990, trending downward to meet men at approximately 5 percent by 2010, before both slightly rise toward 2022.
* Bottom-left panel (501 to 1000): Women show a higher initial percentage (around 10 to 25 percent) compared to men (around 10 percent). Both groups decline until 2010, after which women’s percentages rise more sharply than men’s.
* Bottom-right panel (1001 and Smaller): This panel shows the highest percentages. Women fluctuate between 15 and 30 percent, while men fluctuate between 10 and 20 percent. A notable divergence occurs after 2015, where the percentage for women increases significantly while men remain relatively flat.
A legend at the bottom center identifies the red square as Women and the blue circle as Men.
Overall, these results indicate that companies have considered a wider range of candidates when adding women—but not men—directors. These patterns are consistent with companies coming under intense pressure to add women to their boards beginning in the mid-2010s.
B. Gradual Evolution: Committee Membership
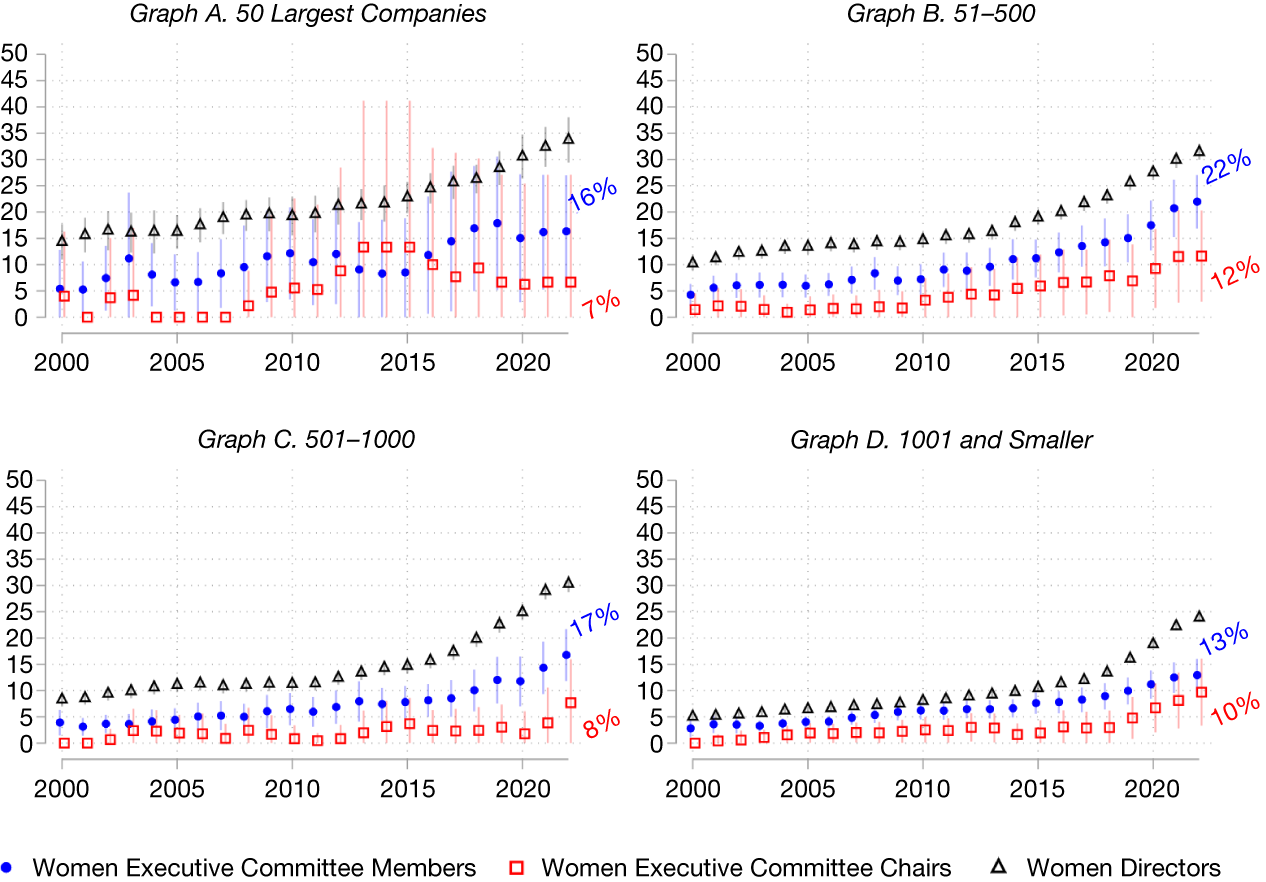
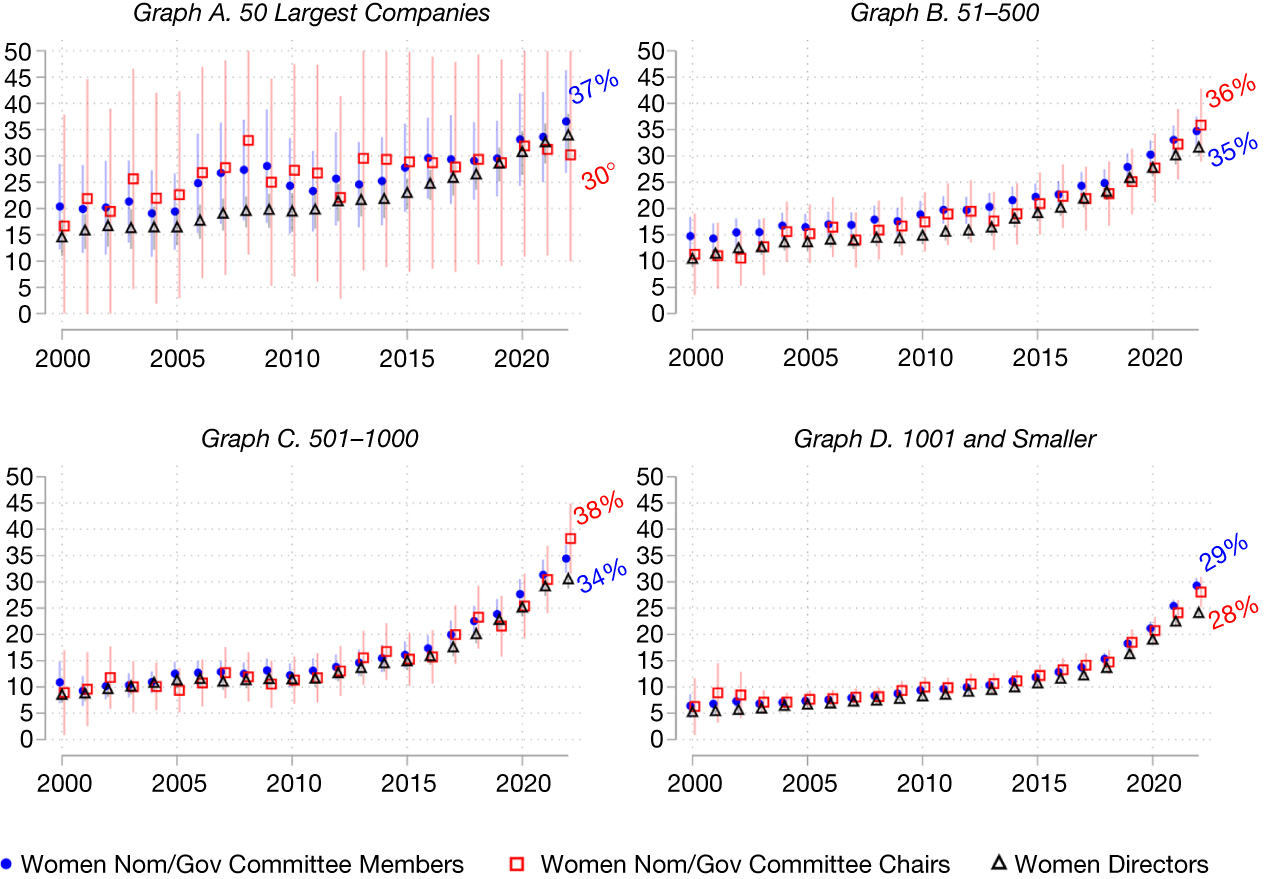
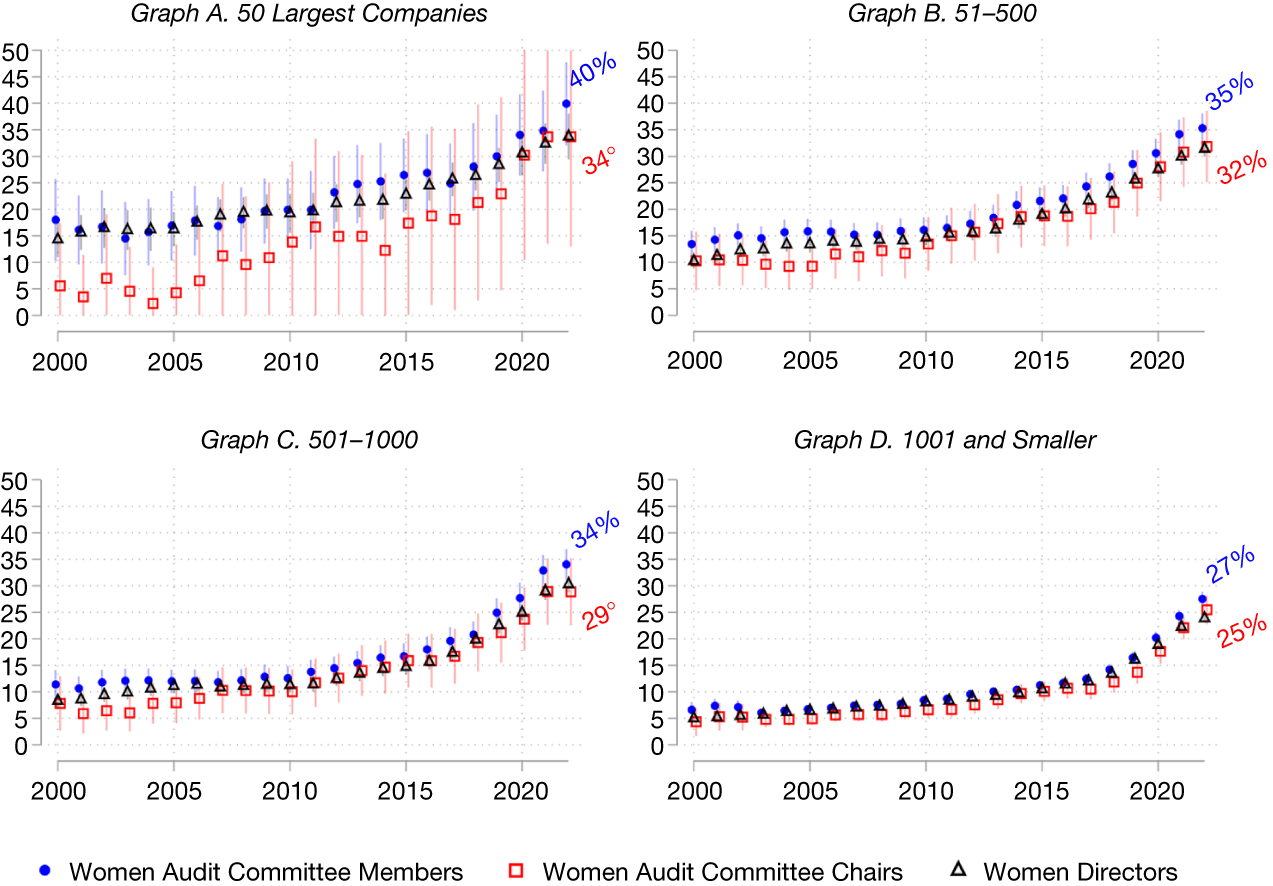
Even if women are elected to boards, their influence may be limited if they do not sit on the most important board committees (Nili (Reference Nili2019), Field et al. (Reference Field, Souther and Yore2020)). Figures 3–5 show women’s representation on the three most influential committees: the executive, the nominating/governance, and the audit committee. Figure 3 shows that the percentage of women serving on or chairing the executive committee increased much less than the percentage of women on boards. In contrast, Figures 4 and 5 show the percentage of women serving on and chairing the nom/gov and the audit committees increased more or less in lockstep with the percentage of women directors.
Figure 3 plots the average percentage of women directors on the board’s executive committee (indicated with blue circles), the average percentage of women executive committee chairs (indicated with red squares), and the average percentage of women on boards (indicated with black triangles) per year. Companies are divided into four groups by equity market capitalization in the year in question, where 1 is the largest company. Error bars represent 95% confidence intervals around the estimates, calculated using a Bonferroni adjustment to account for the fact that we are displaying 23 different estimates (one for each year between 1990 and 2022). Confidence intervals are truncated from below at 0. The mean values for 2022 are provided in the figure.

FIGURE 3 Long description
A four-panel line graph displays data for company size groups: 50 Largest Companies, 51 to 500, 501 to 1000, and 1001 and Smaller. Each panel uses an x-axis for years 2000 to 2022 and a y-axis for percentage from 0 to 50.
Data series in all panels:
* Women Directors: Black triangles showing a steady upward trend.
* Women Executive Committee Members: Blue circles with vertical error bars, showing a general increase but remaining below the total percentage of women directors.
* Women Executive Committee Chairs: Red squares with vertical error bars, representing the lowest percentage of the three groups.
Specific 2022 values by panel:
* 50 Largest Companies: Women Executive Committee Members at 16 percent and Chairs at 7 percent. Total women directors are approximately 34 percent.
* 51 to 500: Women Executive Committee Members at 22 percent and Chairs at 12 percent. Total women directors are approximately 32 percent.
* 501 to 1000: Women Executive Committee Members at 17 percent and Chairs at 8 percent. Total women directors are approximately 30 percent.
* 1001 and Smaller: Women Executive Committee Members at 13 percent and Chairs at 10 percent. Total women directors are approximately 24 percent.
Across all groups, the percentage of women on boards (black triangles) consistently exceeds their representation on executive committees (blue circles) and as committee chairs (red squares).
Figure 4 plots the average percentage of women directors on the board’s nominating or governance committee (indicated with blue circles), the average percentage of women nominating or governance committee chairs (indicated with red squares), and the average percentage of women on boards (indicated with black triangles) per year. Companies are divided into four groups by equity market capitalization in the year in question, where 1 is the largest company. Error bars represent 95% confidence intervals around the estimates, calculated using a Bonferroni adjustment to account for the fact that we are displaying 23 different estimates (one for each year between 1990 and 2022). Confidence intervals are truncated at 0 and 50. The mean values for 2022 are provided in the figure.

FIGURE 4 Long description
A four-panel line graph. Each panel shares a common Y axis representing percentage from 0 to 50 and an X axis representing years from 2000 to 2022. Data series include blue circles for Women Nom/Gov Committee Members, red squares for Women Nom/Gov Committee Chairs, and black triangles for Women Directors. All panels show a general upward trend.
* Top-Left Panel (50 Largest Companies): Shows the highest initial values and significant volatility. In 2022, committee members reached 37 percent and chairs reached 30 percent.
* Top-Right Panel (51 to 500): Shows a steady linear increase. In 2022, committee chairs reached 36 percent and committee members reached 35 percent.
* Bottom-Left Panel (501 to 1000): Shows an accelerated increase after 2015. In 2022, committee chairs reached 38 percent and committee members reached 34 percent.
* Bottom-Right Panel (1001 and Smaller): Shows the lowest starting values near 5 percent with a sharp rise after 2018. In 2022, committee members reached 29 percent and chairs reached 28 percent.
Vertical error bars indicate 95 percent confidence intervals for each data point.
Figure 5 plots the average percentage of women directors on the board’s audit committee (indicated with blue circles), the average percentage of women audit committee chairs (indicated with red squares), and the average percentage of women on boards (indicated with black triangles) per year. Companies are divided into four groups by equity market capitalization in the year in question, where 1 is the largest company. Error bars represent 95% confidence intervals around the estimates, calculated using a Bonferroni adjustment to account for the fact that we are displaying 23 different estimates (one for each year between 1990 and 2022). Confidence intervals are truncated at 0 and 50. The mean values for 2022 are provided in the figure.

FIGURE 5 Long description
A four-panel line graph. All panels share an X axis representing years from 2000 to 2022 and a Y axis representing percentage from 0 to 50. A legend at the bottom identifies blue circles as Women Audit Committee Members, red squares as Women Audit Committee Chairs, and black triangles as Women Directors. Vertical error bars indicate 95 percent confidence intervals.
* Top-Left Panel (50 Largest Companies): Shows a steady increase. In 2022, Women Audit Committee Members reached 40 percent and Women Audit Committee Chairs reached 34 percent.
* Top-Right Panel (51 to 500): Shows an upward trend starting around 2010. In 2022, Women Audit Committee Members reached 35 percent and Women Audit Committee Chairs reached 32 percent.
* Bottom-Left Panel (501 to 1000): Shows a sharp increase after 2015. In 2022, Women Audit Committee Members reached 34 percent and Women Audit Committee Chairs reached 29 percent.
* Bottom-Right Panel (1001 and Smaller): Shows the lowest overall percentages but a steep rise after 2018. In 2022, Women Audit Committee Members reached 27 percent and Women Audit Committee Chairs reached 25 percent.
Across all panels, the percentage of Women Directors (black triangles) generally tracks closely between the audit committee member and chair percentages.
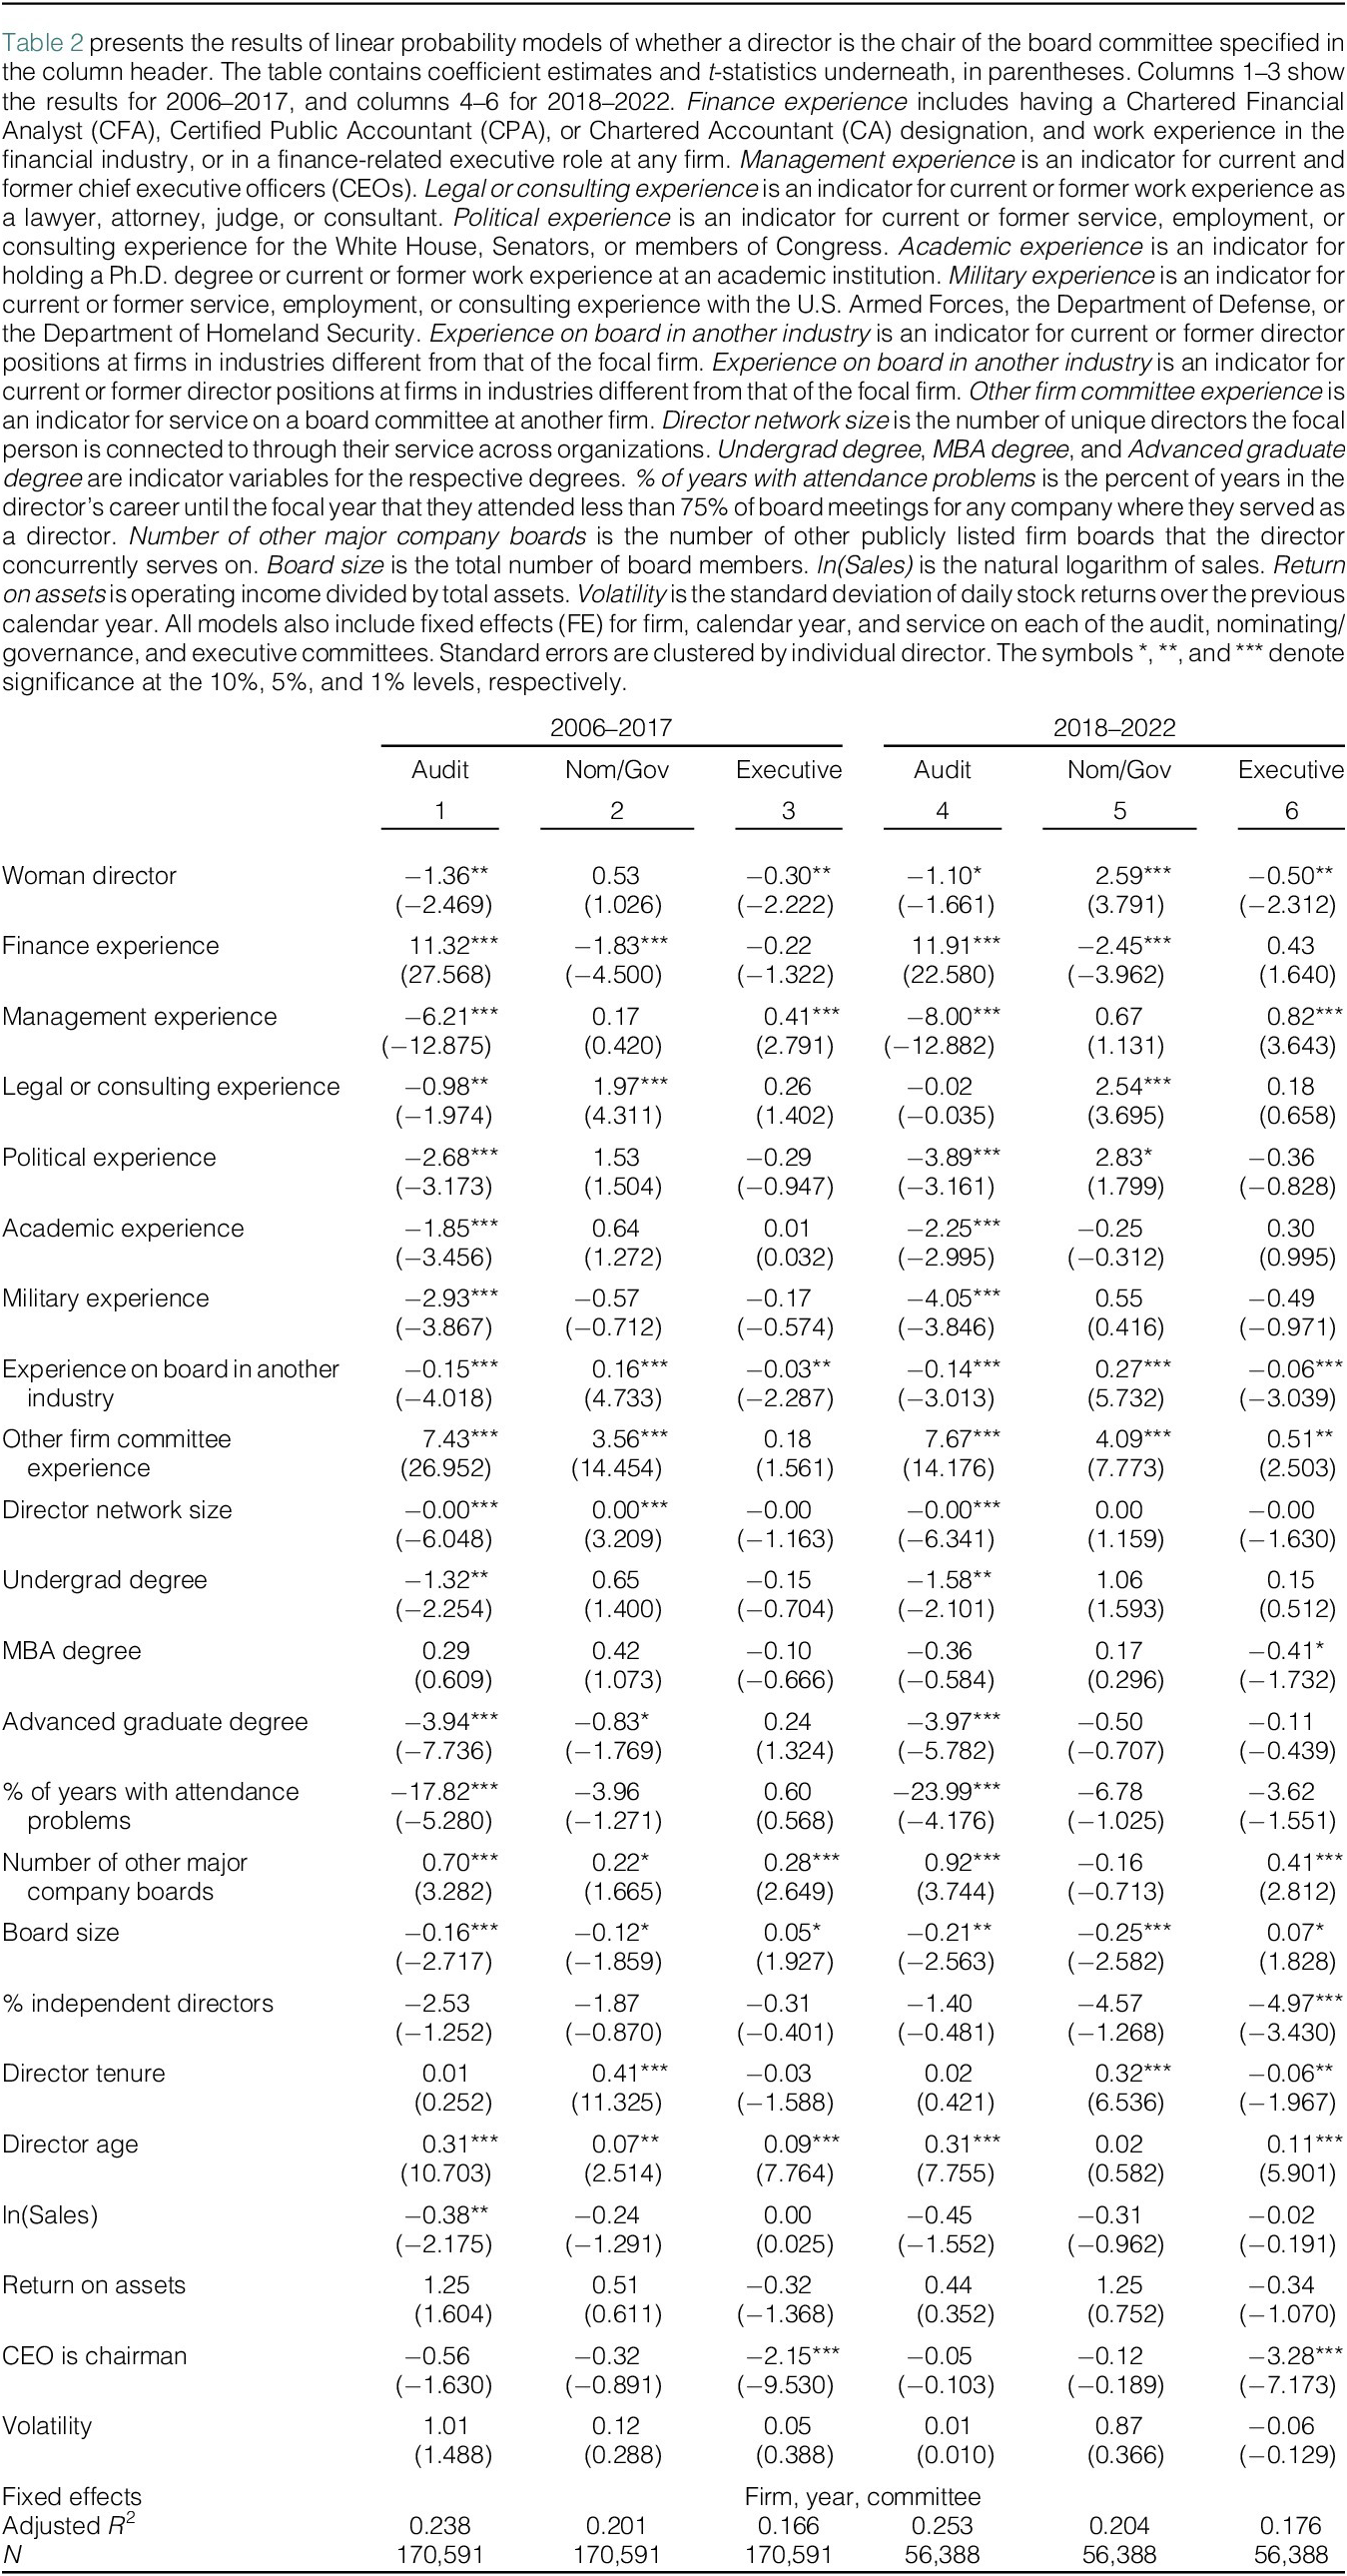
While the descriptive evidence is suggestive, it may mask changes in the composition of directors with the appropriate skills and experience required to chair various committees.Footnote 11 To address this point, we extend the analysis of Field et al. (Reference Field, Souther and Yore2020) to examine whether the likelihood of women being selected to board leadership positions changes when controlling for a wide variety of relevant skills and experience. Table 2 compares the correlation between the female director indicator and the likelihood of chairing an important board committee during 2006–2017, the sample period of Field et al. (Reference Field, Souther and Yore2020), and the part of our sample after that, 2018–2022. Women are significantly less likely to chair the audit and the executive committees, both during 2006–2017 (columns 1 and 3) and the more recent period, 2018–2022 (columns 4 and 6). The only change we observe is that women are significantly more likely to chair the nom/gov committee during 2018–2022 (column 5), while we find no significant difference for 2006–2017 (column 2).Footnote 12 This is notable because investors often express dissatisfaction related to board composition by voting against the chair of the nom/gov committee (Lublin and Krouse (Reference Lublin and Krouse2017), Barzuza, Curtis, and Webber (Reference Barzuza, Curtis and Webber2019)). The increase in women serving in these roles may therefore have reflected a prophylactic measure against such a withhold campaign.

TABLE 2 Long description
The table is divided into two main time periods: 2006 to 2017 (Columns 1 to 3) and 2018 to 2022 (Columns 4 to 6). Each period includes three committee types: Audit, Nom/Gov (Nominating and Governance), and Executive.
Key findings for the ‘Woman director’ variable:
* 2006 to 2017: Audit -1.36 (t = -2.469), Nom/Gov 0.53 (t = 1.026), Executive -0.30 (t = -2.222).
* 2018 to 2022: Audit -1.10 (t = -1.661), Nom/Gov 2.59 (t = 3.791), Executive -0.50 (t = -2.312).
Other significant variables include:
* Finance experience: Strongly positive for Audit committees in both periods (11.32 and 11.91).
* Management experience: Strongly negative for Audit committees (-6.21 and -8.00) but positive for Executive committees (0.41 and 0.82).
* Legal or consulting experience: Positive for Nom/Gov committees (1.97 and 2.54).
* Other firm committee experience: Strongly positive for Audit (7.43 and 7.67) and Nom/Gov (3.56 and 4.09).
* Attendance problems: Strongly negative for Audit committees (-17.82 and -23.99).
Control variables include Director network size, Undergrad degree, M B A degree, Advanced graduate degree, Number of other major company boards, Board size, percent independent directors, Director tenure, Director age, ln(Sales), Return on assets, C E O is chairman, and Volatility. All models include fixed effects for Firm, year, and committee. Adjusted R-squared values range from 0.166 to 0.253. Sample size N is 170,591 for the first period and 56,388 for the second.
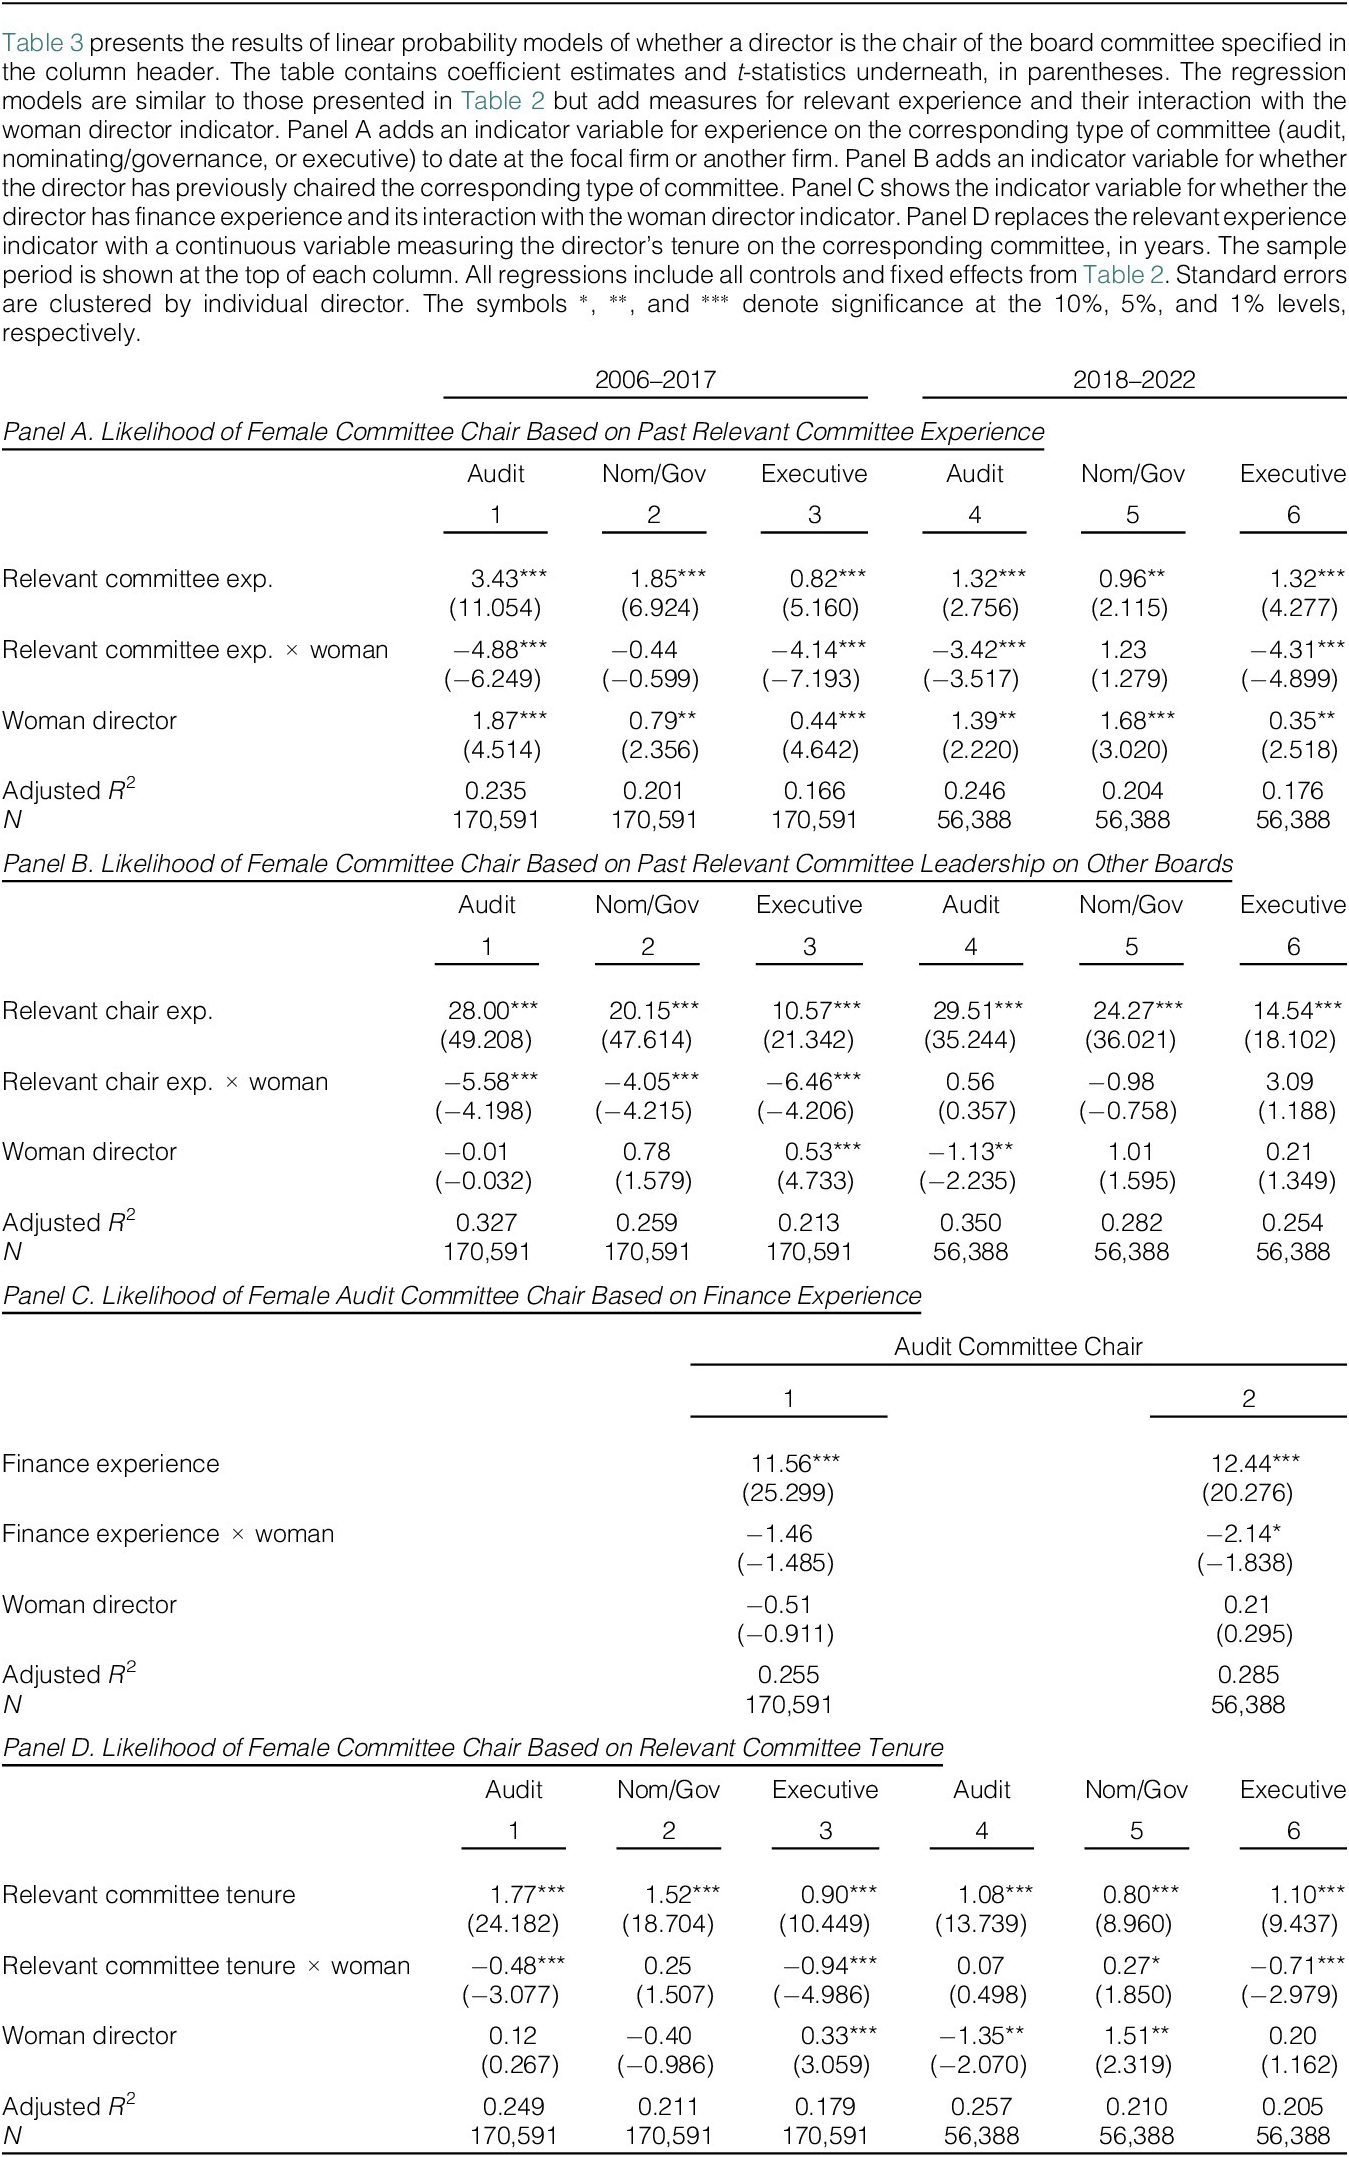
Men and women directors may differ in the specific qualifications that boards look for when electing committee chairs (Field et al. (Reference Field, Souther and Yore2020)). Further, even similar credentials of men and women may be viewed differently in the director labor market (Cziraki and Robertson (Reference Cziraki and Robertson2021)). Table 3 examines if women are more (or less) likely to be elected the chair of a committee conditional on relevant experience and time variation in these differences (if any). Panel A shows that having previously served as a member of the relevant committee is a statistically significant positive predictor of committee leadership on all three committees. However, it also shows significant negative coefficients for women with relevant experience on the audit (columns 1 and 4) and executive (columns 2 and 5) committees. These differences persist both during 2006–2017 and the later period 2018–2022.

TABLE 3 Long description
The table is divided into four panels (A through D), each analyzing the likelihood of a director being a committee chair for Audit, Nom/Gov, or Executive committees across two time periods: 2006 to 2017 and 2018 to 2022.
Panel A: Likelihood based on past relevant committee experience.
- Relevant committee experience shows positive coefficients across all columns, ranging from 0.82 to 3.43, all significant at the 1 percent level.
- The interaction term (Relevant committee experience times woman) is negative and significant for Audit and Executive committees in both periods, with values like -4.88 (t-stat -6.249) and -3.42 (t-stat -3.517).
Panel B: Likelihood based on past relevant committee leadership on other boards.
- Relevant chair experience has very high positive coefficients, such as 28.00 and 29.51 for Audit, significant at the 1 percent level.
- The interaction term (Relevant chair experience times woman) is negative and significant in the 2006 to 2017 period for all committees, but loses significance in the 2018 to 2022 period.
Panel C: Likelihood of Female Audit Committee Chair based on finance experience.
- Finance experience has a strong positive correlation (11.56 and 12.44).
- The interaction with woman director is negative, reaching significance at the 10 percent level in the 2018 to 2022 period (-2.14).
Panel D: Likelihood based on relevant committee tenure.
- Tenure shows a positive coefficient (0.80 to 1.77) across all models.
- The interaction term (Tenure times woman) is negative and significant for Executive committees in both periods and Audit in the first period.
All panels include Adjusted R-squared values and sample sizes (N = 170,591 for the first period and N = 56,388 for the second).
Panel B of Table 3 replaces the indicator for having previously served on the relevant committee with one for having previously chaired such a committee (on the board of another firm). As expected, directors who have previous experience as the chair of a committee are significantly more likely to be chosen to chair that type of committee again. Further, the size of the coefficient is appreciably larger for committee chair experience (Panel B) than for previous committee membership (Panel A). We, again, find that prior experience benefits women less: Panel B columns 1–3 show a significantly negative coefficient for the interaction of committee chair experience and the woman director dummy during 2006–2017. However, we find that the coefficient of the interaction term is not statistically significant during 2018–2022 (columns 4–6), and the point estimate is positive in two out of three models. Hence, while committee chair experience is less beneficial for women during 2006–2017 than for men, there is no such gender difference in 2018–2022.
Table 3 Panel C shows that finance experience is associated with a 12% higher likelihood of being the chair of the audit committee, both during 2006–2017 (column 1) and 2018–2022 (column 2). However, we also find that finance experience is marginally less beneficial (at 1.5%–2%) for women directors, and this gender difference is similar across both periods.
Tenure on the relevant committee may also affect the likelihood of being elected its chair (Field et al. (Reference Field, Souther and Yore2020)). Women’s membership of key committees increased rapidly after 2015, as shown in Figures 3–5. If tenure on a committee is an important consideration when electing its chair, differences in tenure between men and women may explain why fewer women serve as committee chairs. To examine this possibility, in Table 3 Panel D, we control for a continuous measure of committee tenure and its interaction with the woman director indicator. One additional year of tenure on the relevant committee increases the likelihood of being the committee chair by 1–2 percentage points during 2006–2017 and 1 percentage point during 2018–2022. Consistent with Field et al. (Reference Field, Souther and Yore2020), for 2006–2017, we find that the positive effect of tenure is significantly smaller for female directors. However, for 2018–2022, the difference is only negative for the executive committee (column 6), while the point estimate is positive for the audit committee and the nom/gov (columns 4 and 5, respectively) and even borders on statistical significance for the latter.
In sum, we document some modest evidence that women have taken more important committee assignments over time. Membership on key committees has improved substantially during our sample period. Outside of the executive committee, women directors do not appear to be lagging behind their male colleagues in terms of committee membership.Footnote 13 Committee leadership has also increased over time. First, women are significantly more likely to chair the nominating or governance committee, controlling for educational credentials and professional experience, in the 2018–2022 period than they were between 2006 and 2017. Second, while relevant experience (either as a committee chair or tenure as a member) benefits women less than men between 2006 and 2017, our results suggest that this difference decreases, or even disappears, by the 2018–2022 period.
C. Continuity: Board Size
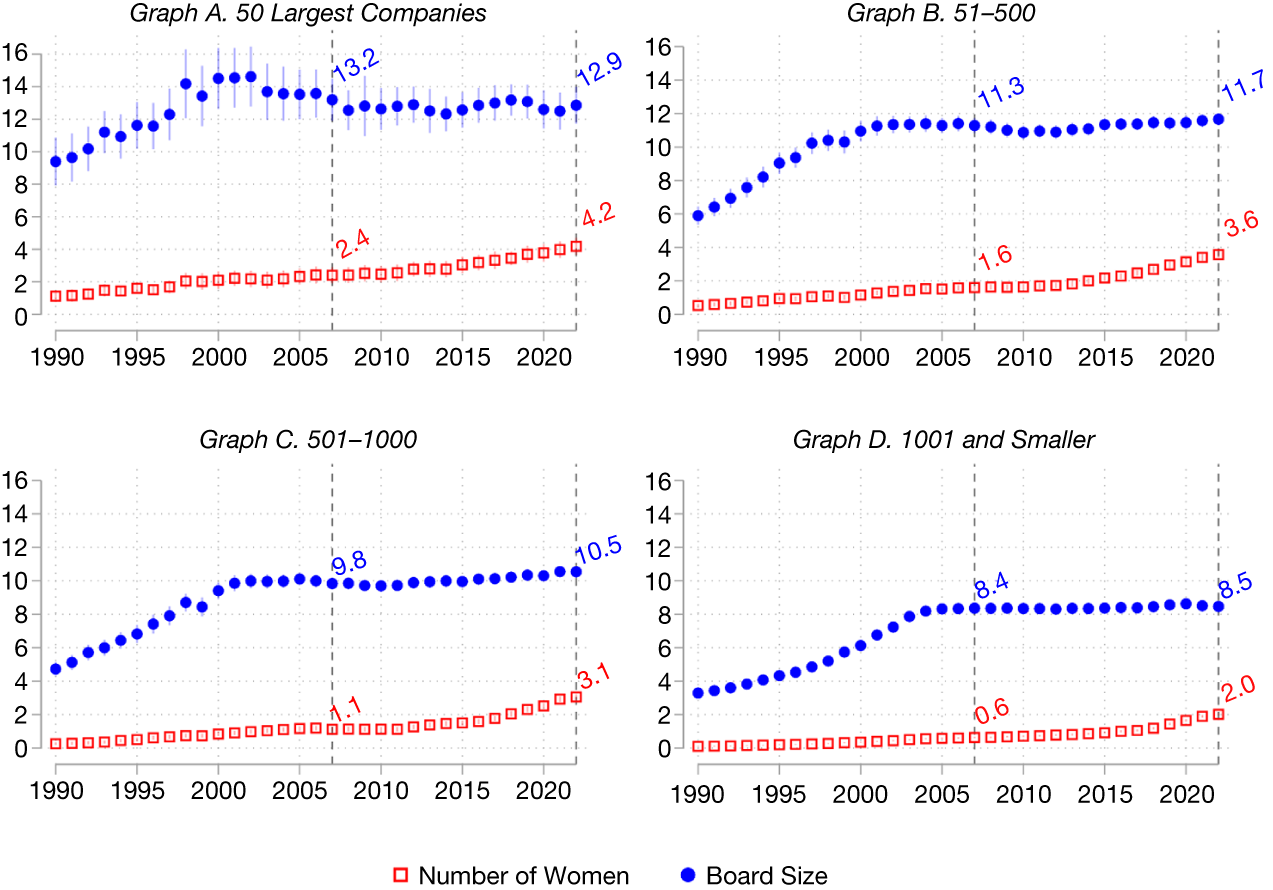
Do companies increase board size to add women? Figure 6 shows that board size has increased only modestly over the past few decades. While we see substantial evidence of board expansion over the course of the 1990s, particularly outside of the very largest companies, this expansion slowed over the past 15 years, shown by the dashed lines at 2007 and 2022. If anything, the boards of the very largest companies have become slightly smaller (from 13.20 directors to 12.86), although this difference is not statistically significant. The small increase (from 8.36 to 8.46) at small-cap companies is also not statistically significant. Board size increased only modestly among large-cap companies (from 11.28 to 11.66) and mid-cap companies (from 9.83 to 10.54).Footnote 14
Figure 6 plots the average board size (indicated with blue circles) and the average number of women (indicated with red squares) per year. Companies are divided into four groups by equity market capitalization in the year in question, where 1 is the largest company. Error bars represent 95% confidence intervals around the estimates, calculated using a Bonferroni adjustment to account for the fact that we are displaying 33 different estimates (one for each year between 1990 and 2022). Confidence intervals are truncated at 0 and 16. The mean values for 2007 and 2022 are provided in the figure. The difference in board size between 2022 and 2007 is not statistically significant in the first figure (representing the largest companies, p = 0.534). The difference is statistically significant in the second and third figures (p = 0.039 and p = 0.000, respectively), and is only very marginally significant in the fourth (representing the smallest companies, p = 0.104). The difference in the number of women directors between 2022 and 2007 is statistically significant in all four figures (p = 0.000 in all four).

FIGURE 6 Long description
A multi-panel graph with four quadrants representing company size tiers. Each panel shares a horizontal x-axis from 1990 to 2022 and a vertical y-axis from 0 to 16. Blue circles represent Board Size and red squares represent Number of Women. Vertical dashed lines mark the years 2007 and 2022.
* Top-Left (50 Largest Companies): Board size peaks near 14 in 2000 before stabilizing. Values are 13.2 in 2007 and 12.9 in 2022. Number of women rises steadily from near 1 to 2.4 in 2007 and 4.2 in 2022.
* Top-Right (51 to 500): Board size increases from 6 in 1990 to 11.3 in 2007 and 11.7 in 2022. Number of women rises from near 0 to 1.6 in 2007 and 3.6 in 2022.
* Bottom-Left (501 to 1000): Board size increases from 5 in 1990 to 9.8 in 2007 and 10.5 in 2022. Number of women rises from near 0 to 1.1 in 2007 and 3.1 in 2022.
* Bottom-Right (1001 and Smaller): Board size increases from 3 in 1990 to 8.4 in 2007 and 8.5 in 2022. Number of women rises from near 0 to 0.6 in 2007 and 2.0 in 2022.
In all panels, the Number of Women shows a consistent upward trend, while Board Size growth generally plateaus after 2005. Error bars indicate 95 percent confidence intervals.
Meanwhile, the number of women directors has crept up steadily since the 1990s. The trend has accelerated in recent years, particularly outside the very largest companies. This is a well-known phenomenon (Kim and Starks (Reference Kim and Starks2016), Deloitte (2023)) and is consistent with much prior literature on corporate governance (e.g., Adams and Ferreira (Reference Adams and Ferreira2009), Gokulan (Reference Gokulan2021)).
It is apparent from Figure 6 that boards have not expanded enough over the past 15 years to account for the increase in the number of women directors. Over that period, mega-, large, and mid-cap companies all added between 1.8 and 2 women directors, on average. The small-cap companies were only slightly behind, adding an average of 1.4 women directors.Footnote 15 Unsurprisingly, the average number of women directors increases monotonically with company size.
We study the relationship between the addition of women and board size more formally using an event study framework. The unit of observation is company
$ \times $
 year. We regress board size (the number of independent directors) on company, year, and company size group fixed effects. We cluster standard errors at the company level and include a Bonferroni adjustment to account for multiple hypothesis testing. The regression model is

where
$ {T}_{j,\tau +k} $
 is an indicator equal to 1 if year
$ \tau $
 represents event time
$ k $
 for company
$ j $
 .
$ {Size}_{j,\tau } $
 is the size of company’s board in year
$ \tau $
 ,
$ {\eta}_j $
 are company fixed effects,
$ {\lambda}_{\tau } $
 are year fixed effects, and
$ {\Phi}_{j,\tau } $
 are firm size category fixed effects for company
$ j $
 in year
$ \tau $
 , and
$ {\varepsilon}_{j,\tau } $
 is the error term.
Figure 7 plots the estimates of the event-time indicators
$ {\beta}_k $
 for women in red, with rectangular markers. In Graphs A and B (C and D), t = 0 refers to the year in which the number of women directors increased by one (two) and the number of men directors did not increase.Footnote
16 Graphs A and C show the results using data from 1990 to 2009; Graphs B and D use data from 2010 to 2022.
Figure 7 plots the results of an event study analysis of the relationship between an increase in women directors (indicated with red squares) and board size, and the relationship between an increase in men directors (indicated with blue circles) and board size. The unit of observation is company
$ \times $
 year. For the analysis of women directors,
$ t=0 $
 represents the year that the number of women increased by one (two) while the number of men did not increase in Graphs A and B (C and D). The analysis for men is analogous, with the genders reversed. Graphs A and C use data from 1990 through 2009; Graphs B and D restrict the sample to 2010 through 2022. The regression model is

where
$ {T}_{j,\tau +k} $
 is an indicator equal to 1 if year
$ \tau $
 represents event time
$ k $
 for company
$ j $
 . The
$ {\beta}_k $
 estimates are what we plot in the figure.
$ {Size}_{j,\tau } $
 is the size of company’s board in year
$ \tau $
 ,
$ {\eta}_j $
 are company fixed effects,
$ {\lambda}_{\tau } $
 are year fixed effects,
$ {\Phi}_{j,\tau } $
 are firm size category fixed effects for company
$ j $
 in year
$ \tau $
 (defined using the same categories as in Figure 1), and
$ {\varepsilon}_{j,\tau } $
 is the error term. Error bars represent 95% confidence intervals around the point estimate, calculated using standard errors clustered at the company level and a Bonferroni adjustment to account for the fact that we are displaying 5 different estimates. Confidence intervals are truncated from below at −0.2.

FIGURE 7 Long description
The figure consists of four panels labeled Graph A through Graph D. All graphs share a common X-axis ranging from negative 2 to 3, representing years relative to an event at year 0. A legend at the bottom indicates that red lines with square markers represent Woman Director and blue lines with circular markers represent Man Director. Vertical error bars are present for each data point.
* Graph A. One Director Added, 1990 to 2009. The Y-axis ranges from negative 0.1 to 1.1. Both lines start near 0 at year negative 2. At year 0, the Man Director line peaks at 0.8 while the Woman Director line peaks lower at 0.38. Both decline slightly through year 3, ending at 0.47 and 0.18 respectively.
* Graph B. One Director Added, 2010 to 2022. The Y-axis ranges from negative 0.1 to 1.1. The Man Director line starts at 0.35, drops to 0 at year negative 1, then peaks at 0.94 at year 0. The Woman Director line starts at 0.02 and peaks at 0.36 at year 0. By year 3, values are 0.48 for men and 0.09 for women.
* Graph C. Two Directors Added, 1990 to 2009. The Y-axis ranges from negative 0.2 to 2. The Man Director line peaks at 1.71 at year 0 and ends at 0.86. The Woman Director line peaks at 1.16 at year 0 and ends at 0.13.
* Graph D. Two Directors Added, 2010 to 2022. The Y-axis ranges from negative 0.2 to 2. The Man Director line peaks at 1.86 at year 0 and ends at 0.59. The Woman Director line peaks at 1.28 at year 0 and ends at 0.28.
Across all panels, the addition of a Man Director consistently results in a higher numerical peak at year 0 compared to the addition of a Woman Director.
The results in Graphs A and B indicate that, on average, in the year in which a woman is added to a board, board size increases by 0.36, indicating that 36% of boards expanded to accommodate this addition. While the point estimate is slightly higher (0.38) in the 1990–2009 subsample, the confidence intervals overlap comfortably. This increase, however, is transitory: in the 2010–2022 period, board size drops more than halfway back to its pre-addition level (to 0.15) within 1 year, and the confidence intervals include zero by year 3. This drop is slightly less sharp in the 1990–2009 period (to 0.23 in the first year), but even in the earlier period, the effect of the additional woman is not statistically distinguishable from zero within 3 years.
Larger changes have a proportionately larger impact on board size, but if anything, dissipate even faster: Figure 7 Graphs C and D examine the addition of two women directors. The point estimates in year
$ t=0 $
 are more than twice the magnitude of the ones in Grahps A and B, indicating that the transitory increase in board size “per woman director added” is larger: about 0.58 and 0.64 in the 1990–2009 and 2010–2022 periods, respectively. As in Graphs A and B, these increases drop substantially by
$ t=1 $
 , and continue to fall toward zero thereafter. The point estimates are not statistically distinguishable from zero in either subsample by
$ t=2 $
 .
All told, these results suggest that, on average, the addition of a woman director is associated with a temporary increase in board size. This increase, however, tends to revert the following year. The results for men—presented in blue with circle markers—tell a different story. The addition of one net man (Graphs A and B) is associated with an increase in total board size of 0.8 in the first half of the sample, and 0.94 in the second half. This increase also reverts over time, but remains elevated for the full 3 years. The differences between men and women are even larger, and more statistically significant in the second half of the sample period. The results for the addition of two men (Graphs C and D) are similar, although the differences are less pronounced.
These results are consistent with the idea that a company that identifies a suitable woman candidate might add her to the board quickly and then decline to replace a male director when he departs within a few years. These departing men could be stepping down as part of the ordinary board refreshment process, or their tenure could be cut short to make way for the newly appointed women. The results in Figure 8 are more consistent with the former. Figure 8 presents the results of an event study analysis of the relationship between the addition of a woman director and the tenure of departing male directors. As in Figure 7, the unit of observation is a company
$ \times $
 year, and we include company, year, and size group fixed effects. Graphs A and B present results where the “event” is an increase of one woman director (while the number of men directors did not decrease); Graphs C and D study an increase of two women directors (while the number of men directors did not decrease). Graphs A and C use data from 1990 to 2009, while Graphs B and D use data from 2010 to 2022. Across all four graphs, we find no statistically significant relationship between the addition of women directors and the tenure of departing male directors.Footnote
17 On balance, these event study tests looking at both board size and the tenure of departing male directors suggest that boards accommodate the addition of women directors by temporarily expanding, but quickly reverting to their original size once a male director ends their tenure.Footnote
18
Figure 8 plots the results of an event study analysis of the relationship between an increase in women directors and tenure of departing male directors. The unit of observation is company
$ \times $
 year.
$ t=0 $
 represents the year that the number of women increased by one (two) while the number of men did not increase in the Graphs A and B (C and D). Graphs A and C use data from 1990 through 2009; Graphs B and D restrict the sample to 2010 through 2022. The regression model is

where
$ {T}_{j,\tau +k} $
 is an indicator variable equal to 1 if year
$ \tau $
 represents event time
$ k $
 for company
$ j $
 . The
$ {\beta}_k $
 estimates are what we plot in the figure.
$ {TenureMen}_{j,\tau } $
 is the average tenure of departing male directors of company
$ j $
 ’s board in year
$ \tau $
 ,
$ {\eta}_j $
 are company fixed effects,
$ {\lambda}_{\tau } $
 are year fixed effects,
$ {\Phi}_{j,\tau } $
 are firm size category fixed effects for company
$ j $
 in year
$ \tau $
 (defined using the same categories as in Figure 1), and
$ {\varepsilon}_{j,\tau } $
 is the error term. Error bars represent 95% confidence intervals around the point estimate, calculated using standard errors clustered at the company level and a Bonferroni adjustment to account for the fact that we are displaying 5 different estimates.

FIGURE 8 Long description
The figure consists of four panels labeled Graph A through Graph D. All graphs share a common X-axis ranging from minus 2 to 3, representing years relative to the appointment. Red data points indicate mean values, and vertical light blue lines represent confidence intervals.
* Graph A. One Woman Director Added, 1990 to 2009. The Y-axis ranges from minus 1.5 to 1.5. The trend starts at minus 0.26, peaks at 0.39 in year 1, and ends at minus 0.4 in year 3.
* Graph B. One Woman Director Added, 2010 to 2022. The Y-axis ranges from minus 1.5 to 1.5. The trend shows a steady increase from minus 0.32 at year minus 2 to a peak of 0.69 at year 1, followed by a slight decline to 0.49 at year 3.
* Graph C. Two Women Directors Added, 1990 to 2009. The Y-axis ranges from minus 8 to 8. The data is volatile with large confidence intervals, starting at minus 2.06, fluctuating through minus 0.67 at year 0 and 0.78 at year 1, ending at 0.6 at year 3.
* Graph D. Two Women Directors Added, 2010 to 2022. The Y-axis ranges from minus 8 to 8. The trend is relatively flat near the zero baseline, starting at minus 0.93, peaking at 0.23 at year 0, and ending at minus 0.98 at year 3.
V. Gender Diversity Initiatives
The analysis so far focuses on which women are added to boards and how boards change as women are added, without regard for the reason that female representation increases. When firms have time to add new (female) directors, the timing may be related to the retirement of existing (male) directors. Their behavior may change in the presence of external pressures, which may result in different effects on the search process and on board size. In this section, we use two settings to examine whether our results differ between firms that were pressured (or even required) to add women to their boards and those that were not: ownership by certain large institutional investors (BlackRock, State Street, and Vanguard), commonly known as the “Big Three” (Lund and Robertson (Reference Lund, Robertson, Enriques and Strampelli2024)), and California SB 826 (SB 826).Footnote 19
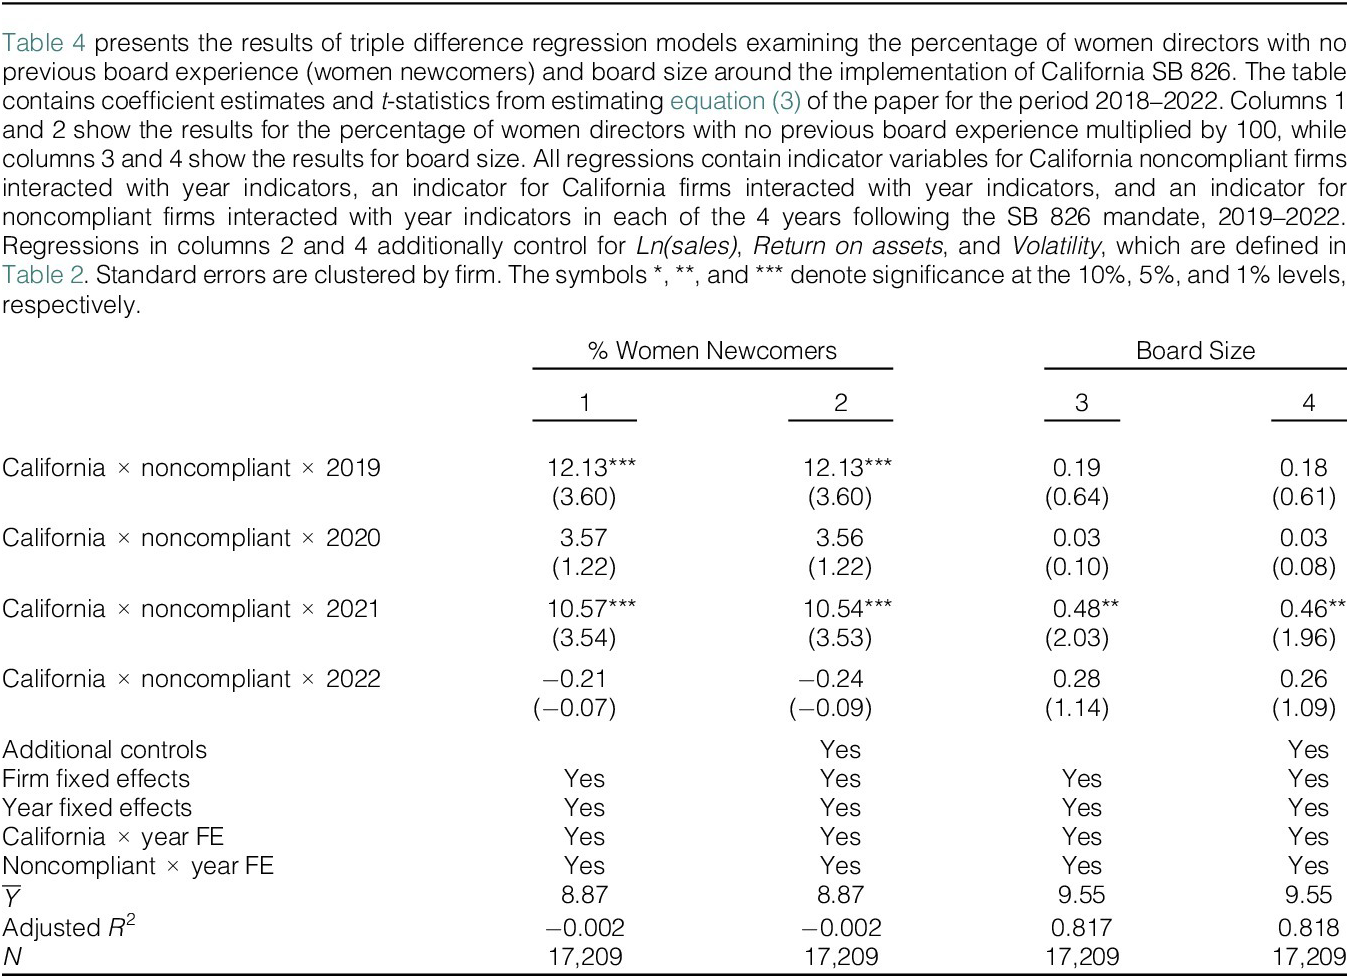
A. California Senate Bill 826, Newcomer Directors, and Board Size
In 2018, California mandated that firms headquartered in the state include women on their boards (Hwang et al. (Reference Hwang, Shivdasani and Simintzi2018), Gertsberg et al. (Reference Gertsberg, Mollerstrom and Pagel2021), and Klick (Reference Klick2025)). While there was always some uncertainty about the legality of this law—uncertainty that was resolved when it was ultimately struck down—the probability that it would survive was nonzero when it was enacted. Conditional on the law being in effect, the treated group consists of California firms that are not compliant with SB 826 as of 2018. The law required firms to have at least one woman on their board by 2019 and to have three (two) women on their board by 2021 if their board consisted of six directors or more (five) directors. We define compliance based on the 2021 targets set out in SB 2018 because firms did not yet know that the bill would later be struck down and, consequently, would have been right to expect that they would need to comply with the 2021 targets with positive probability. The other three groups are i) California firms that are in compliance with SB 826 in 2018, ii) firms outside of California that would also have been in compliance with SB 826 in 2018, and iii) firms outside of California that, had they been California firms, would not have been in compliance with SB 826 in 2018. The triple difference specification allows us to separate the effect of the California rule from general time trends and differences across compliant and noncompliant firms. We estimate the model for the period 2018–2022 to minimize the potential for confounding events:

where
$ {\eta}_j $
 are company fixed effects,
$ {\lambda}_t $
 are year fixed effects,
$ {\Phi}_{j,t} $
 are time-varying controls for firm size, ROA, and return volatility for company
$ j $
 in year
$ \tau $
 , and
$ {\varepsilon}_{j,t} $
 is the error term. We are interested in the coefficient estimates of the triple difference terms,
$ {\zeta}_k $
 .Footnote
20
Table 4 contains the results, showing two findings. First, the percentage of women who are newcomers (i.e., first-time directors) on boards increases at treated firms starting in 2019. The increase is 12.1% in 2019, 3.6% in 2020, and 10.5% in 2021. The 2019 and 2021 coefficients are highly statistically significant both with (column 2) and without (column 1) additional controls. The estimates are economically large: the average percentage of newcomer women is 8.9 for this regression sample. The triple interaction for 2020 is not statistically significant at conventional levels, potentially reflecting that early compliers added newcomer women by 2019 (the deadline to have at least one woman director), and a second group of late compliers did so by 2021.Footnote 21

TABLE 4 Long description
A statistical table with four columns of regression results. Columns 1 and 2 measure the percentage of women newcomers, while columns 3 and 4 measure board size.
Key regression coefficients for the interaction of California times noncompliant times year are as follows:
* 2019: 12.13 with a t-statistic of 3.60 (significant at 1 percent) for women newcomers; 0.19 and 0.18 for board size.
* 2020: 3.57 and 3.56 for women newcomers; 0.03 for board size.
* 2021: 10.57 and 10.54 (significant at 1 percent) for women newcomers; 0.48 and 0.46 (significant at 5 percent) for board size.
* 2022: negative 0.21 and negative 0.24 for women newcomers; 0.28 and 0.26 for board size.
Fixed effects and controls:
* Additional controls: No for columns 1 and 3; Yes for columns 2 and 4.
* Firm fixed effects, Year fixed effects, California times year F E, and Noncompliant times year F E are all marked Yes for all columns.
* Y-bar values: 8.87 for women newcomers and 9.55 for board size.
* Adjusted R-squared: negative 0.002 for women newcomers; 0.817 and 0.818 for board size.
* Sample size N: 17,209 for all columns.
Second, columns 3–4 show a modest increase in board size, followed by a reversal. The point estimates for 2021 indicate an increase of 0.46–0.49, which are statistically significant at conventional levels. This reverses in 2022, complementing the descriptive evidence in Figure 7. The two patterns are not directly comparable, however, as Figure 7 considers changes in board size in event time (as opposed to calendar time) around the addition of directors (as opposed to unconditionally for all firms, regardless of whether they added a woman director or not).
Overall, the evidence using California SB 826 is consistent with the patterns in the previous sections. The results indicate that California SB 826 helped women without board experience gain the first board seat of their careers. Looking at board size, we find a small and temporary increase at California firms that needed to bring themselves into compliance with the rule.
B. Big Three Institutional Ownership, Newcomer Directors, and Board Size
In 2017, the “Big Three” institutional investors started campaigns to increase the representation of women on corporate boards. Gormley, Gupta, Matsa, Mortal, and Yang (Reference Gormley, Gupta, Matsa, Mortal and Yang2023) present evidence suggesting that they were successful. We follow their method and measure Big Three institutional ownership at year-end 2016 as a proxy for the pressure firms face to add women directors to their boards. We estimate the difference-in-differences regression

where
$ {\eta}_j $
 are company fixed effects,
$ {\lambda}_t $
 are year fixed effects, and
$ {\varepsilon}_{j,t} $
 is the error term. The difference-in-differences coefficient of interest is
$ \zeta $
 . To check pretrends and dynamic effects after 2016, we also estimate a version replacing the
$ Post{2016}_t $
 indicator with a set of individual year fixed effects. We estimate the model from 2015 to the last year of our sample, 2022.
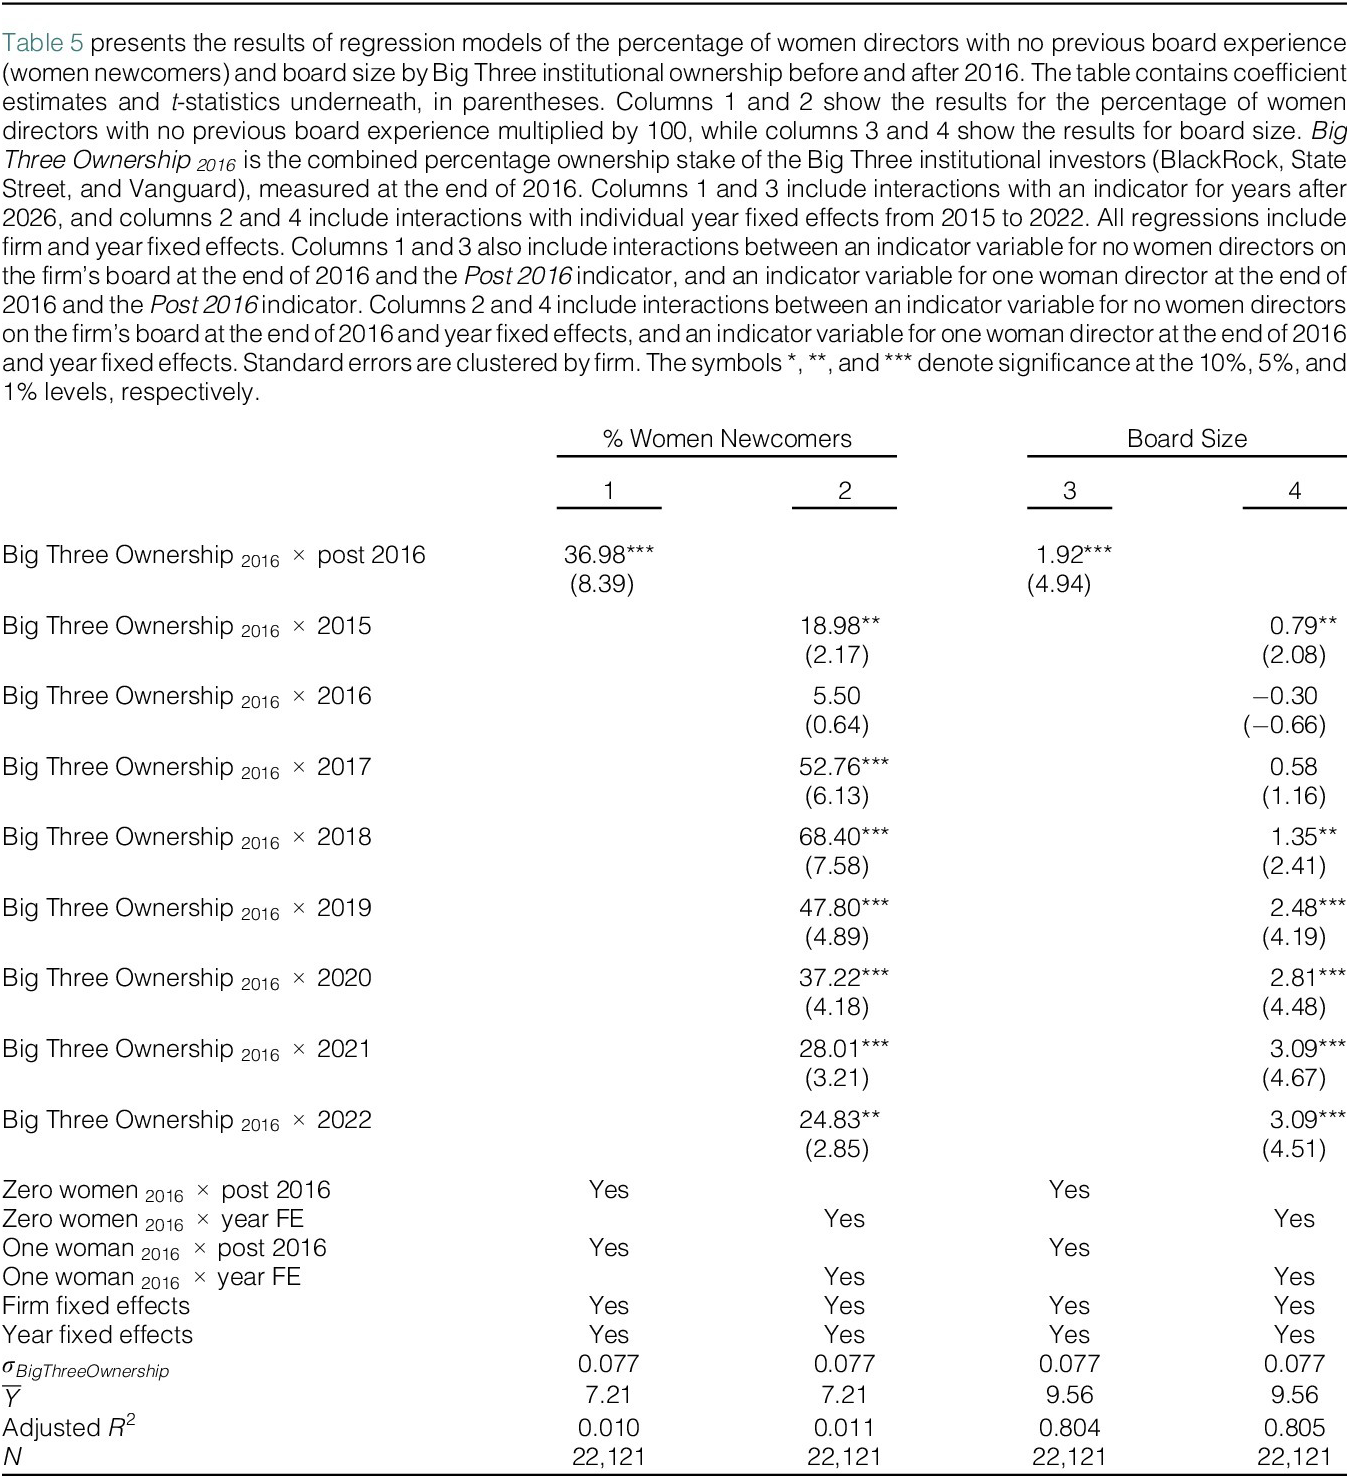
Column 1 of Table 5 shows that after 2016, the percentage of newcomer women increases significantly on the boards of firms that had higher levels of Big Three institutional ownership in 2016. A 1-standard-deviation higher Big Three institutional ownership (7.7%) is associated with an increase of 2.85 (
$ =36.89\times $
 0.077) percentage points in the share of newcomer women on the board, a relative increase of 40% from the average of 7.2 percentage points. In column 2, we use yearly indicators to show that the increase in the share of newcomer women on the board is largest in 2017–2019. The coefficient estimate for 2015 is positive and statistically significant at the 5% level, while for 2016, it is small and not statistically significant. These patterns support the view that the number of women on boards was important to Big Three institutional investors even before they started their formal campaigns in 2017, and portfolio firms were aware of this preference. We conclude that gender diversity campaigns by the Big Three institutional investors also contributed to the increased share of newcomer women directors on corporate boards.

TABLE 5 Long description
The table contains four columns of regression results. Columns 1 and 2 measure the percentage of women newcomers, while columns 3 and 4 measure board size.
Key coefficient estimates for Big Three Ownership sub 2016 include:
* Interaction with post 2016: 36.98 (t-stat 8.39) for women newcomers and 1.92 (t-stat 4.94) for board size, both significant at the 1 percent level.
* Yearly interactions for women newcomers (Column 2): 18.98 in 2015, 5.50 in 2016, 52.76 in 2017, 68.40 in 2018, 47.80 in 2019, 37.22 in 2020, 28.01 in 2021, and 24.83 in 2022.
* Yearly interactions for board size (Column 4): 0.79 in 2015, minus 0.30 in 2016, 0.58 in 2017, 1.35 in 2018, 2.48 in 2019, 2.81 in 2020, 3.09 in 2021, and 3.09 in 2022.
Fixed effects and controls:
* All models include Firm and Year fixed effects (indicated by Y).
* Models 1 and 3 include interactions for Zero women sub 2016 or One woman sub 2016 with the post 2016 indicator.
* Models 2 and 4 include interactions for Zero women sub 2016 or One woman sub 2016 with year fixed effects.
Model Statistics:
* Sigma Big Three Ownership is 0.077 for all columns.
* Mean Y-bar is 7.21 for women newcomers and 9.56 for board size.
* Adjusted R-squared is 0.010 to 0.011 for women newcomers and 0.804 to 0.805 for board size.
* Sample size N is 22,121 for all models.
Column 3 of Table 5 shows that Big Three institutional ownership is associated with a small but statistically significant increase in board size after 2016. A 1-standard-deviation increase in Big Three institutional ownership is associated with an increase in board size of 0.15, or 1.6% relative to the sample average. Column 4 shows that this increase is gradual and starts in 2018, with some evidence of an increase in 2015. Thus, campaigns by the Big Three to increase the number of women directors led to a modest increase in board size. This increase is smaller than the one we see in our event study analysis—repeating the caveat that the two numbers are not directly comparable—and one-third of the magnitude we find for firms affected by California SB 826.
Overall, both of the tests in this section suggest that initiatives in the late 2010s to increase gender diversity help women without board experience gain the first board seat of their careers. Our findings on board size are mixed. On the one hand, we find similar patterns to those in the main analysis when examining California SB 826: a small increase in board size—just under 0.5—that quickly reverts. On the other hand, we find a much smaller—but more persistent—increase at firms affected by the campaigns of the Big Three institutional investors.
VI. Conclusion
Our analyses provide suggestive evidence about the construction and evolution of corporate boards. First, we shed light on the search for candidates, particularly when companies are under pressure to increase board diversity. We show that, until recently, companies tended to treat men and women with board experience equally, at least given the observable characteristics that we can measure. Our results suggest that, in recent years, companies have been recruiting women who would previously not have been selected: women with director experience at smaller firms, or no prior director experience. Both firms affected by California SB 826 and those affected by the campaigns by the Big Three institutional investors added more women without previous director experience to their boards compared to firms that were not.
Second, we show the gradual evolution of women’s membership on and leadership of influential board committees. The percentage of women serving on these committees increased commensurately with the percentage of women directors—with the exception of the executive committee. After 2018, women are also somewhat more likely to chair influential committees, and are more likely to be selected for such positions when they have relevant experience.
Third, we provide evidence consistent with a tradeoff in board construction. When firms add a woman director, we see only a temporary increase in board size approximately one third of the time. We find a similar pattern of a small increase followed by a reversal for firms that were affected by California SB 826. While a larger board can allow for more diversity of both biography and expertise, it may also come with costs. In addition to the relatively modest pecuniary costs of paying more directors, larger boards may be more difficult to coordinate, and boardroom discussions might become unwieldy. This also suggests that, contrary to the suggestion of some commentators, boards are unlikely to continue to expand.Footnote 22
Our findings suggest that companies value their relationships with current directors, and are unlikely to remove them prematurely to make room for new candidates. The results also point to a second reason why efforts to change board composition are likely to be gradual: not only must companies identify new candidates, but they may also need to wait for a seat to open up (or be about to open up) through a retirement.
Supplementary Material
To view supplementary material for this article, please visit http://doi.org/10.1017/S002210902610324X.













 Open access

