Introduction
The reduction of piglet losses is an important factor for the improvement of the economical success parameter in piglet production – the number of piglets weaned (Röhe and Kalm, Reference Röhe and Kalm2000).
Most of piglet mortality is due to the sow, either directly via crushing or indirectly via starvation (Algers et al., Reference Algers, Rojanasthien and Uvnäs-Moberg1990; Edwards et al., Reference Edwards, Smith, Fordyce and MacMenemy1994; Weary et al., Reference Weary, Pajor, Fraser and Honkanen1996). These causes are not independent as the risk of a piglet being crushed increases with the piglet’s starvation (Fraser, Reference Fraser1990; Marchant et al., Reference Marchant, Rudd, Mendl, Broom, Meredith, Corning and Simmers2000; Damm et al., Reference Damm, Forkman and Pedersen2005). English and Morrison (Reference English and Morrison1984) reported that more than 50% of piglet losses occurred within 4 days after birth. Marchant et al. (Reference Marchant, Broom and Corning2001) found that nearly half of the losses due to crushing occurred within the first 24 h after birth, but most crushing occurred during farrowing. The peak in crushing coincided with a peak in frequency of postural changes, but crushing and frequency of postural changes were not correlated (Weary et al., Reference Weary, Pajor, Fraser and Honkanen1996). This was probably related to differences in the farrowing environment or the sows genotype (Marchant et al., Reference Marchant, Broom and Corning2001). In crated sows, most crushing occurs when the sow lies down (Weary et al., Reference Weary, Pajor, Fraser and Honkanen1996). However, deaths due to crushing have to be reduced. Rather than restricting the movements of the sow when rolling and lying down, the focus has to centre to other factors that reduce the risk of losing piglets.
Furthermore, litter size at birth has increased in the last decade (Bidanel et al., 1994; Knol et al., Reference Knol, Leenhouwers and van der Lende2002; Holl and Robison, Reference Holl and Robison2003), but litter size at birth is negatively related to the survival of the piglets (Grandinson et al., Reference Grandinson, Rydhmer, Strandberg and Thodberg2003). The death of suckling piglets adversely affects the productivity of farms. Unfortunately, the survival rate itself has had a very low heritability (Röhe and Kalm, Reference Röhe and Kalm2000; Grandinson et al., Reference Grandinson, Lund, Rydhmer and Strandberg2002) so that breeding directly for higher survival has not been promising (Röhe, Reference Röhe1999) and little is known about the different causes of piglet losses.
This is the first paper of a series of articles that deals with the genetic aspects of piglet losses and the maternal behaviour of sows. Therefore, the aim of this paper was to analyse piglet losses in more detail and to investigate the genetic background of different causes of piglet losses, especially to estimate genetic correlations between the different causes of piglet losses and the common reproduction traits.
Material and methods
Data
One person recorded data in a nucleus herd of the German breeding company ‘Hülsenberger Zuchtschweine’ from January until December 2004. Data of 943 German Landrace sows with 1538 pure-bred litters from 82 sires were available. The 943 sows were of 576 dams and 142 sires. 38.52% of the sows had more than one litter in the dataset. During lactation, the sows were housed in farrowing pens of homogeneous type with a dimension of 2.74 m × 1.75 m. The sows were fixed in diagonally ordered farrowing crates. They were managed in a 1-week rhythm with a 21-day lactation period. Nearly 1 week before the calculated farrowing date, the sows left the gestation pens where they were housed in crates and were washed before entering the farrowing units. After washing, the sows were penned up in the farrowing compartments with 20 sows per each compartment, ordered by the calculated farrowing date. Sows from five successive housing groups formed one farrowing batch. The sows were fed according to litter size and appetite during lactation.
Piglet weight and causes of losses (LOSS)
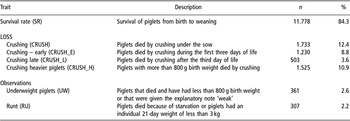
A total of 13 971 live-born piglets from 1349 Landrace breed litters were weighed individually and earmarked within the first 24 h after birth. The weight of the piglets was also recorded at the age of 21 days. Special explanatory notes on the condition of their bodies were made, such as anomalies, injuries or even a physical observation. Piglets that died during the lactation period were weighed on their day of death and the cause of death was determined visually. The different causes of losses (four cases of LOSS, ‘underweight’ and ‘runt’) are defined in Table 1. For ‘runt’ and ‘underweight’ the weaning weight was also used if piglets survived until day 21 as not all of the piglets in these classes were dead. These piglets were not marketable, so they were seen as economical losses.
Description, number (n) and percentage (%) of the survival rate, the different causes of piglet losses (LOSS) and the explanatory notes on body constitution

Fertility traits
Piglets that were mummified, stillborn and born alive were counted and the sex of live-born piglets was noted. All dead but fully developed piglets were defined as stillborn, not fully developed as mummified. 10% of live-born piglets were cross-fostered. Only heavier piglets were cross-fostered, mostly during the first day after birth. Cross-fostering had to be completed by day 3. Age, nurse sow and the weight at cross-fostering were also documented for these piglets.
Statistical analyses
Structure of the data
The LOSS and the piglet weights were recorded for each piglet individually but they were regarded as traits to characterize the merit of the sow. Each piglet record was seen as a repeated observation of its biological dam. Subsequently, each sow had as many repeated observations for a parity as piglets in the respective litter. Following this, a random additive genetic effect as well as a permanent environmental effect were estimated for each dam using an animal model. Because many dams showed several litters, litter size and a random litter effect were included as well.
Analysis of fixed effects
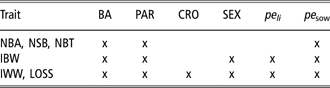
The following fixed effects were considered. A farrowing batch was defined as a group of sows farrowed within the same period of time (eight classes, each class includes 5 weeks). The effect of the parity was divided into seven classes, where parities one to six were individual classes and all parities higher than or equal to seven were in the seventh class. For the causes of losses (LOSS) and the individual weights of the piglets, the following were used: the fixed effects of the farrowing batch (eight classes), parity of the sow (seven classes), cross-fostering (yes/no), sex of the piglet, the random permanent effect of the sow, the random permanent effect of the litter and the random additive genetic effect of the sow in each observation of the piglets (Table 2). For litter size, number of piglets born alive (NBA), number of stillborn piglets (NSB) and number of piglets born in total (NBT), the fixed effects of farrowing batch, parity of the sow and the random permanent effect of the sow were used (Table 2). The analysis of the significance of the fixed effects and their interactions was carried out using the MIXED procedure from the statistical software SAS (SAS, 2004).
Description of models used
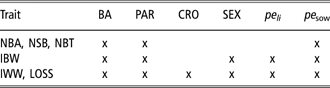
BA: Fixed effect if the farrowing batch (eight classes).
PAR: Fixed effect of the parity of the sow (seven classes; 1,2,…6,7+).
CRO: Fixed effect of cross – fostering (yes/no).
SEX: Fixed effect of sex of the piglets (m/f).
peli: Random permanent effect of the litter.
pe sow: Random permanent effect of the sow.
Heritabilities and variance components for LOSS
The traits of LOSS were defined as binary traits (1 = the occurrence of the respective trait, 0 = no occurrence of the trait). The binary datasets of the survival rate, stunting, runts and the four traits of LOSS were analysed using a single-trait animal threshold model (Sorensen et al., Reference Sorensen, Andersen, Gianola and Korsgaard1995) with

where λijklmno is the unobservable liability of the respective observation. It was assumed that if the liability value exceeded a fixed threshold, the respective binary variable of LOSS adopted the value ‘1’, otherwise the variable was ‘0’, see Gianola and Sorensen (2001) for details on threshold models. Bi is the fixed effect of the ith farrowing batch, Pj is the fixed effect of the jth parity, Ck is the fixed effect of the kth cross-fostering, Sl is the fixed effect of the lth sex, plmn is the random permanent effect of the mth litter within the nth sow, psn is the random permanent effect of the nth sow, ao is the random effect of the oth animal and eijklmno is the residual effect.
The posterior distribution of the additive genetic variance and the permanent environmental variance of the liabilities was estimated with the Gibbs-Sampler implemented in the LMMG_TH program, which is a threshold derivative of LMMG (Reinsch, Reference Reinsch1996). For each LOSS trait, a single, long Gibbs chain consisting of 300 000 cycles was used. Convergence was determined by visual inspection of the trace plots. The results of each round were retained and the first 50 000 iterations were discarded as burn-in (plus safety) and the remaining results were used to estimate the variance components. The effective sample size out of the remaining results was >200. For the LOSS, the heritability (h 2) and repeatability (t) of a particular trait were estimated as:

where  ,
 and
 is the additive genetic variance, the permanent environmental variance of the sow and the permanent environmental variance of the litter, respectively. The residual variance was fixed to 1 (Sorensen et al., Reference Sorensen, Andersen, Gianola and Korsgaard1995).
Heritabilities and variance components for fertility traits
The variance components for the traits number of piglets born alive, number of piglets stillborn, number of piglets born in total, individual birth weight and individual weaning weight were estimated bivariately with the VCE 4 package (Neumaier and Groeneveld, Reference Neumaier and Groeneveld1998).
Genetic correlations
The genetic correlations between the LOSS and the reproductive traits of the sow were estimated bivariately by using VCE 4 (Neumaier and Groeneveld, Reference Neumaier and Groeneveld1998). The binary traits were treated as if they were linear in the estimation, but according to Gianola (Reference Gianola1982) the correlations were appropriate.
Results
Causes of piglet losses and piglet weights
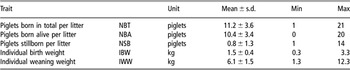
There were 10.4 ± 3.4 (mean ± s.d.) piglets born alive per litter and the mean birth weight was 1.5 kg (Table 3). Average parity number of sows in the dataset was 3.2. 31.3% of all piglet losses that occurred during the first day, 68% during the first 3 days and 82% in the first week.
Means, standard deviation (s.d.), minimum (Min) and maximum (Max) of the reproduction traits of 13 971 German Landrace piglets from 1349 pure-bred litters

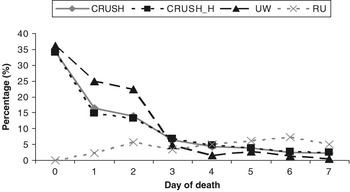
Figure 1 shows the daily piglet losses for each cause of loss (in percentage of all piglets lost due to the special cause). All curves, except the curve for runts, show the maximum at the day of birth and decrease to a level lower than 5% up to the end of the first week. The losses caused by runts occurred in later lactation and therefore the curve of runting piglets is the only one that increased during the first week of lactation.
Daily percentage of lost piglets for the different causes of losses (crushing (CRUSH), crushing of heavier piglets (CRUSH_H), underweight (UW), runting (RU)).

Parity number had a significant influence on piglet losses (P > 0.001) as the survival rate decreased with increasing parity of the sow. Parity two offered the fewest piglet losses and sows with parity seven or higher had the highest losses (23% of the piglets born alive died during the lactation period). With increasing parity, the number of piglets that died from being underweight or due to runting increased as well as the ratio of underweight and runting piglets as causes of piglet losses to the other causes of losses (Figure 2).
Influence of parity on the mortality rate and the different causes of piglet losses such as crushing (CRUSH), runting (RU) and underweight (UW).

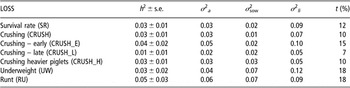
The estimated heritabilities for survival rate, crushing and crushing of heavier piglets were the same (h 2 = 0.03; Table 4). For crushing in early lactation, a slightly higher value (h 2 = 0.04) and for crushing late the lowest value (h 2 = 0.01) was estimated. Slightly higher heritabilities were estimated for the trait runting (h 2 = 0.05). The incidences for underweight and runting were very low (see Table 1), so the respective results should be handled with care. For all traits, the random permanent effect of the litter was higher than the additive genetic effect or the effect of the sow. For the traits of crushing, the highest additive genetic effect was estimated for crushing early.
Heritabilities (±s.e.), additive genetic variance (σ 2a), random permanent sow effect (σ 2sow), random common litter effect (σ 2li) and repeatability (t) for the different causes of piglet losses (LOSS)

σ 2e was set equal to 1.
The heritabilities of individual birth weights and of individual weaning weights of piglets were both h 2 = 0.10 (s.e. = 0.02). The genetic correlation between these traits was r g = 0.77 (s.e. = 0.06).
Fertility traits
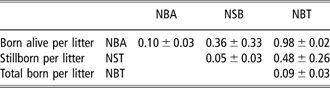
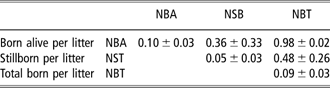
The heritabilities for the traits of litter size ranged from h 2 = 0.05 to h 2 = 0.10 (Table 5). The estimates for the number of piglets born in total were slightly lower than for the number of piglets born alive. The genetic correlations between the number of piglets born alive and in total were at a high level. Separating the first parity from the later parities, a correlation between the number of piglets born alive in the first parity and in later parities of r g = 0.61 was estimated. On the other hand, the correlation of r g = −0.06 between the number of stillborn piglets in the first parity and in later parities showed nearly no relation.
Heritabilities (on the diagonal) and genetic correlations (±s.e.) between the number of piglets born alive (NBA), stillborn piglets (NSB) and piglets born in total (NBT)
Relationship between the LOSS, the fertility traits and piglet weights
Primiparous sows had on average 9.93 piglets born alive. The number of piglets born alive grew with increased parity up to the third parity (Table 6). After the third parity, the number of piglets born decreased. The maximum individual birth weight of the piglets was found in the second parity. Primiparous sows had the lightest piglets with 1.49 kg on average.
Least square means of the number of piglets born alive and the individual birth weight for the different numbers of parity

The genetic correlations between the fertility traits and the LOSS traits are shown in Table 7. With an increased number of piglets born alive, the survival rate decreased (r g = −0.60) as well as with an increased number of piglets born in total (r g = −0.78). The chance of being crushed under the sow increased with the number of piglets born alive (r g = 0.47). Crushing in early lactation showed lower but also positive correlations with the number of piglets born alive and in total (r g = 0.35, r g = 0.54, respectively). If lighter piglets were excluded from the crushed piglets, the genetic correlations decreased (r g = 0.30; r g = 0.47, respectively). Positive correlations were evaluated between underweight piglets and the number of piglets born alive as well as between underweight piglet and the number of piglets born in total. Fewer piglets died because of being underweight when the number of stillborn piglets increased (r g = −0.57). The number of runts was positively correlated with the traits of litter size.
Genetic correlations (±s.e.) between the different causes of piglet losses (LOSS) and the fertility traits as number of piglets born alive (NBA), number of stillborn piglets (NSB), number of total born piglets (NBT), the individual birth weight (IBW) and weaning weight (IWW) of the piglets

*Not estimated due to convergence problems.
Between the survival rate and the piglet weights, positive correlations were estimated so that with increasing individual birth weight the survival rate also increased. However, nearly no relation was ascertainable (r g = 0.05) between crushing and the individual birth weight. A negative correlation was estimated between crushing and the individual weaning weight. Sows that had piglets with higher individual weaning weights had fewer losses due to crushing of their piglets. The correlation between birth weight and early crushing was negative (r g = −0.13). With increased individual birth weight the probability of being crushed decreased, especially being crushed during the first 3 days after birth (r g = −0.13). Due to the definition of traits, some correlations were very high such as e.g. the correlation between individual birth weight and being underweight. Sows with heavier piglets on the day of birth had fewer underweight piglets. Also between weaning weight and runting the negative genetic correlation was very high, because sows with more runts had more piglets with lower weaning weights.
Discussion
Causes of piglet losses
Proportionally, the day of birth displayed the highest risk for piglet losses (Figure 1). The sows as well as their piglets were weakened by the process of farrowing and the piglets were faced with a ‘new world’ and had so far developed only uncoordinated movements. Especially the lighter ones were more at risk as they were more dependent on extra heat (Plonait, Reference Plonait2001). The results of a higher risk on the day of parturition were in agreement with the analyses of English and Morrison (Reference English and Morrison1984), who reported that more than 50% of piglet deaths occur within 4 days after birth, and with Andersen et al. (Reference Andersen, Berg and Boe2005), who described a higher proportion of crushing within the first 2 days after farrowing (80%).
Robinson and Quinton (2002) analysed the genetic correlation between piglets born and the number of piglets that died during the first day of life and found a correlation of r = 0.5 between the two traits. This is similar to the high genetic correlation between the number of piglets born alive and those that died due to crushing in this study (r g = 0.47). With increasing parity, piglet mortality increased (Figure 2). This corresponds to the analysis of Marchant et al. (Reference Marchant, Rudd, Mendl, Broom, Meredith, Corning and Simmers2000), who found a significant association between the percentage of live-born mortality and the parity of the sow. After cross-fostering, an equalization of the size of the litter was established. Furthermore, Figures 1 and 2 show that high variation existed between the different LOSS, but the classification by visual inspection of a dead piglet for cause of its death is not easy. Mostly, the piglets were crushed under the sow, but in the majority of cases the real circumstances of crushing were unclear. In addition, the repeatability of classifying the piglets losses in different causes between different persons would be low.
In the literature, little is known about the heritabilities of the different causes of piglet deaths or piglet development. Grandinson et al. (Reference Grandinson, Lund, Rydhmer and Strandberg2002) concluded from their results using a maternal model that mortality was influenced by the sow’s genes only and the direct effect of the piglet’s own genes was assumed to be negligible. In addition, the aim should be to breed for sows with a higher ability to take care of their litters. Hence, in this study the traits were defined as traits of the dams and the estimations were adjusted for both random uncorrelated effects, the effect of the litter and the effect of the sow. The piglets from two different litters will not share exactly the same additive genetic variance, but they are at least half sibs and the direct genetic effect of the piglets is very low. To accommodate, that the piglets were not from the same litter, the litter effect was used.
The treatment of the individual weights of the piglets as a trait of the sow is questionable, but previous studies have shown a higher maternal effect on the birth weight and relatively low direct genetic effects (Röhe and Kennedy, Reference Röhe and Kennedy1995; Van Arendonk et al., Reference van Arendonk, van Rosmeulen, Janss and Knol1996; Röhe, Reference Röhe1999).
The survival rate (SR) had a heritability of h 2 = 0.03. This agrees with analyses by Knol (2001). Grandinson et al. (Reference Grandinson, Lund, Rydhmer and Strandberg2002) estimated a heritability of h 2 = 0.05 for total mortality and h 2 = 0.06 for crushing. These heritabilities were slightly higher than estimated in this study. Van Arendonk et al. (Reference van Arendonk, van Rosmeulen, Janss and Knol1996) separated the direct genetic effect of piglet survival from the maternal effect. The estimates for the direct genetic effect were higher (h 2 = 0.11) than for the maternal component (h 2 = 0.09). In preliminary analysis of this dataset, treating the LOSS as traits of the piglet itself pointed in the same direction and estimates showed higher values of variance components (e.g. survival rate: h 2 = 0.09; crushing: h 2 = 0.07).
The higher heritability for the trait crushing early could be an indication that crushing by the sow at later times is more influenced by the environment and is not genetically determined.
The estimated heritabilities for individual birth weight agreed with specifications from Röhe (Reference Röhe1999) for the direct heritability after adjusting for litter size. The results were comparable due to the treatment as a trait of the sow. In addition to the two random uncorrelated effects, the direct variance of each individual piglet in the litter as well as competition among animals in the litter and the different litters were considered. Furthermore, litter size was indirectly implemented in the estimation as well. In the literature, the heritabilities for individual birth weight seemed to be lower than estimates for average birth weight (Rydhmer, Reference Rydhmer1992; Hermesch, 1996; Röhe, Reference Röhe1999). Nevertheless, the estimated values in the recent study for the individual birth weight were in the range of the literature as well as the estimates for the weaning weight (Hermesch, 1996; Högberg and Rydhmer, Reference Högberg and Rydhmer2000; Kaufmann et al., Reference Kaufmann, Hofer, Bidanel and Kunzi2000).
In conclusion, it could be stated that the first three days after parturition displayed the highest risk for piglets. With greater litter size at birth, the survival rate decreased and the chance of being crushed increased. The heritabilities for the different causes of piglet losses were all at a low level. Especially the very low additive genetic variances could be an indication that breeding directly against the different piglet losses would not be successful.
Fertility traits
The estimated heritabilities for the number of piglets born alive, born in total and number of stillborn piglets were in agreement with the literature (e.g. Röhe and Kennedy, Reference Röhe and Kennedy1995; Adamec and Johnson, Reference Adamec and Johnson1997; Crump et al., Reference Crump, Thomson, Haley and Mercer1997; Karsten et al., Reference Karsten, Röhe, Schulze, Looft and Kalm2000; Robinson and Quinton, 2002; Damgaard et al., Reference Damgaard, Rydhmer, Lovendahl and Grandinson2003). The genetic correlation between the number of piglets born alive and in total was at a high level with r g = 0.98. Röhe and Kennedy (Reference Röhe and Kennedy1995) stated that there is no need to implement the number of piglets born in total in the breeding target because of the risk of improvement beside the number of stillborn piglets. Robinson and Quinton (2002) estimated for the two breeds, the Landrace and the Yorkshire, genetic correlation between the number of piglets stillborn and born in total of r g = 0.50 and r g = 0.49, respectively. As a tendency, this correlation could be confirmed. The estimated correlations for litter size between parities were in the range of the literature (Knap et al., Reference Knap, van Alst, Versteeg and Kanis1993; Irgang et al., Reference Irgang, Fávero and Kennedy1994; Röhe and Kennedy, Reference Röhe and Kennedy1995; Tölle et al., Reference Tölle, Tholen, Trappmann and Stork1998; Hanenberg et al., Reference Hanenberg, Knol and Merks2001).
Genetic correlations between the LOSS and the fertility traits
Andersen et al. (Reference Andersen, Berg and Boe2005) stated that sows that did not crush any of their piglets within one lactation showed a more protective mothering style than sows that did crush several piglets. But these sows with fewer crushed piglets also had fewer piglets. This agreed with the genetic correlations given in Table 7 between the number of piglets born and the LOSS for crushing. With an increased number of piglets born alive or born in total, the chance of being crushed under the sow increased (r g = 0.30 up to 0.61), too. Due to the random litter effect, the estimation was already corrected for litter size. Furthermore, the chance of being crushed in the first three days of life was much greater. If only the heavier piglets were considered, the genetic relation between the traits of litter size and crushing decreased. With increased individual birth weight the probability of being crushed in the first three days of life decreased (r g = −0.13). So the chance of being crushed during the first three days after parturition depends on both the number of piglets in the litter and the individual birth weight of the piglet itself. In later lactation, the daily weight gain was also important for the survival as crushing and weaning weight were negatively correlated.
Högberg and Rydhmer (Reference Högberg and Rydhmer2000) pointed in the same direction. They found that the greater the litter size at birth, the more the piglets died, and if many piglets died in a litter, growth was underdeveloped in the piglets that survived. The genetic correlation between individual birth weight and survival rate was r g = 0.21, which agreed with the reported correlation in the literature (Högberg and Rydhmer, Reference Högberg and Rydhmer2000; Grandinson et al., Reference Grandinson, Lund, Rydhmer and Strandberg2002). The genetic background of the sow seems to have a larger influence on stillbirth than the genetic background of the litter (Leenhouwers et al., Reference Leenhouwers, Wissink, van der Lende, Parindaans and Knol2003). These general results could not be approved of here, but the result of Leenhouwers et al. (Reference Leenhouwers, Wissink, van der Lende, Parindaans and Knol2003) that litters with a higher genetic merit for farrowing survival had fewer piglets born in total agreed with results of this study. Early crushing was most strongly correlated with the number of stillborn piglets of the sow’s productivity traits. The correlation between the number of stillborn piglets and the survival rate was negative (r g = −0.54), which corresponds with the literature. Leenhouwers et al. (Reference Leenhouwers, Wissink, van der Lende, Parindaans and Knol2003) published that the total number of stillborn piglets per litter decreased with increasing genetic merit for farrowing survival. The results indicated a stronger maternal influence for the traits during parturition and early lactation as number of stillborn piglets, crushing early and underweight.
Increased individual birth weight correlated with increased survival rate of the piglets, which agreed with the reported correlation in the literature (Grandinson et al., Reference Grandinson, Lund, Rydhmer and Strandberg2002). Also a negative correlation was reported between crushing and birth weight by the authors (r g = −0.13 up to −0.49). Thus, sows with a high capacity for producing heavy piglets also crushed fewer piglets.
Due to the definition of the traits, the correlations of underweight and runting to the individual birth and weaning weights were very high, but the correlations to the number of piglets born alive and in total were high (r g = 0.47 up to 0.62), too. This could be an indication that with increasing number of piglets born or born in total, the competition among piglets rises and therefore the probability of being underweight at birth or of runting in further lactation increased as well. Between the number of stillborn piglets and underweight, the correlation was negative (r g = −0.57). So, with decreasing individual birth weight the stillbirth rate also decreased as lighter piglets had an easier parturition due to their body size and weight.
Conclusion
The genetic parameters found in this study indicate that improving reproduction traits is possible. Given an undesirable correlation between survival rate and number of piglets born, selection based on litter size only will increase piglet mortality. The results suggest that selection for sows with heavier piglets at birth might lead to a decrease in the number of crushed piglets but may not improve the overall survival rate. Due to lower phenotypic variances as well as the low additive genetic variance, a direct selection against differentiated causes of piglet losses will not be successful. Therefore, better knowledge about the maternal behaviour of the sows would be helpful.
Acknowledgements
This study was performed within the project ‘Muttereigenschaften von Sauen’ kindly financially supported by the ‘H. Wilhelm Schaumann Stiftung’. Thanks to the staff of ‘Spreizer GmbHCoKG, Hamet’, especially Mr Hartmut Nüsken for the support during the recording of the data.