I. INTRODUCTION
Grain refinement strengthening has been investigated widely because grain refinement can lead to high-strength materials without the addition of alloying elements.Reference Song, Ponge, Raabe, Speer and Matlock1–Reference Cheng, Chooa, Zhao, Wang, Zhu, Wang, Almer, Liaw, Jin and Lee9 When the grain size decreases, the yield strength and flow stress increase, as shown by the Hall–Petch equation,Reference Petch10–Reference Petch12
 $$\sigma = \sigma _0 + kD^{ - 1/2} \quad ,$$
where σ and D refer to the yield strength or flow stress and average grain size, respectively, and σ0 and k are constants. On the other hand, the uniform and total elongations decrease with decreasing grain size.Reference Song, Ponge, Raabe, Speer and Matlock1,Reference Tomota, Narui and Tsuchida7 In the case of steels, therefore, ultrafine-grained steels, which consist of an ultrafine-grained ferrite matrix and a second phase such as dispersed cementite,Reference Ohmori, Torizuka and Nagai13–Reference Tsuchida, Masuda, Harada, Fukaura, Tomota and Nagai15 martensite,Reference Okitsu, Takata and Tsuji16–Reference Calcagnotto, Ponge and Raabe20 or pearlite,Reference Tsuchida, Tomota and Nagai21 have been investigated with the aim of obtaining a larger uniform elongation. Not only the uniform elongation but also the deformation behavior up to fracture (including local deformation) should be considered for a more detailed discussion of grain refinement strengthening. The effect of the grain size on local deformation has been reported in terms of the reduction in areaReference Song, Ponge, Raabe, Speer and Matlock1,Reference Inoue and Kimura4 bending propertiesReference Miyata, Wakita, Fukushima and Tomida22 and local elongation.Reference Song, Ponge, Raabe, Speer and Matlock1 It is difficult to discuss local deformations solely in terms of the change in elongation on the basis of the conventional tensile properties because such local elongations are sensitive to the specimen size.Reference Dieter23,Reference Bridgman24 One approach to a discussion of the tensile deformation behavior up to the point just before fracture, including local deformations, is to consider the true stress (σ)–true strain (ε) relationship. Bridgman studied large plastic flow and fracture and proposed an approximate expression for the estimation of σ during local deformation after necking in round tensile specimens.Reference Bridgman24,Reference Bridgman25 After necking, ε can be estimated by using the minimum radius of the neck section. Marshall and ShawReference Marshall and Shaw26 demonstrated that the σ–ε relationships estimated by the Bridgman equation were independent of the neck profile radius. The triaxial state of stress in the notched section was calculated through finite element analysis to investigate the criterion of ductile crack initiation.Reference Kuwamura and Yamamoto27–Reference Hancock and Mackenzie29 The finite element method is favorable for a detailed investigation of the state of stress in the notched section. However, the σ–ε relationship estimated by the Bridgman equation will play an important role in the discussion of the macroscopic deformation behavior up to fracture, because it is a simple method, and the effects of strengthening mechanisms (including grain refinement strengthening) on the σ–ε relationship up to fracture have not been reported previously. Furthermore, the σ–ε relationship at high strains will also be associated with plastic working processes and bulk nanostructured metals that are fabricated through severe plastic deformation processes.Reference Lankford and Cohen30,Reference Inoue, Yin and Kimura31 In our previous study,Reference Tsuchida, Inoue and Enami32 an ultrafine-grained ferrite–cementite steel showed a better σ–ε relationship than other steels. Therefore, it is worth investigating in detail the effect of the grain size on the σ–ε relationship.
The aim of this study is to clarify the effect of grain size on the σ–ε relationship up to fracture in low carbon ferrite–cementite (FC) steels. Here, the FC steel means the ferrite microstructure with finely dispersed cementite particles and is relatively easier to obtain with varied ferrite grain sizes from submicron to over 10 μm.Reference Tsuchida, Masuda, Harada, Fukaura, Tomota and Nagai15 In this study, the limiting point or the point just before fracture, at which σ can be estimated by tensile tests and the Bridgman equation, is called the plastic deformation limit.Reference Tsuchida, Inoue and Enami32,Reference Enami and Nagai33 By using the experimental results of static tensile tests and stepwise tensile tests, σ–ε relationships up to the plastic deformation limit are estimated, and the grain refinement strengthening in the FC steels is discussed in terms of these relationships.
II. EXPERIMENTAL PROCEDURES
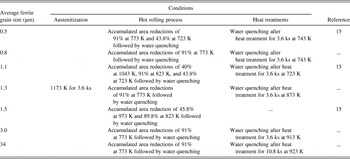
In the present study, FC steels with various ferrite grain sizes were prepared using a low carbon steel of JIS-SM490 (0.15C, 0.4Si, 1.5Mn, 0.014P, 0.004S in mass%) to investigate the grain-size dependence of the σ–ε relationship. By combining the multi-pass caliber rolling at warm temperatures and heat treatments,Reference Inoue, Yin, Kimura, Tsuzaki and Ochiai3,Reference Ohmori, Torizuka and Nagai13–Reference Tsuchida, Masuda, Harada, Fukaura, Tomota and Nagai15 the FC specimens with the average ferrite grain sizes between 0.5 and 34 μm were obtained. Details of the preparation of the FC specimens are summarized in Table I.Reference Tsuchida, Masuda, Harada, Fukaura, Tomota and Nagai15
Summary of the conditions to produce ferrite–cementite steels with various ferrite grain sizes investigated in the present study.

Microstructure observations of the FC steels were conducted through scanning electron microscopy (SEM) and electron back-scattering diffraction (EBSD). The average ferrite grain size was determined by the conventional linear-intercept method by using the SEM micrographs. The fracture surface and cross-sectional planes parallel to the tensile direction near the fracture surface in the specimens after the tensile tests were also observed by SEM.Reference Calcagnotto, Adachi, Ponge and Raabe18 Here, the samples of SEM observations for the cross-sectional planes parallel to the tensile direction were prepared by standard mechanical grinding and polishing procedures and final polishing using alumina polishing suspension. The samples were additionally etched in 5% Nital for about 10 s to reveal the microstructure.
Round tensile test specimens with a gage length of 25 mm and gage diameter of 3.5 mm were prepared from the steels, which were machined in the rolling direction. Static tensile tests were performed with an initial strain rate of 5 × 10⁻⁴ s−1 (constant crosshead speed of 0.0125 mm/s) at 296 K using a gear-driven-type Instron machine. The stepwise tensile tests were performed to measure the load (P), radius of the neck section (a), and radius of curvature of the neck profile (R) after the maximum load point with the same crosshead speed of 0.0125 mm/s. The stepwise tensile tests were conducted step by step in response to changes in P, and P, a, and R were measured during temporary stops from the maximum load point to fracture.Reference Marshall and Shaw26,Reference Tsuchida, Inoue and Enami32 In the measurements of R, the appearance of the neck profile was observed through a digital microscope, and the contour of the necked region was approximated by the arc of a circle. The change in the estimated σ by the measurement deviation of R was within about 10 MPa, and the reproducibility of the estimated σ–ε relationship was also investigated through experiments using several specimens.
The values of σ and ε can be calculated using the following equations in the uniform deformation range up to plastic instability:
 $$\sigma = s\left( {1 + e} \right)\quad ,$$
 $${\rm{\varepsilon }} = \ln \left( {1 + e} \right)\quad ,$$
where s and e are the nominal stress and nominal strain, respectively. Equations (2) and (3) are valid only while the deformation is uniform.Reference MacGregor34,Reference Hollomon35 The σ and ε values after the onset of necking are calculated from the following equations:
 $$\sigma = {P \over {\pi a^2 \,\left( {1 + {{2R} \over a}} \right)\log \left( {1 + {a \over {2R}}} \right)}}\quad ,$$
 $${\rm{\varepsilon }} = 2\ln {{a_0 } \over a}\quad ,$$
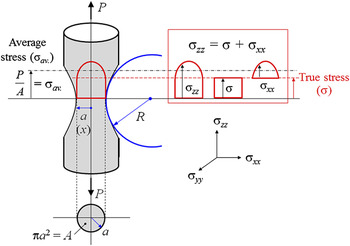
where a 0 is the initial radius of the cross section.Reference Bridgman25Equation (4) is an approximate expression proposed by Bridgman for round tensile specimens and is derived on the basis of several assumptions.Reference Bridgman24–Reference Marshall and Shaw26Figure 1 shows a schematic illustration of the stress distribution in the neck of a round tensile test specimen. In Fig. 2, σxx, σyy, and σzz are the true principal stresses in the radial, tangential, and axial directions, respectively, and σav. is the average stress, as follows:
 $$\sigma _{xx} = \sigma \log {{a^2 + 2aR - x^2 } \over {2aR}}\quad ,$$
 $$\sigma _{zz} = \sigma \left( {1 + \log {{a^2 + 2aR - x^2 } \over {2aR}}} \right)\quad ,$$
 $$\sigma _{{\rm{av}}{\rm{.}}} = {P \over {{\rm{\pi }}a^2 }}\quad .$$
Schematic illustration for stress distribution in the neck of a round tensile test specimen.

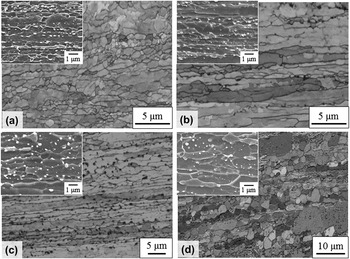
Image quality maps obtained by EBSD measurements and SEM micrographs of the ferrite–cementite specimens with the average ferrite grain sizes of 0.5 (a), 0.8 (b), 1.3 (c), and 3.0 μm (d).

Here, σxx is equal to σyy because of rotational symmetry about the longitudinal axis in the round test specimen, and x means the position in the radial direction. Details of the Bridgman equation are described elsewhere.Reference Bridgman24–Reference Marshall and Shaw26 It is possible to use Eqs. (4) and (5) to calculate σ and ε by using the values of P, a, and R obtained in the stepwise tensile tests.
III. RESULTS AND DISCUSSIONS
A. Static tensile properties
Figure 2 shows the image quality maps obtained by EBSD analysis and SEM micrographs along the rolling direction of the FC steels with average ferrite grain sizes of 0.5 (a), 0.8 (b), 1.3 (c), and 3.0 μm (d). It can be seen that elongated ferrite grains are aligned in the rolling direction.Reference Inoue, Yin, Kimura, Tsuzaki and Ochiai3,Reference Inoue and Kimura4 The average particle size of cementite is about 0.2 μm,Reference Ohmori, Torizuka and Nagai13–Reference Tsuchida, Masuda, Harada, Fukaura, Tomota and Nagai15 and the cementite volume fraction is a few percent. As seen in the SEM micrographs, the particle size of cementite increased slightly with an increase in the ferrite grain size.Reference Ohmori, Torizuka and Nagai13
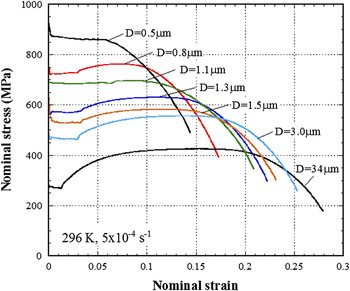
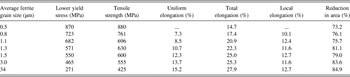
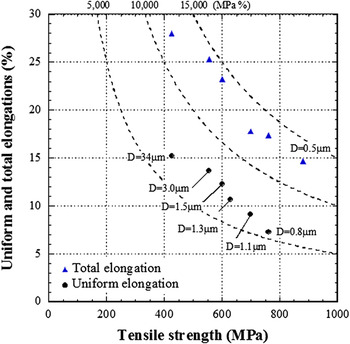
Figure 3 shows nominal stress–strain curves for the FC steels with various ferrite grain sizes. The mechanical properties are summarized in Table II. With a decrease in the average ferrite grain size, the lower yield stress and tensile strength increased, but the uniform and total elongations decreased.Reference Song, Ponge, Raabe, Speer and Matlock1 In the FC steel with an average ferrite grain size of 0.5 μm, the load decreased until rupture without work-hardening after the yield drop.Reference Tsuchida, Masuda, Harada, Fukaura, Tomota and Nagai15Figure 4 shows the tensile strength as a function of uniform and total elongations in the FC steels. The dashed lines in Fig. 4 are contour lines of the product of strength and elongation. The uniform and total elongations decreased with increasing tensile strength. The products of the tensile strength and uniform or total elongation were almost the same in Fig. 4. On the other hand, as seen in Table II, the local elongation of the FC steels was almost the same regardless of the grain size between 0.8 and 34 μm, and the reduction in area decreased slightly with decreasing grain size. In terms of the FC steel with the average ferrite grain size of 0.5 μm, the nominal stress decreased until rupture without work-hardening after the yield drop as seen in Fig. 3. The local elongation of the 0.5-μm FC specimen is expected to be smaller than those for other FC steels with ferrite grain sizes more than 1 μm from the effect of ferrite grain size on reduction in area.
Nominal stress–strain curves of the ferrite–cementite steels with various ferrite grain sizes obtained by static tensile tests with an initial strain rate of 5 × 10⁻⁴ s−1 at 296 K.

Mechanical properties obtained by static tensile tests in the ferrite–cementite steels with various average ferrite grain sizes.

Uniform and total elongations as a function of tensile strength in the ferrite–cementite steels.

B. Effect of grain size on true stress–true strain relationships up to the plastic deformation limit
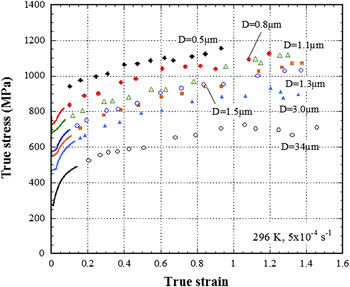
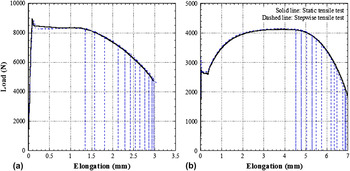
Figure 5 shows the estimated σ–ε relationships up to the plastic deformation limit, which were obtained from the stepwise tensile tests and the Bridgman equation for the FC steels. The curves in this figure were calculated using Eqs. (2) and (3), and the plots of σ and ε were estimated from Eqs. (4) and (5). It is possible to discuss the plastic deformation behavior over a wide range of ε by using the σ–ε relationships. Figure 6 shows load–elongation curves from the static and stepwise tensile tests in the FC specimens with the ferrite grain sizes of 0.5 (a) and 34 μm (b). The load–elongation curves were almost agreement between the static tensile test and the stepwise tensile test in the both specimens. In terms of the σ–ε relationships of FC steels, ε at the plastic deformation limit (εpdl) was approximately 1.4 and was almost constant in the FC steels with grain sizes larger than about 1 μm. However, when the average ferrite grain size was 0.5 μm, εpdl decreased abruptly to below 1.0. Such a grain-size dependence on ε is different from the effect of the grain size on the nominal stress–strain curves of the FC steels, in which the total elongation decreases with decreasing grain size.Reference Song, Ponge, Raabe, Speer and Matlock1,Reference Tsuchida, Masuda, Harada, Fukaura, Tomota and Nagai15 εpdl is associated with the reduction in area because both ε and the reduction in area are determined by a.Reference Bridgman25,Reference Marshall and Shaw26 Torizuka et al.Reference Torizuka, Muramatsu, Murty and Nagai14 reported that ultrafine-grained FC steels showed a better balance between the tensile strength and the reduction in area. This is associated with the σ–ε relationships as seen in Fig. 6, especially the large value of εpdl in the ultrafine-grained FC steels. The bending propertiesReference Miyata, Wakita, Fukushima and Tomida22 and the grain-size dependence of the local elongationReference Song, Ponge, Raabe, Speer and Matlock1 in ultrafine-grained steels are also correlated with the better relationships between σ and ε at the plastic deformation limit in the ultrafine-grained FC steels.
True stress–true strain relationships up until the plastic deformation limit in the ferrite–cementite steels with various average ferrite grain sizes obtained by stepwise tensile tests.

Load–elongation curves obtained by static and stepwise tensile tests in the ferrite–cementite steels with average ferrite grain sizes of 0.5 (a) and 34 μm (b).

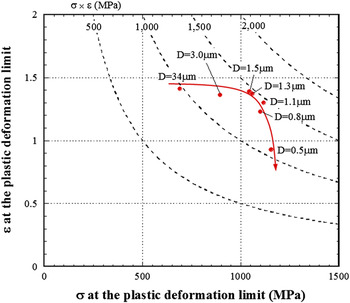
Figure 7 shows the relationships between σ at the plastic deformation limit (σpdl) and εpdl in the FC steels. The contour lines of the product of σpdl and εpdl are shown in this figure. In terms of the effect of the average ferrite grain size on σpdl and εpdl in the FC steels, εpdl decreased from 1.4 to 1.2, and σpdl became approximately 1.6 times larger with a decrease in grain size from 34 to 0.8 μm. The products of σpdl and εpdl for the FC steels also increased with decreasing average ferrite grain size (down to 0.8 μm). However, the εpdl value of the FC steel with an average ferrite grain size of 0.5 μm was less than about 1.0. In the present FC steels, only the grain-size dependence of the σ–ε relationship can be discussed because the volume fractions of dispersed cementite and the cementite particle size are almost the same. Therefore, it is concluded that grain refinement strengthening up to an average grain size of 0.8 μm can improve σ and ε in the present low carbon FC steels.
Relationships between true stress and true strain at the plastic deformation limit in the ferrite–cementite steels with various average ferrite grain sizes.

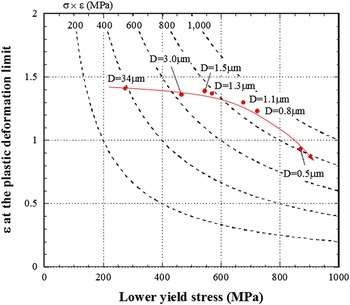
Figure 8 shows εpdl as a function of lower yield stress in the FC steels. The effect of grain size on the lower yield stress–εpdl relationships is similar to that on the σpdl–εpdl relationships. However, the product of the lower yield stress and εpdl of the FC steel with an average ferrite grain size of 0.5 μm was almost the same as for those of FC steels with grain sizes of about 1 μm, whereas that of σpdl and εpdl for the 0.5-μm FC steel was much lower (Fig. 7). This fact is responsible for the difference in k in Eq. (1) between the lower yield stress and σpdl.Reference Tsuchida, Masuda, Harada, Fukaura, Tomota and Nagai15 It is noted here that the relationship between σ and ε leads to a large change in strength in the case of a discussion of grain refinement strengthening by using the σ–ε relationship up to the plastic deformation limit.
True strain at the plastic deformation limit as a function of lower yield stress in the ferrite–cementite steels with various average ferrite grain sizes.

C. Plastic deformation limits in the ferrite–cementite steels
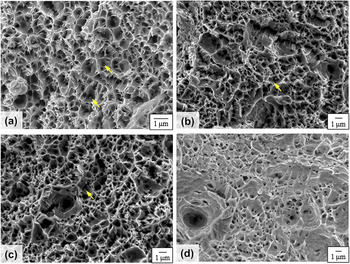
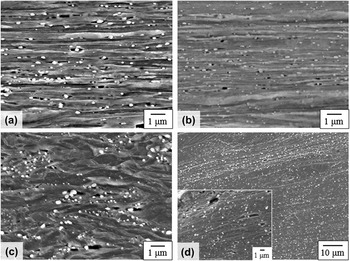
As seen in Table II, the reduction in area of the FC steels decreased with decreasing grain size, although it is not a marked decrease in the grain range of 0.5 and 34 μm. Figure 9 shows the fracture surfaces in the FC steels with grain sizes of 0.5 (a), 0.8 (b), 1.1 (c), and 34 μm (d). Most dimples were less than 1 μm regardless of the initial ferrite grain size, and cementite was observed at the bottom of some of the dimples (arrows in Fig. 9).Reference Inoue and Kinoshita36Figure 10 shows SEM micrographs of the cross-sectional planes parallel to the tensile direction near the fracture surface in the FC steels with average ferrite grain sizes of 0.5 (a), 0.8 (b), 1.1 (c), and 34 μm (d). The horizontal axis shows the tensile direction. It is seen that the ferrite is elongated in the tensile direction and the cementite is hardly deformed.Reference Inoue and Kinoshita36–Reference Kozasu, Shimizu and Kubota38 Voids can be observed at the interface between the ferrite and cementite or around the cementite. On careful examination of these micrographs, the voids can be observed in the case where the thickness of the elongated ferrite becomes less than the particle size of the cementite during the tensile deformation in Figs. 10(a)–10(c). In the 34-μm FC specimen [Fig. 10(d)], the voids were observed around the cementite within the elongated ferrite. The size of the voids in Fig. 10 was almost coincident with the dimple size in Fig. 9. The experimental result that cementite is observed in some of the dimples also implies that voids are produced near the cementite. From these observations, the dispersed cementite is closely associated with the initiation of voids in the tensile deformation of FC steels.Reference Inoue and Kinoshita36,Reference Kozasu, Shimizu and Kubota38 In the present study, the volume fractions of cementite and the cementite particle size were almost the same; only ferrite was deformed, and cementite was hardly deformed. Therefore, when the thickness of elongated ferrite comes close to the cementite particle size, voids tend to occur at the interface between the ferrite and cementite. This seems to become pronounced in the case of ultrafine-grained ferrite with grain sizes of less than 1 μm, which is close to the cementite particle size. That is, the limit at which ferrite can be elongated or deformed is controlled by the particle size of the dispersed cementite in the FC steels. The decrease in ε at the plastic deformation limit for the present FC steel with a grain size of 0.5 μm can be explained in this manner. From SEM observations of the fracture surface and the cross-sectional planes parallel to the tensile direction near the fracture surface, it was found that cementite plays an important role in void nucleation in the FC steels. The effect of grain size on local elongation in the FC steels as described in Sec. III. A can be also discussed by the σ–ε relationships up to the plastic deformation limit. That is, the grain size dependence on εpdl as seen in Fig. 7 is expected to be related with the decrease of local elongation in the ultrafine-grained FC steels with ferrite grain sizes less than 1 μm. And this ascribed the relationship between the elongated ferrite and the cementite particle size or the role of dispersed cementite in the FC steels as seen in Fig. 10. Consequently, the σ–ε relationship up to the plastic deformation limit is one of the important data to discuss the local deformation behavior.
Fracture surfaces in the ferrite–cementite steels with average ferrite grain sizes of 0.5 (a), 0.8 (b), 1.1 (c), and 34 μm (d).

SEM micrographs of the cross-sectional planes parallel to the tensile direction near fracture surface in the ferrite–cementite steels with average ferrite grain sizes of 0.5 (a), 0.8 (b), 1.1 (c), and 34 μm (d).

IV. CONCLUSIONS
In this study, static tensile tests were performed at room temperature by using ferrite–cementite (FC) steels with various average ferrite grain sizes, obtained from low carbon (JIS-SM490) steel. The tensile deformation behavior was discussed in terms of the true stress (σ)–true strain (ε) relationships up to the plastic deformation limit, which were estimated using stepwise tensile tests and the Bridgman equation. The following conclusions were obtained from this study.
(1) In the static tensile tests on the FC steels, the lower yield stress and tensile strength increased and the uniform and total elongations decreased with a decrease in the average ferrite grain size. The local elongation of the FC steels was almost the same regardless of the grain size between 0.8 and 34 μm.
(2) From the σ–ε relationships up to the plastic deformation limit for the FC steels, the true strain at the plastic deformation limit (εpdl) was approximately 1.4 for grain sizes of more than 0.8 μm, and σ increased with decreasing ferrite grain size. However, εpdl decreased markedly when the average ferrite grain size was 0.5 μm. Therefore, grain refinement strengthening up to an average ferrite grain size of 0.8 μm can improve σ and ε at the plastic deformation limit in the present low carbon FC steel.
(3) In the plastic deformation behavior of the present FC steels, the size of cementite is associated with void nucleation. In the FC steels, when the thickness of the elongated ferrite approached the particle size of the dispersed cementite, voids could be observed at the interface between ferrite and cementite.
ACKNOWLEDGMENTS
The authors are grateful to Professor J. Yanagimoto of The University of Tokyo, Dr. A. Yanagida of Tokyo Denki University, Dr. R. Ueji of Kagawa University, and Mr. S. Ueno of University of Hyogo for their help and valuable discussions. This study was supported financially by a Grant-in-Aid for Scientific Research on Innovative Area, “Bulk Nanostructured Metals,” through MEXT, Japan (Contract No. 22102005), and the support is greatly appreciated.