
Introduction
In the current financial climate it has never been more important for libraries to demonstrate how valuable they are. Whilst many people might argue that gathering and analysing statistics is a time-consuming task with little reward, being able to demonstrate the value that a library service provides to its users should be a priority. Historically there have always been methods by which libraries and information services have gathered information on usage and then developed their services. Traditionally these measurements have been tangible, for instance the number of items issued by a library management system. Although such figures are useful, what value to the organisation does this actually demonstrate, and how does it help you to develop your service? Increasingly information managers are looking at using new metrics to meet the changing demands of their organisation. It is some of these methods of capturing metrics that I will be discussing.
What are metrics?
What's the first thing that comes to mind when you think of metrics? Is it weights and measuresFootnote 1 or gathering and analysing statistics? If you're anything like me, probably the former! Metrics as a term simply isn't used widely within libraries, but most people are dealing with them on a daily basis. So what does “metrics” actually mean?
Unfortunately there isn't a simple definition but, when you think about any sort of analysis, you would normally think about numbers or statistics. The process of collecting these numbers and making them meaningful is metrics. Metrics can be a practical management tool, which can help assess effectiveness as a means of highlighting user satisfaction and to support applications for additional resources or funding.
Qualitative v quantitative data
Much of the debate around metrics will centre on whether you should be collecting quantitative or qualitative data. Quantitative data is data in numerical form, for example the total number of enquiries logged during a month. Qualitative data is usually presented in words, for example a description of a service or an analysis of how well an enquiry was answered.
Compared to quantitative data, qualitative date is usually seen as richer and more vital, as having greater depth and more likely to present a true picture of a service or department overall, but qualitative data usually provides a fuller picture.
Statistics and reports
Statistics can be great at showing what value you provide, and how you can develop your service, but only if you are able to manipulate the data collated to show trends and changes in the way your service is used and how this has an impact on the business you serve.
You probably already record transactional information like the number of items issued, books ordered and enquiries answered, but to understand how this affects your service and how you can use these statistics to improve your service you need to combine these “raw” quantitative statistics with other information. For example, you may record the number of enquiries answered, but can you easily break this down by department, member of staff, time of day or the sources used to answer the enquiry? Being able to interrogate your data like this will over time show you changes in the number of enquiries logged, who is really using your service, what services are being used and so support any future requests for resources.
At CMS Cameron McKenna LLP we use a system called HEAT to record all enquiries logged by the central research service (the exchange). In addition to the exchange, the IT support desk, the Business Analysis (BA) Team and the Human Resources (HR) Department use HEAT.
The decision to use HEAT as a tool to record enquiries and produce detailed statistics centred on several key benefits:
• HEAT is linked to our HR system so that the user's department, job title and contact details are automatically populated.
• We could tailor HEAT so that enquiries could be logged using a specific set of research and sub-research types.
• The IT Department were already using Crystal Reports to interrogate the enquiries logged on HEAT.
• We could create a set of codes for recording calls logged by clients.
These client calls are a growing and important area of work for the team so being able to show how many calls we receive from clients and details of which client contacts are using us is crucial. The statistics we produce on client calls are subsequently included in a Monthly and Quarterly Client Report. This demonstrates to the Client, and to the internal Client Service Team what “added value” we have provided.
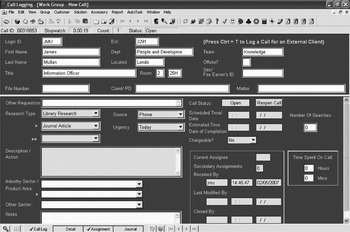
HEAT Call Logging – Call Log Screen

As part of the enquiry logging process, the time the call was received and closed is recorded automatically and, most importantly, the time spent on the call is always recorded. This has helped us identify which practice groups are our heaviest users. Counting the total number of enquiries may not be an accurate reflection of a practice group's usage if all of their enquiries take 45 minutes rather then 5 minutes. Calls are also recorded as being chargeable or non-chargeable. Chargeable calls are normally recorded against a file number and will eventually be charged to the client. Being able to demonstrate that we are creating revenue for the firm is an important part of the work we do.
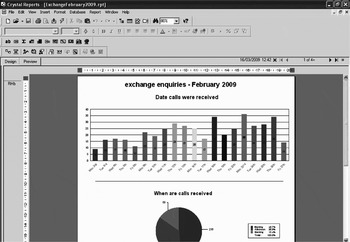
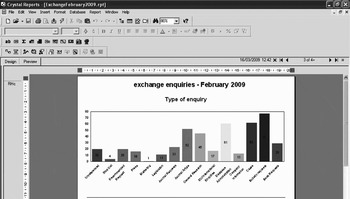
The exchange then uses a reporting tool called Crystal Reports to produce a report, which details calls logged during the preceding month. Of note is that nowhere in this report is the total number of enquiries for the month displayed. This figure could be calculated, but a decision was taken not to include it, as it doesn't provide much value on its own. Instead the enquiries are broken down by how they are received (email, in person, phone), When (morning, afternoon, evening) and from whom (partner, assistant, trainee). Very quickly it became clear that some of our preconceptions were wrong, notably that we believed the majority of our enquiries came from trainees when in fact the enquiries logged by trainees and assistants are almost equal.
Crystal Reports – Screenshot – exchange enquiries February 2009

A number of other law firms have started using off-the-shelf or custom-built applications to log enquiries and produce reports on usage.Footnote 2 I would expect to see an increase in the use of these tools. In the United States a long running project called LibStatsFootnote 3 has created a tool that allows library managers to produce detailed statistics on what enquiries they are answering and the time they are taking.
Crystal Reports – Screenshot – exchange enquiries February 2009

Monitoring electronic services
Accurate reports on the usage of your electronic products are particularly important when allocating budgets and developing your services, because of the high cost associated with most electronic services.
Reports on what value is being delivered by electronic services will always be of value when negotiating budgets but until recently there were few tools available to collate information from a wide range of electronic services. Nowadays vendors of these electronic services have started providing monitoring tools, but the statistics produced can be unwieldy and meaningless unless a lot of analysis is applied. Independent companies have also started producing monitoring tools An example is OnelogFootnote 4. Onelog is a web-based management tool that will log a user on to an internal system once and will connect them seamlessly to all other systems. Onelog also allows library managers to review usage on individual titles, enabling them to make informed choices about renewals of electronic products. 7Side produce Research MonitorFootnote 5 which automatically captures client and user information, as they use the electronic service, thus ensuring that any cost associated with the service is applied. The Spring 2009 issue of LIM includes a very through reviewFootnote 6 of Research Monitor by Dunstan Speight, which is a good starting point if you're considering this product.
Gathering usage statistics on electronic products can also be useful for measuring the organisation's Return on Investment (ROI) in these products, as well as for analysing training needs by reviewing who is, and who isn't, using the products. Gathering and analysing usage of these products has become even more important in the current financial climate. As organisations look to cut expenses, one of the obvious ways to save money is by cutting the number of electronic subscriptions. So using a tool like Research Monitor or OneLog allows library managers to demonstrate the value (or not) of these subscriptions.
Key performance indicators
Key performance indicators, also known as KPI's, can help a service or organisation define and measure its progress towards goals. Key performance indicators are quantifiable targets, agreed to in advance, which reflect success factors. KPI's are not statistics, but a combination of statistics and the setting of targets, making them potentially a very powerful measurement of your service.
A service may have a key performance indicator that it will answer all enquiries within 24 hours, or that it will aim to answer x number of enquiries for a particular department. The key to using performance indicators successfully is to avoid measuring too much, or to start measuring things that aren't important to management.
You also need to ensure that you look at less obvious data. For example, setting a target of x days absence per person may not appear obvious to a library manager, but it might to anyone scrutinising the reports. The British Library has an excellent example of a KPI report available on its websiteFootnote 7 and I would recommend looking at this if you want to see how KPI's can be used in practice.
Overall key performance indicators are excellent at demonstrating the activity of your service and have the advantage of being measurable, so should more readily impress management, but they will not show how “good” your service is. To measure this you would need to gather qualitative data. One way of doing this is to look at the use of your service by a customer and measure the degree of satisfaction with the outcome using another tool - “surveys.”
Customer surveys
It's vital for any organisation or department to monitor its client base (both internal and external clients). Surveys can be a useful way of doing this and will reveal trends in usage and other important information such as how happy your users are with your enquiry service; the staff that answer their enquiries; your current awareness services, or whatever aspect of the department you would like to review.
Gone are the days when most surveys would mean creating a word document and either distributing it in paper form or via email. Nowadays most surveys will use web based software like Survey MonkeyFootnote 8, Question ProFootnote 9 and Wufoo.Footnote 10 These web based surveys allow you to design, collect and analyse the data and will generally mean a better response rate from your users, because they are more convenient to use.
Before you think about sending out a survey, you should always test it against a few people for clarity, and to ensure it works correctly. When sending your survey you should always explain why you are asking a user to complete it and, where possible, give an indication of the time it is likely to take to complete. Successful surveys will normally only take 5 or 10 minutes to fill in. The questions should be clear and avoid jargon that you might use like “SDI” or terms used to describe technology like “RSS”. From experience, anonymity has always been a useful way to encourage more “honest” responses. However, simply designing the survey and distributing it is only half of the task.
“To demonstrate your value be sure to publish the results soon after in summary and outline what they mean. This is your opportunity to explain things, show off what you have done (especially if you are showing a comparative improvement on a previous survey) and get support for what you would like to do in response to issues” (Maxwell).Footnote 11
Finally you should ensure that any survey you organise is sent out in a timely manner. Running a training course in January and then asking for feedback in May will either result in no responses or limited responses.
Measuring knowledge management (KM) and social media usage
One of the most significant developments in recent years relates to how metrics are used to record and gather usage of KM and social media applications. There are a number of problems with trying to record how “valuable” or “well used” these tools are. With KM tools, recording how many “hits” you had on a particular page on an intranet, or the number of times a document is accessed, simply isn't going to be useful. It could well be that the most viewed page on your intranet is the homepage or the menu for the restaurant, but what does this demonstrate to management? Measuring the usage of these tools is usually less about numbers and more about the benefits associated with using them. So, if you're looking at how you can measure the value of KM tools, you'll probably want to look at some of the following; time saved, quality of documents, ease of use, coverage, precision, relevance and reliability.
Thankfully there are also a number of tools available that can assist with the measurement of these applications. These include The Balanced ScorecardFootnote 12 and The Skandia NavigatorFootnote 13. There are also a number of vendors who will work with libraries to identify the benefits of using their KM tools. These companies include MetastormFootnote 14 TikitFootnote 15 OpentextFootnote 16 InterwovenFootnote 17 and Puretech Marketing.Footnote 18
Measuring the use and value of social media tools, like blogs and wikis, can also be an extremely difficult task. This is primarily because of the way these tools are built around technologies like AjaxFootnote 19 and FlashFootnote 20. These two technologies allow users to do everything they might need to do on a website on a single page. This eliminates the need for users to move between pages. The downside to this is that traditional methods of measuring website usage (page clicks) become obsolete because users aren't navigating to other pages. Social media tools aren't an exception to the rule when it comes to thinking about what you should be measuring. They do however make it slightly more difficult. For example, if your team writes to a blog, should you be recording the number of posts that have been written, the number of comments or even the number of subscribers? If you're using a wiki should you record the total number of pages created, or the number of times a page has been edited? Like all the techniques described earlier in this article, determining what you want to measure from the outset will make this a lot easier.
Conclusion
Metrics and the tools available to librarians and information managers have come a long way, but they are still subject to abuse (or misuse) The “Ten best ways to lie with metrics”Footnote 21 provides examples of how you can manipulate metrics so they look and feel good, rather than providing an accurate picture. The use of metrics is more widespread now and although there are many tools and methods by which to gather them, their collection in some areas remains difficult, notably when trying to measure knowledge management projects and initiatives, and when measuring the use and value of social media tools, like blogs and wikis.
Metrics will always be important when developing and justifying services, as well as helping to identify what you are doing well and not so well. Ultimately, when deciding on a set of metrics, you should ensure that they will measure something that is important to your organisation and that they can be measured accurately, consistently and efficiently. You should also always think carefully about what you are measuring and why, how does this help improve your service and are you measuring the right things?
Biography
James Mullan is an information officer at CMS Cameron McKenna and the BIALL Blog Administrator.