1. Introduction
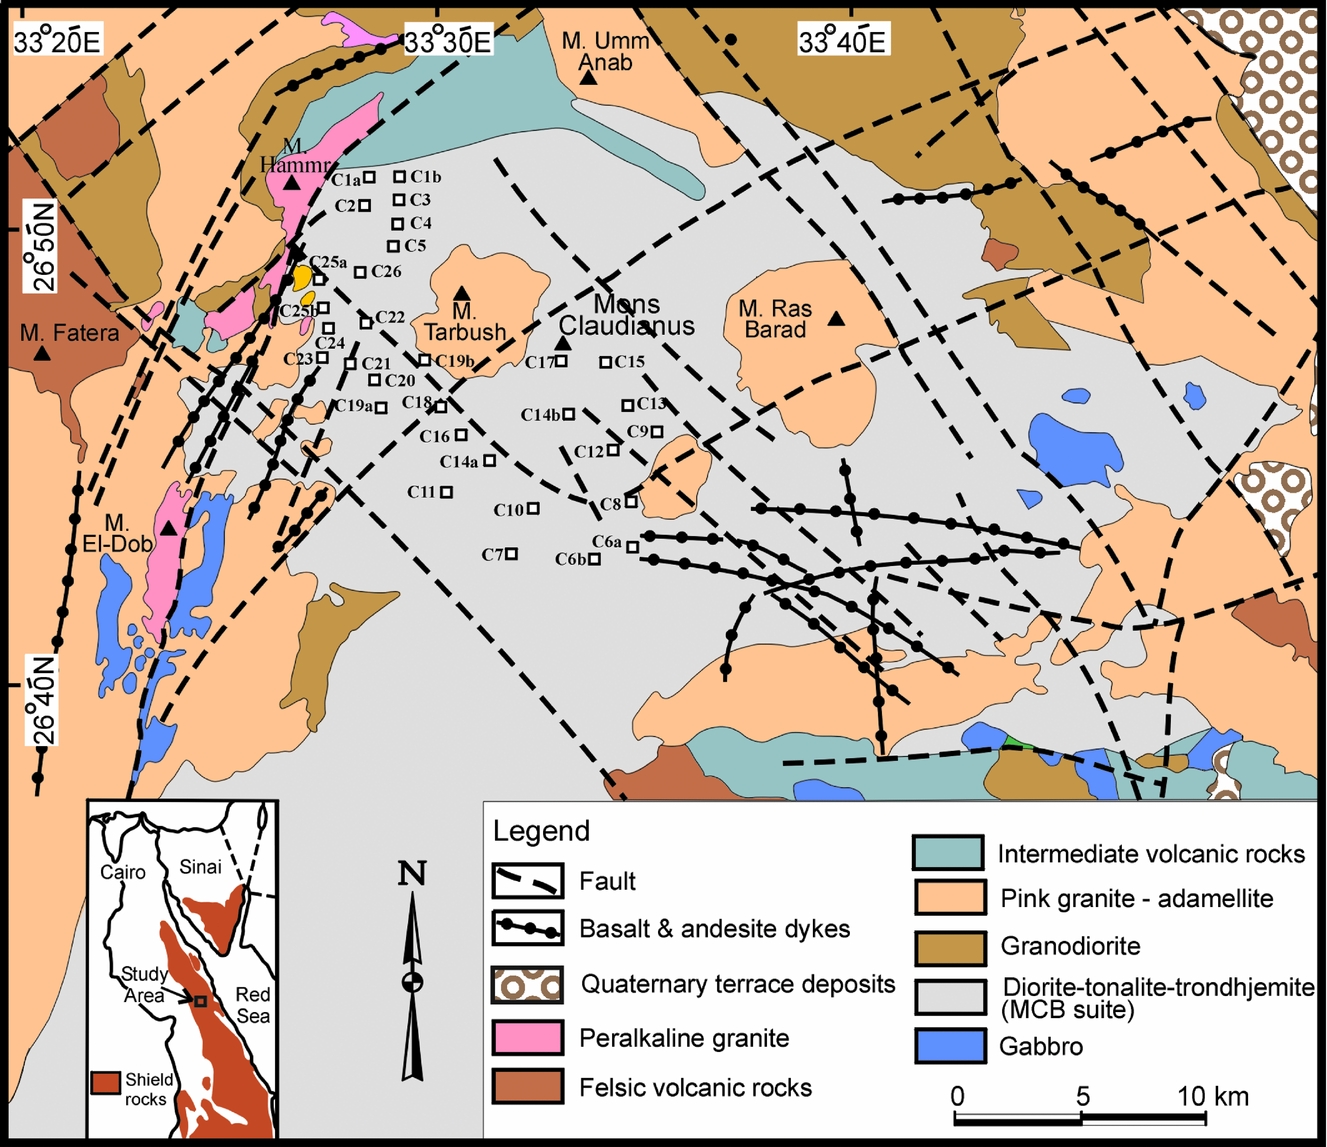
Pan-African Neoproterozoic terrains including the Egyptian crystalline belt represent valuable archives of what has been considered one of the most remarkable geologic episodes in all of Earth's history (e.g. Hoffman, Reference Hoffman1999; Meert & Lieberman, Reference Meert and Lieberman2008). Despite a renewed surge of research activities that continuously improve knowledge on the age and geologic evolution of these terrains, they remain poorly investigated and weakly documented (Dalziel, Reference Dalziel1997; Tucker et al. Reference Tucker, Ashwal, Handke, Hamilton, Le Grange and Rambeloson1999), and their relative inaccessibility still represents a major research obstacle. A typical tonalite–trondhjemite–granodiorite (TTG) suite has been identified at the Mons Claudianus Batholith (MCB) of eastern Egypt (Fig. 1). This and similar large Pan-African batholiths form the core of the Nubian Shield, which was separated from the Arabian Shield in Saudi Arabia by the Red Sea rift valley around 23 Ma ago.
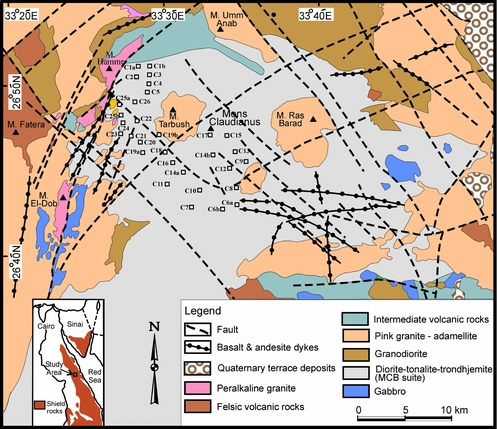
(a) Geological map of the region containing the Mons Claudianus Batholith (MCB) located in eastern Egypt. The map is modified from A. A. Zalata (unpub. Ph.D. thesis, Assiut University, 1972) and El-Ramly (Reference El-Ramly1972). Sample locations are marked by squares. Inset is a location map.
The Arabian–Nubian Shield is one of the main geologic provinces of the Pan-African mobile belt that girdles Africa, and forms its largest crustal segment (e.g. Abdel-Rahman, Reference Abdel-Rahman1995). Moreover, this shield represents one of the most well-preserved Neoproterozoic crustal segments worldwide. Several studies have been carried out on some igneous complexes within the Egyptian part of this shield (e.g. Abdel-Rahman & Martin, Reference Abdel-Rahman and Martin1987; Abdel-Rahman, Reference Abdel-Rahman1990, Reference Abdel-Rahman1995, Reference Abdel-Rahman1996, Reference Abdel-Rahman2010, Reference Abdel-Rahman2016; El-Shazly & El-Sayed, Reference El-Shazly and El-Sayed2000; Eliwa, Kimura & Itaya, Reference Eliwa, Kimura and Itaya2006; Abdel-Rahman et al. Reference Abdel-Rahman, Ploat, Dilek, Fryer, El-Sharkawy and Sakran2009; Maurice, Basta & Khiamy, Reference Maurice, Basta and Khiamy2012). However, many such complexes, including the MCB, have not been studied in detail, and modern geochemical data are generally scarce. The aim of this contribution is to provide petrological–geochemical and isotopic data on this batholith, determine its age of crystallization, assess the petrogenetic processes involved and glean information on its role in Neoproterozoic shield evolution during Gondwana assembly in the context of the regional geodynamic framework. Since most TTGs worldwide are of Archaean to Palaeoproterozoic age, Neoproterozoic TTG suites are somewhat rare, and, to date, no studies on Neoproterozoic TTGs from the Arabian–Nubian Shield or from other African mobile belts have been reported in the literature. As TTG lithologies are the most voluminous crustal component, forming c. 50 %, of preserved Archaean terrains (e.g. Barker, Reference Barker and Barker1979; Martin, Reference Martin1987; Souza et al. Reference Souza, Potrel, Lafon, Althoff, Pimentel, Dall'Agnol and Oliveira2001; Condie, Reference Condie2005; Moyen et al. Reference Moyen, Stevens, Kisters, Belcher, Van Kranendonk, Smithies and Bennet2007; Almeida et al. Reference Almeida, Dall'Agnol, Oliveira, Macambirab, Pimenteld, Rämöe, Guimarãesa and Leite2011; Almeida, Dall'Agnol & Rocha, Reference Almeida, Dall'Agnol and Rocha2017), this geochemical/petrogenetic study will contribute to our knowledge on the origin and early evolution of continental masses.
2. Geological setting and nature of the batholith
Shield rocks that make up most of the Pan-African crustal slab of NE Africa and Arabia consist predominantly of syn- to late-orogenic (~750–520 Ma) unmetamorphosed plutonic and coeval volcanic assemblages. These occur within a mobile belt representing accreted terrains extending from Mozambique, Madagascar, Sudan and Yemen, northwards into western Arabia, eastern Egypt, Sinai and Jordan. Lithologies of this vast mobile belt include diorite–tonalite assemblages of batholithic dimensions, large volcanic-arc andesitic–dacitic sequences, as well as voluminous calc-alkaline granodiorite–granite complexes intruded into older (~950–750 Ma) metasedimentary/metavolcanic assemblages, migmatites, serpentinites, meta-gabbros and ophiolitic masses (e.g. Abdel–Rahman, Reference Abdel-Rahman1995, Reference Abdel-Rahman1996; Blasband et al. Reference Blasband, White, Broijmans, De Boorder and Visser2000; Johnson & Woldehaimanot, Reference Johnson, Woldehaimanot, Blundell, Neubauer and von Quadt2003; Abdel-Rahman et al. Reference Abdel-Rahman, Ploat, Dilek, Fryer, El-Sharkawy and Sakran2009; El-Bialy, Reference El-Bialy2013). As a result of the East African orogeny, subduction and piling of thrust sheets were probably the principal processes of crustal accretion in East Africa and Arabia during the Neoproterozoic. Upon the termination of this orogeny (~520 Ma), a prolonged episode of anorogenic magmatic activity occurred, spanning nearly the entire Phanerozoic era (i.e. between the waning stages of this orogeny and the opening of the Red Sea some 23 Ma ago). During this extensional tectonic episode, several hundred alkaline complexes were emplaced into the Pan-African crust of East Africa and Arabia (e.g. Cahen et al. Reference Cahen, Snelling, Delhal and Vail1984; El-Ramly & Hussein, Reference El-Ramly and Hussein1985; Harris, Reference Harris1985; Vail, Reference Vail1985; Abdel-Rahman & Martin, Reference Abdel-Rahman and Martin1990; Landoll, Foland & Henderson, Reference Landoll, Foland and Henderson1994; Frisch & Abdel–Rahman, Reference Frisch and Abdel-Rahman1999; Abdel-Rahman & El-Kibbi, Reference Abdel-Rahman and El-Kibbi2001; Abdel-Rahman, Reference Abdel-Rahman2006).
Previous work on the MCB consists of regional geological mapping and broad field characterization of a large area that includes this batholith. The region was first mentioned by Hume (Reference Hume1934), who indicated that the area is composed of quartz–diorite and coarse granite. Schuermann (Reference Schuermann1966), El-Ramly (Reference El-Ramly1972) and A. A. Zalata (unpub. Ph.D. thesis, Assiut University, 1972) have mapped some areas of eastern Egypt within which the MCB is included. According to those authors, the region is covered by older ‘grey’ granites and ‘Dokhan’-type calc-alkaline volcanics, intruded by pink, ‘Qattar’-type ‘Younger’ granites, and these lithologies are intersected by fault planes and post-granite dykes. Recently, Abdel-Rahman (Reference Abdel-Rahman2016) presented a detailed study on the mineralogy of the MCB, but not much geochemical or isotopic data is available on this batholith, and its petrogenetic evolution has not been investigated in any detail.
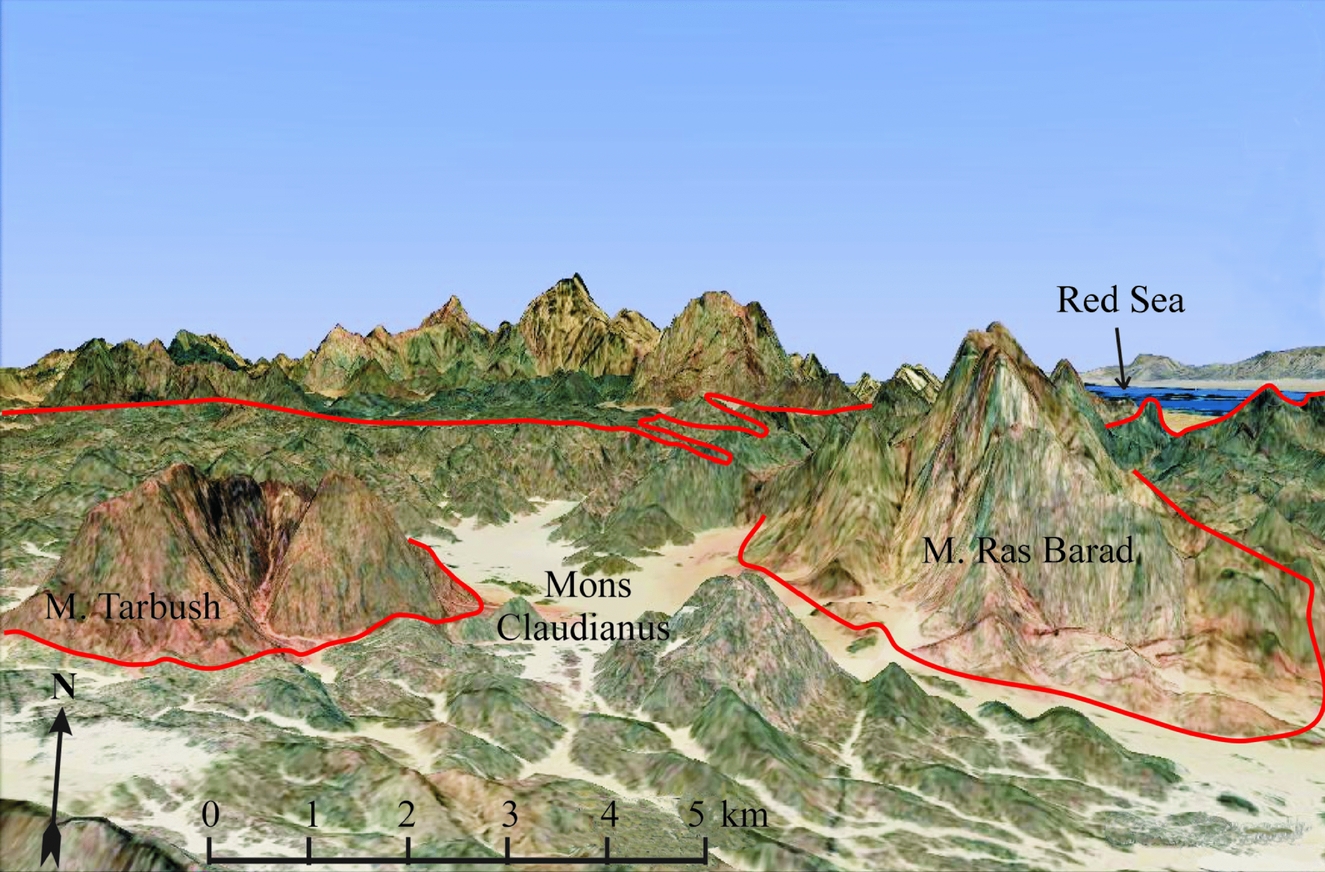
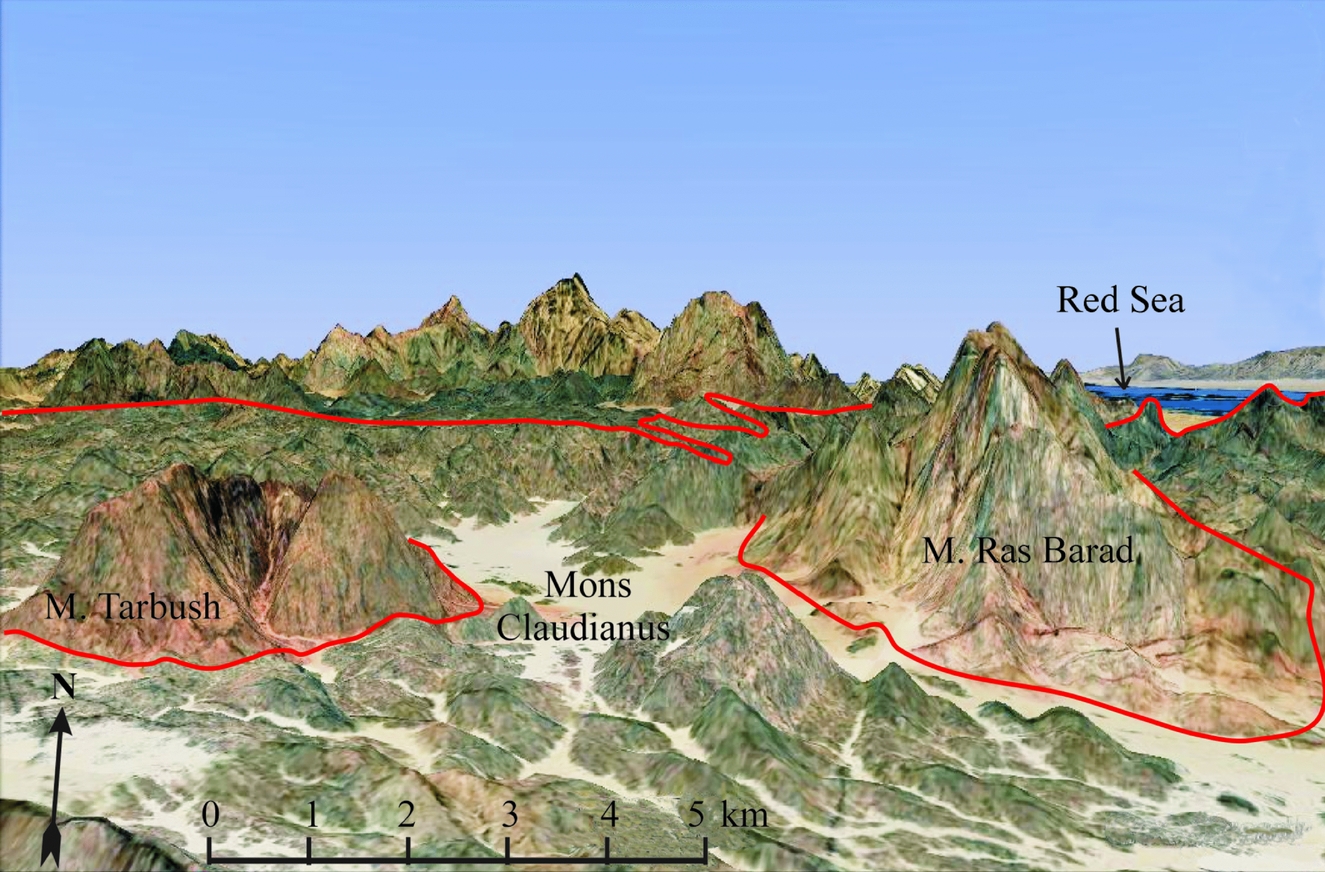
The MCB is a large magmatic body covering an area of c. 1,200 km2, that is located in the central part of the Eastern Desert of Egypt some 30 km west of the Red Sea (26° 45ʹʹ N,33° 35ʹ E; Fig. 1). The batholith intrudes older Pan-African gabbroic host rocks, remnants of which are present at its eastern and western margins. Due to the lack of vegetation and overburden, the MCB is well exposed and forms continuous outcrops dissected by sand-filled valleys (Fig. 2) that run predominantly along fault planes. It was intruded by several younger Pan-African plutonic and volcanic complexes, and by anorogenic peralkaline granitic plutons that are typically distinguished by a youthful topographic (elevated) appearance. In sharp contrast, the investigated batholith forms low-lying, deeply eroded terrains (Fig. 2) cross-cut by several dykes and fault planes. It is made up essentially of monotonous, greyish-white, medium- to coarse-grained, non-porphyritic massive rocks. Rare magmatic flow bands defined by biotite and amphibole alignment have been observed near the northwestern margin of the batholith, but this might also be related to shearing that occurred near that margin.
Satellite image of the northern part of the Mons Claudianus Batholith (MCB), with its characteristic greyish outcrops and low-lying, deeply eroded terrains that are dissected by sand-filled valleys, and intruded by ‘Younger’ pink granite–adamellite (Mounts Tarbush and Ras Barad) displaying a more youthful topographic (elevated) appearance. The high mountains in the background behind the northern boundary (shown in red) of the MCB contain ‘Dokhan-type’ intermediate volcanics, as well as pink granite–adamellite rocks. The MCB, occurring c. 30 km west of the Red Sea, is well exposed due to lack of vegetation and overburden.
3. Petrography
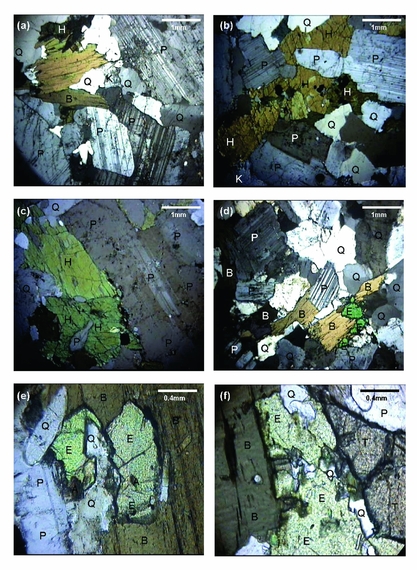
Rocks of the MCB are hypidiomorphic, granular to inequigranular, and non-porphyritic, with their mafic minerals occupying the interstitial space between crystals of plagioclase (Fig. 3). These rocks consist of variable contents of plagioclase (55–40 vol. %), K-feldspar (15–5 vol. %), quartz (30–18 vol. %), amphibole (15–3 vol. %), biotite (12–2 vol. %), epidote (3–1 vol. %), opaque Fe–Ti oxides (2 vol. %), and traces of accessory titanite, zircon, apatite and allanite. Plagioclase is the most abundant mineral phase and occurs predominantly as idiomorphic grains, whereas K-feldspar constitutes a somewhat minor component of the investigated rocks, forming allotriomorphic perthitic grains. Amphibole forms predominantly hypidiomorphic large grains (Fig. 3b, c) occasionally containing inclusions of quartz, titanite, magnetite and apatite. Biotite forms idiomorphic to hypidiomorphic grains; greenish, brownish-beige and reddish-brown to burgundy-red biotites are present.
Photomicrographs showing mineralogical constituents and textures of the TTG suite of the MCB. (a–d) Inequigranular mosaic of abundant idiomorphic prismatic plagioclase, allotriomorphic quartz, K-feldspar, biotite, hornblende and minor epidote in fresh tonalite and trondhjemite samples. Note the armouring of epidote around pristine biotite in (d), and plagioclase lacking oscillatory compositional zonation. (e) Idiomorphic epidote grains enclosing microcrystals of accessory allanite and showing predominantly sharp euhedral contacts against biotite, but embayed against quartz and plagioclase. (f) Idiomorphic epidote (intergrown with quartz) showing predominantly sharp euhedral contacts against both pristine biotite and a wedge-shaped idiomorphic crystal of titanite. In these photomicrographs, note the predominantly fresh appearance and unaltered nature of the various mineral phases present (P = plagioclase, Q = quartz, K = K-feldspar, B = biotite, H = hornblende, E = epidote, T = titanite, A = allanite). Cross-polarized light; width of field of view is 5 mm for photomicrographs (a–d), and 2 mm for (e, f).
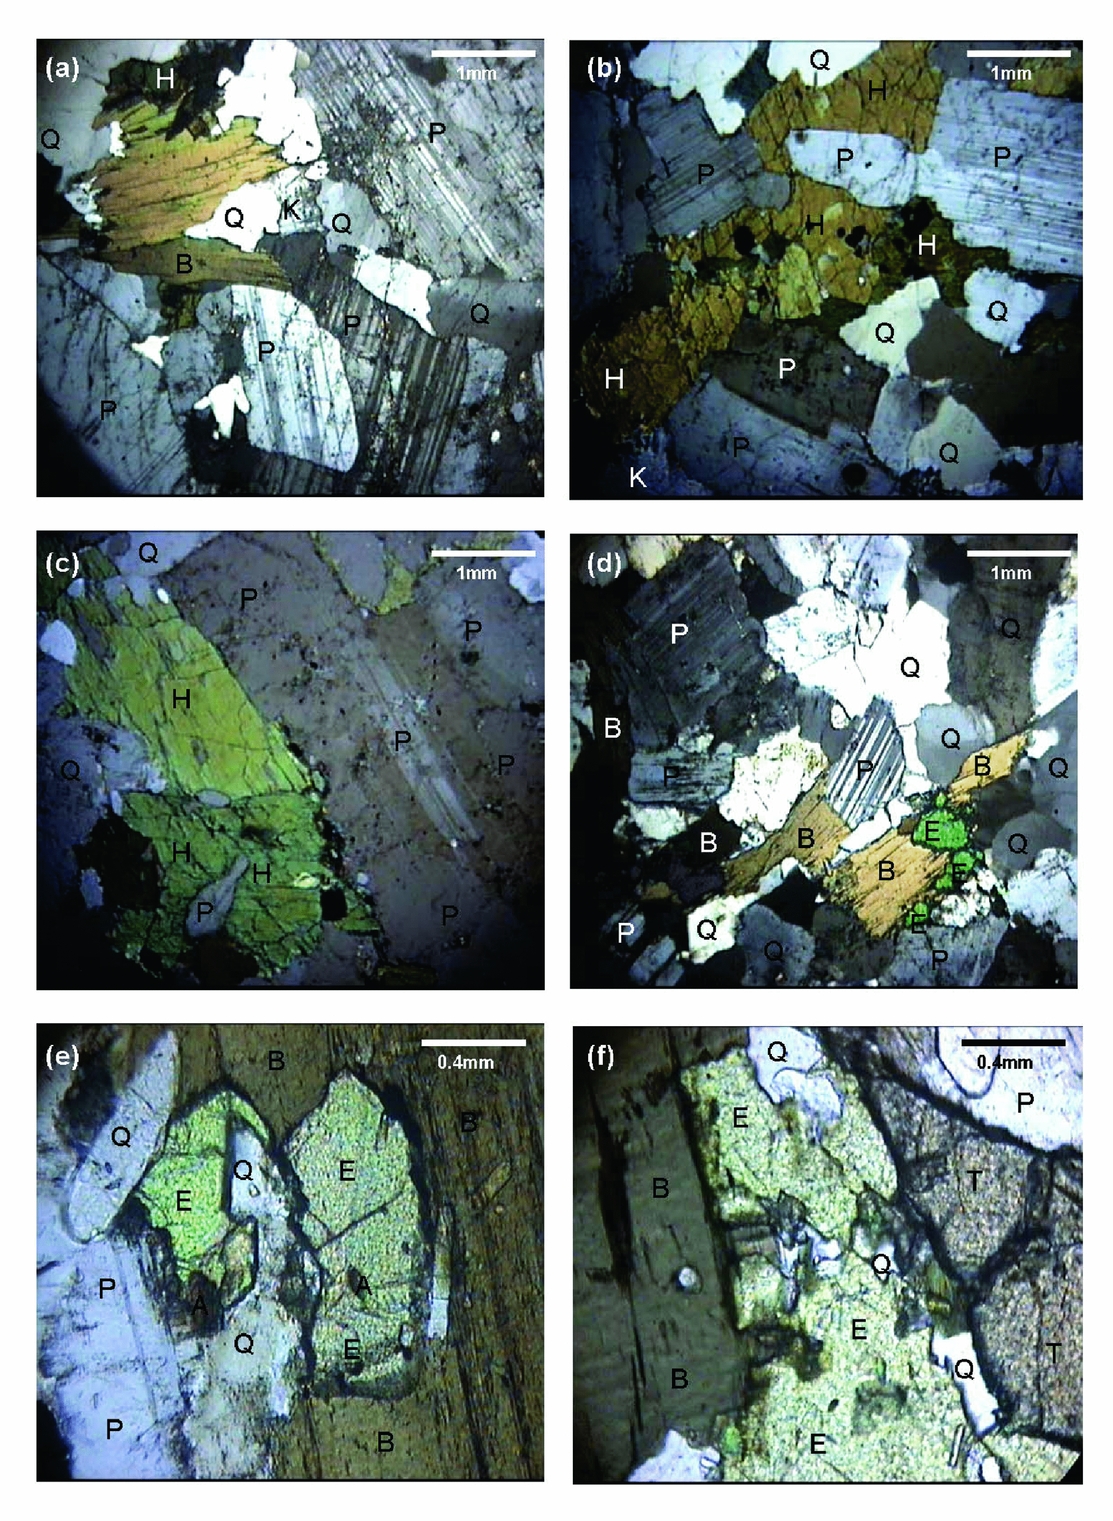
Epidote has been observed in most of the MCB samples, commonly occurring as idiomorphic, high-relief, weakly pleochroic grains, varying from 3 to 1 vol. % of the rock (Fig. 3d, e, f). It occasionally shows minor chemical zonation, but patchy colour distribution is more common. Some idiomorphic epidote grains crystallized around a core of well-developed accessory allanite. Epidote predominantly shows sharp euhedral contacts against biotite, but exhibits embayed to myrmekitic grain boundaries when in contact with quartz and feldspars (Fig. 3e, f). It also forms crystals occasionally intergrown with tiny wormy quarts within resorption textures growing into the amphibole. Therefore, the MCB epidote displays characteristic textural features similar to those interpreted by Zen & Hammarstorm (Reference Zen and Hammarstorm1984) and Schmidt & Poli (Reference Schmidt and Poli2004) to represent a late magmatic phase. Accordingly, it is inferred to be of igneous origin. The fresh appearance of plagioclase and the lack of biotite or amphibole alternation in rocks of the MCB further support this inference (Abdel-Rahman, Reference Abdel-Rahman2016). Magmatic epidote has been reported in a number of other studies (e.g. Evans & Vance, Reference Evans and Vance1987; Farrow & Barr, Reference Farrow and Barr1992; Franz & Smelik, Reference Franz and Smelik1995; Barr, White & Culshaw, Reference Barr, White and Culshaw2001; Dahlquist, Reference Dahlquist2001; Popov, Nikiforova & Bogatov, Reference Popov, Nikiforova and Bogatov2001; Bédard, Reference Bédard2003), but its occurrence in the MCB is the first within the vast Arabian–Nubian Shield.
Titanite is the most abundant accessory phase, commonly forming relatively large idiomorphic wedge-shaped to rectangular crystals (Fig. 3f), whereas some allotriomorphic rounded grains are also present. Both zircon and apatite are somewhat less common, occurring as tiny crystals. Allanite is occasionally present within some epidote crystals (Fig. 3e), and also in association with other mafic minerals. Opaque phases are represented by magnetite with some ilmenite. Most samples are generally fresh, with only a few samples showing minor alteration of some plagioclase grains to sericite and some amphibole and/or biotite to secondary chlorite. Thus, signs of rock/fluid interaction at the post-magmatic or subsolidus stage are rare.
4. Analytical methods
4.a. Geochemistry
4.a.1. Major elements
Concentrations of the major elements for 26 representative samples from the MCB were determined on whole-rock powders fused with lithium metaborate in discs by X-ray fluorescence spectrometry (Phillips PW1400 Spectrometer model 691) at McGill University using a Rh tube operated at 40 kV and 70 mA. Loss on ignition (LOI) was determined by heating powdered samples for 50 minutes at 1000 °C.
4.a.2. Trace elements
Concentrations of Rb, Sr, Ba, Zr, Y, Nb, Ga, Pb, U and Th for the same 26 whole rock samples were determined on pressed pellets by X-ray fluorescence (operating conditions: Rh radiation, 70 kV, 40 mA). The analytical precision, as calculated from 20 replicate analyses of one sample, is better than 1 % for most major elements and better than 5 % for most trace elements. The detection limit for the trace elements analysed is 1 ppm.
4.a.3. Rare earth elements, hafnium, and tantalum
Concentrations of 14 rare earth elements (REE) as well as Hf and Ta for 11 representative samples from the MCB were determined by inductively coupled plasma mass spectrometry (ICP-MS) at Activation Laboratories (Ontario, Canada). Solutions of fused samples are spiked with three internal standards to cover the entire mass range. These are further diluted and are introduced into a Perkin Elmer-SCIEX Elan 6000 ICP-MS using a proprietary sample introduction methodology. The primitive mantle values used for normalization are those of Sun & McDonough (Reference Sun, McDonough, Saunders and Norry1989).
4.b. Geochronology
4.b.1. The Rb–Sr isotope analysis
Rock powders of five representative whole-rock samples of the MCB were used for Rb–Sr isotopic analysis; the samples were dissolved in a mixture of HF, HNO3 and HClO4. Before the decomposition, all samples were totally spiked with 85Rb–84Sr mixed solution. Rb and Sr were separated using conventional cation-exchange techniques. Total blanks are 0.01–0.05 ng for Rb and 0.3–0.7 ng for Sr. The various Rb–Sr isotopic ratios were measured using a Triton MC Mass Spectrometer at Activation Laboratories. Accuracy of measurements of Rb and Sr contents was ± 0.5 %, 87Rb/86Sr ± 1.0 % (2σ). The Sr isotopic ratios were normalized to 88Sr/86Sr = 8.37521.
4.b.2. The Sm–Nd isotope analysis
The same five representative whole-rock samples used for the Rb–Sr isotopic analysis were also used to obtain Sm–Nd isotopic data. Rock powders of these samples were dissolved in a mixture of HF, HNO3 and HClO4. Before the decomposition, the samples were totally spiked with 149Sm–146Nd mixed solution. The REE were separated using conventional cation-exchange techniques. Both Sm and Nd were separated by extraction chromatography on HDEHP-covered Teflon powder. The various Sm–Nd isotopic ratios were measured using a Triton MC Mass Spectrometer (at Activation Laboratories). Accuracy of the measurements of Sm and Nd contents was ± 0.5 %, 147Sm/144Nd ± 0.5 % (2σ). The various 143Nd/144Nd ratios measured for the MCB rocks are relative to the value of 0.511860 of the La Jolla Nd standard.
4.b.3. The U–Pb–zircon (TIMS) analysis
A pristine rock sample (#MC-19) representative of the MCB was used for absolute age dating using the U–Pb–zircon Thermal Ionization Mass Spectrometry (TIMS) method. Zircon grains were separated from the sample, and the grains were treated before the analysis. Grains selected for analysis were loaded into FEP Teflon microcapsules, spiked with a mixed 205Pb–233U–235U tracer solution and dissolved in concentrated HF at 220 °C within high-pressure vessels for 48–60 hours. Dissolution was followed by conversion to chloride form using 6H HCl at 180 °C for 12 hours. Pb and U were separated using a miniaturized HCl-based ion exchange chromatography procedure modified after Krogh (Reference Krogh1973). Isotope compositions were measured on the VG Sector 54 multi-collector TIMS (at Activation Laboratories). The measured isotopic ratios were corrected for mass-dependent isotope fractionation in the mass spectrometer, as well as for U and Pb contributions from the spike, laboratory blanks and initial Pb in the sample. Thus, all common Pb in the analyses were assigned to procedural blank with a measured composition of 206Pb/204Pb = 18.271 ± 0.05, 207Pb/204Pb = 15.587 ± 0.05, 208Pb/204Pb = 38.119 ± 0.05 (2σ); U blanks were <0.1 pg. Age calculations are based on the decay constants of Steiger & Jäger (Reference Steiger and Jäger1977).
5. Analytical results
5.a. Major- and trace-element geochemistry
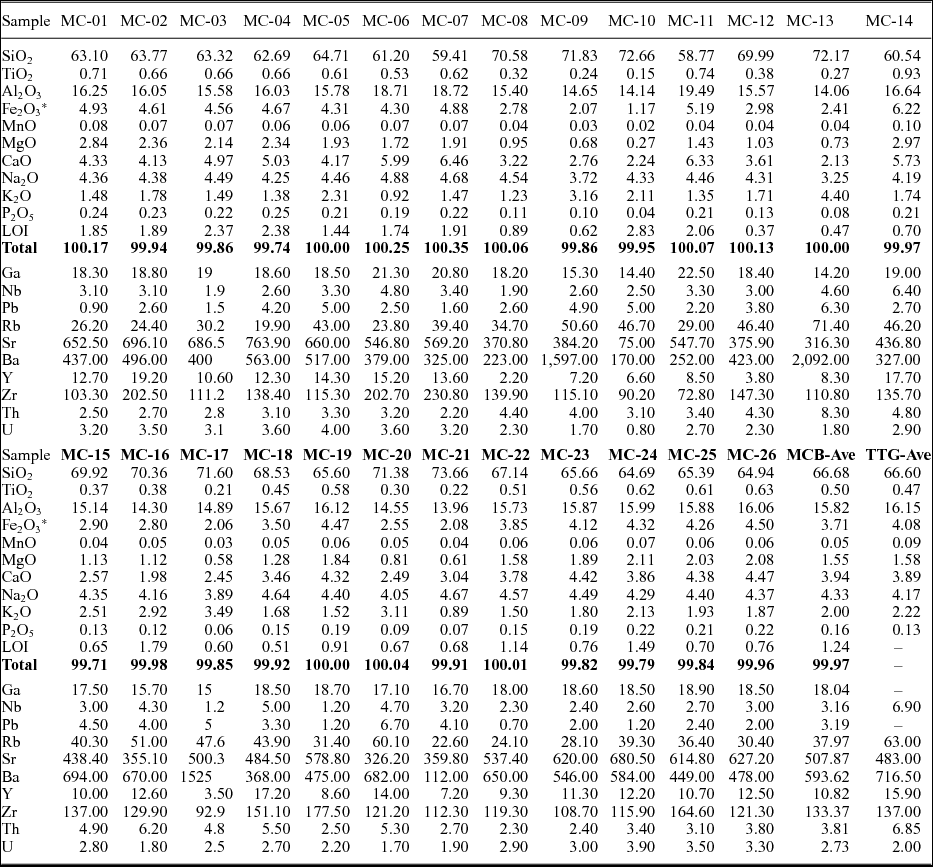
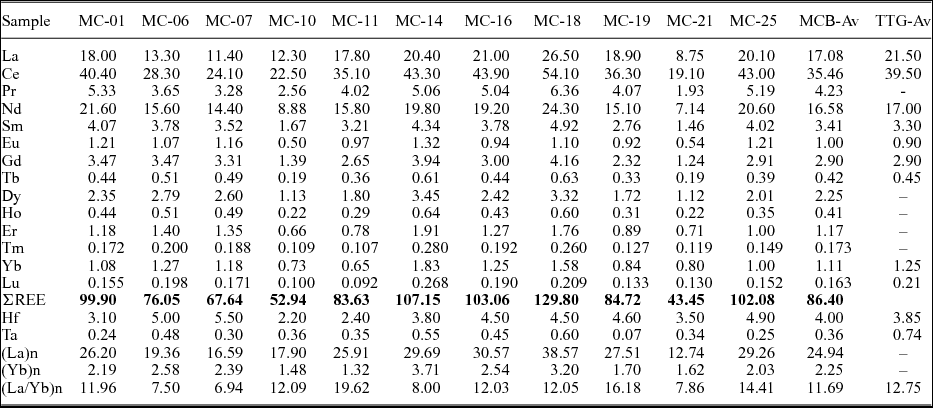
Results, expressed as major-element oxides (in wt %) and trace elements (in ppm) for representative MCB samples, along with averages of Proterozoic and Phanerozoic TTG compositions from various regions worldwide, are given in Table 1. The concentrations of the REE, as well as Hf and Ta for 11 representative whole-rock samples from the MCB, along with averages of Proterozoic and Phanerozoic TTGs, are given in Table 2. The data show that the investigated batholith is compositionally broad, covering wide ranges of SiO2 (58.8–73.7 wt %), Al2O3 (14–19.5 wt %), CaO (1.98–6.46 wt %), Sr (316–764 ppm), Rb (20–71 ppm) and Ba (112–2092 ppm). It is depleted in K, Ti, Nb, Y, Hf and heavy REE (HREE) (Tables 1, 2), and has relatively low concentrations of some compatible transition elements such as Ni (11-45 ppm) and V (18-127 ppm). Also, the concentrations of the HFSE are relatively low in Zr (73–231 ppm), Nb (1.2–6.4 ppm) and Y (2.2–19.2 ppm).
Major and trace element composition (in wt % and ppm, respectively) of representative samples from the the TTG suite of the Mons Claudianus batholith (Egypt)

*Total iron expressed as Fe2O3.
REE composition (in ppm) of representative samples from the TTG suite of the Mons Claudianus batholith (Egypt)

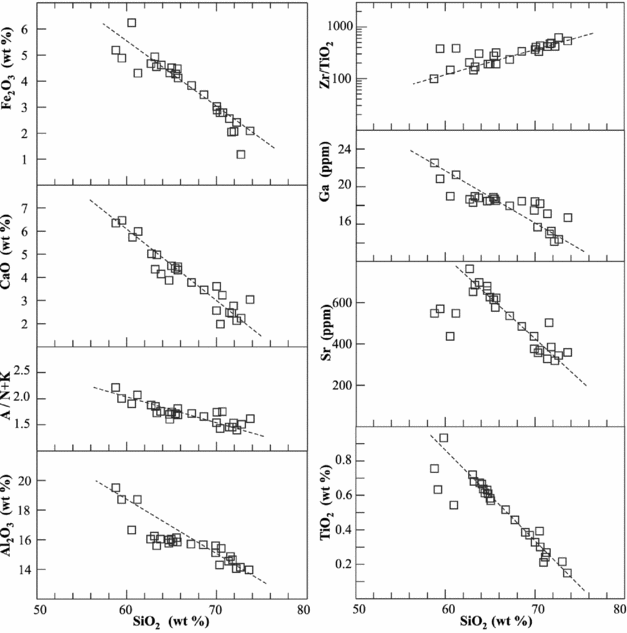
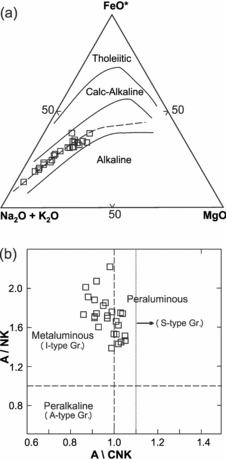
Variations of silica vs some major and trace elements as well as some elemental ratios produce linear trends showing gradual decrease in Al2O3, CaO, Fe2O3 (as total iron), TiO2, Sr and Ga with increasing silica contents, but with the Zr/Ti ratios showing a positive correlation (Fig. 4). Unlike ilmenite, zircon formed during late stages of crystallization, thus leading to an increase in the Zr/Ti ratio with differentiation. The generally well-defined trends, with only a limited scatter of data points, suggest a continuous process of evolution via internal differentiation. Overall, the MCB rocks exhibit low K2O/Na2O ratios (0.38, on average), are subsolvus (as revealed by the two-feldspar mineralogy), having typical calc-alkaline affinities (Fig. 5a), metaluminous to mildly peraluminous (Fig. 5b), and are thus characteristic of I-type, volcanic-arc orogenic suites.
Variations of selected major and trace elements vs silica for rocks of the MCB. Most data points show linear well-defined trends (with some limited scatter), suggesting a continuous process of evolution via internal differentiation.

(a) A-F-M diagram showing that the MCB rocks exhibit a well-defined calc-alkaline trend (fields are after Kuno, Reference Kuno, Hess and Poldervaart1968). (b) Molecular Al2O3/(CaO + Na2O + K2O) vs molecular Al2O3/(Na2O + K2O) (or molar A/CNK vs A/NK) variation diagram showing that the MCB lithologies are metaluminous to mildly peraluminous.

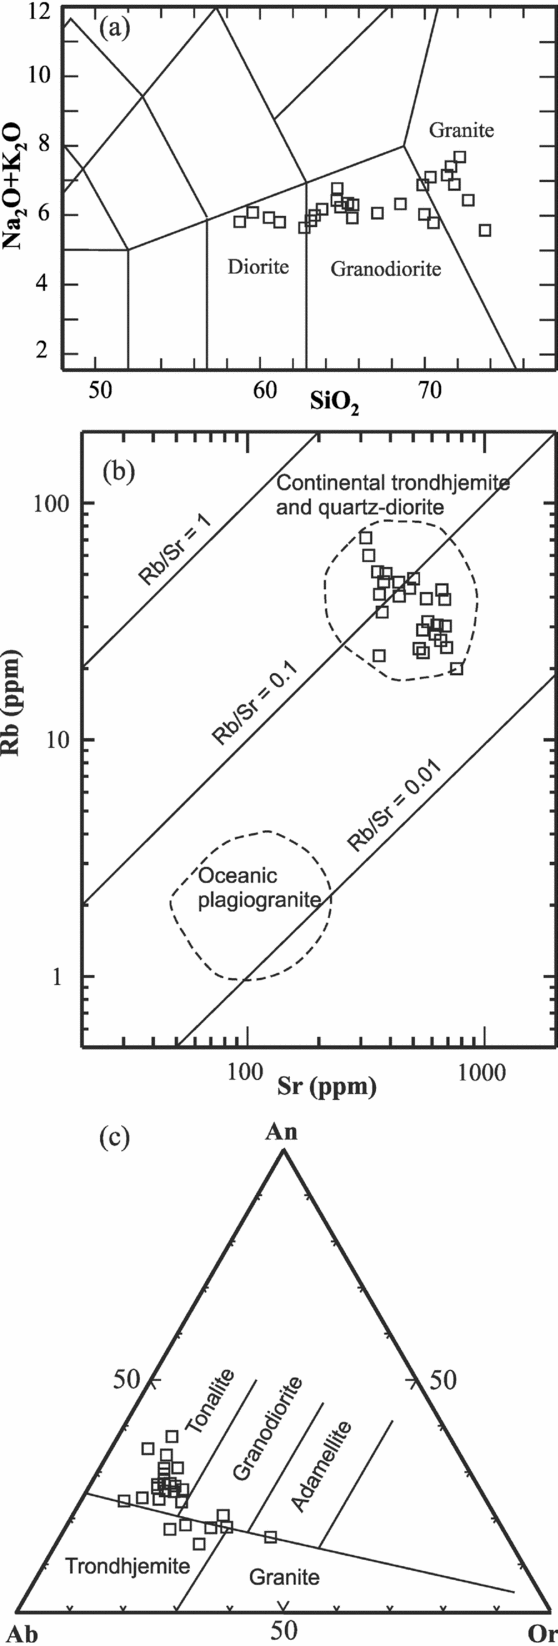
On the classification diagram of Middlemost (Reference Middlemost1997), data points of the MCB plot in the fields of diorite, granodiorite and granite (Fig. 6a), and occupy the field of quartz–diorite and continental trondhjemite (Fig. 6b), which is distinct from the ophiolite-related plagiogranite's field delineated by Coleman & Peterman (Reference Coleman and Peterman1975). The rocks also plot in the fields of tonalite, trondhjemite and granodiorite (TTG; Fig. 6c) of O'Connor (Reference O'Connor1965) and Barker (Reference Barker and Barker1979). In addition, most elemental averages of the MCB rocks (cf. Tables 1, 2) compare rather well with averages of those of Proterozoic and Phanerozoic TTG suites from various regions (compiled by Condie, Reference Condie2005). A number of authors including Barker & Arth (Reference Barker and Arth1976), Barker, Peterman & Friedman (Reference Barker, Peterman and Friedman1976), Barker (Reference Barker and Barker1979) and Defant & Drummond (Reference Defant and Drummond1990) have distinguished between a low-Al TTG type (having <15 % Al2O3 at 70 % SiO2, <200 ppm Sr, slightly enriched light REE (LREE), flat HREE and a negative Eu anomaly), and a high-Al type (having Al2O3 contents >15 % at 70 % SiO2, high Sr (>300 ppm), low Y (<15 ppm), low Yb (<1.8 ppm), low Nb (<11 ppm), very low Rb/Sr ratios (<0.15), low to moderate K/Rb ratios (<750), enriched LREE, depleted HREE and no or only slight Eu anomalies). The MCB rocks exhibit these same chemical signatures, including Al2O3 contents >16 % at 70 % silica, thus forming a typical high-alumina TTG suite.
(a) SiO2 vs Na2O + K2O classification diagram for the MCB rocks; data points occupy the fields of diorite, granodiorite and granite of Middlemost (Reference Middlemost1997). (b) The Rb vs Sr variation diagram indicating that rocks of the MCB plot exclusively in the field of quartz–diorite and continental trondhjemite and are clearly distinct from oceanic plagiogranites (fields are after Coleman & Peterman, Reference Coleman and Peterman1975). (c) Normative An–Ab–Or classification diagram for the MCB, showing that it is made up of tonalite–trondhjemite–granodiorite (TTG) lithologies; fields are after O'Connor (Reference O'Connor1965) and Barker (Reference Barker and Barker1979).

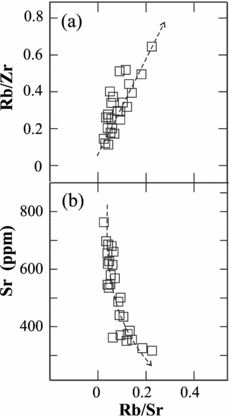
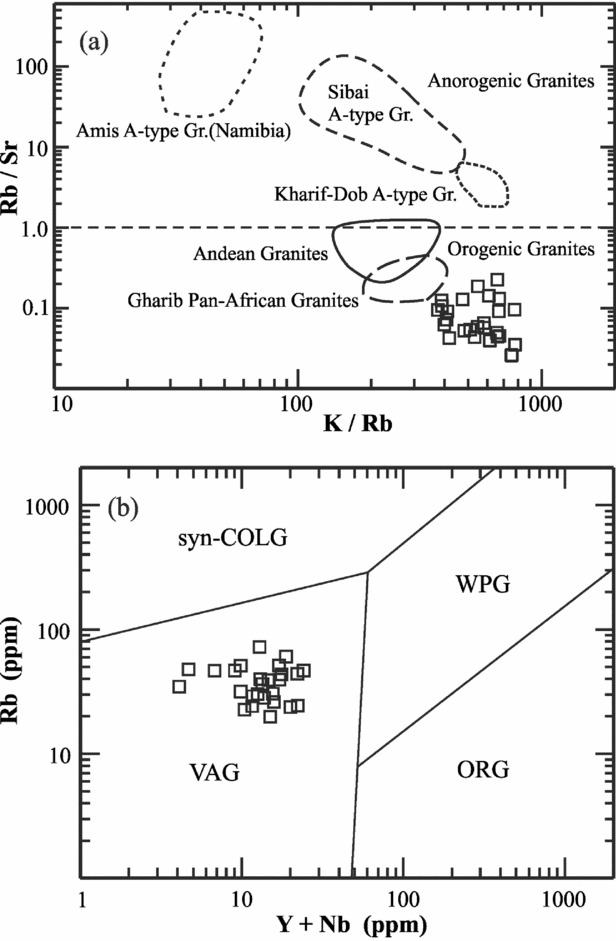
On the Rb/Sr vs both Sr and Rb/Zr inter-element variation diagram (Fig. 7), the MCB data points show smooth covariations with linear trends, suggesting that internal differentiation within the MCB magma produced the more evolved lithologies. The K/Rb vs Rb/Sr diagram (Fig. 8a) shows that rocks of the MCB plot in the field of ‘orogenic’ complexes of Abdel-Rahman & El-Kibbi (Reference Abdel-Rahman and El-Kibbi2001), whereas the (Y + Nb) vs Rb diagram (Fig. 8b) shows that these MCB rocks are typical of the ‘volcanic-arc granites’ of Pearce, Harris & Tindle, (Reference Pearce, Harris and Tindle1984).
Rb/Sr vs Sr and Rb/Zr variation diagram for the MCB rocks.

(a) K/Rb vs Rb/Sr diagram showing that all data points of the MCB exhibit very low (<0.5) Rb/Sr ratios, characteristic of orogenic complexes. The boundary (marked by the dashed line at Rb/Sr = 1) separating the fields of orogenic and anorogenic granites is after Abdel-Rahman & El-Kibbi (Reference Abdel-Rahman and El-Kibbi2001). The fields of the anorogenic peralkaline granites of the Amis complex of Namibia, of the Sibae complex and the Kharif-Dob complex of eastern Egypt are after Schmitt et al. (Reference Schmitt, Emmermann, Trumbull, Buèhn and Henjes-Kunst2000), Abdel-Rahman & El-Kibbi (Reference Abdel-Rahman and El-Kibbi2001) and Abdel-Rahman (Reference Abdel-Rahman2006), respectively. The fields of the orogenic Andean granites and the Pan-African calc-alkaline granites are after Atherton et al. (Reference Atherton, McCourt, Sanderson, Taylor, Atherton and Tarney1979) and Abdel-Rahman & Martin (Reference Abdel-Rahman and Martin1987), respectively. (b) Rb vs (Y + Nb) diagram showing that all data points of the MCB plot in the field of volcanic-arc granites (VAG). Other fields are collisional granites (COLG), within-plate granites (WPG) and oceanic-ridge granites (ORG), and are after Pearce, Harris & Tindle (Reference Pearce, Harris and Tindle1984).

5.b. Rare earth elements, Hf and Ta
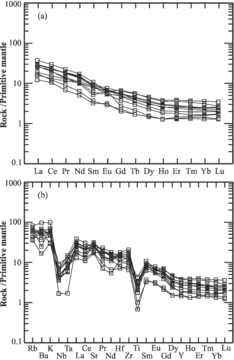
The MCB rocks exhibit low Hf (2.2–5.5 ppm) and Ta values (0.07–0.60 ppm). Overall, these rocks exhibit moderate REE values (∑REE = 86 ppm, on average), and are LREE-enriched over HREE; the latter are markedly depleted (e.g. average Yb = 1.1 ppm), as is the case for most TTG rocks in general (having Yb < 1.8 ppm). The primitive-mantle normalized REE patterns of the MCB (Fig. 9a) are sub-parallel, moderately fractionated (mean (La/Yb)N = 11.7), and exhibit notable non-fractionated or flat HREE. The REE profiles show no or insignificant Eu anomalies (Fig. 9a). The lack of Eu anomalies in the MCB rocks appears to be a universal feature for high-Al TTGs in general (e.g. Drummond & Defant, Reference Drummond and Defant1990). The REE and other trace elements are summarized in a primitive-mantle normalized spidergram (Fig. 9b). The MCB normalized profiles show relative enrichment in most incompatible elements, pronounced negative Nb, Ta and Ti anomalies, and strong depletion in HREE and Y (Fig. 9b), typical of high-alumina TTG rocks. Furthermore, the REE compositions of the MCB indicate clearly that it belongs to the low-HREE TTG group of Halla et al. (Reference Halla, van Hunen, Heilimo and Hölttä2009). Archaean crustal segments worldwide are dominated by TTG lithologies, but their presence in Neoproterozoic shields is rare or uncommon, which adds to the significance of this study in contributing to knowledge on Neoproterozoic crustal development.
(a) Primitive-mantle normalized REE patterns of 11 representative samples from the MCB, showing profiles with no Eu anomalies and non-fractionated or flat HREE. (b) Primitive-mantle normalized multi-element profiles (or spidergram) showing marked depletion in Nb, Ti and Ta. Normalization values are taken from Sun & McDonough (Reference Sun, McDonough, Saunders and Norry1989).

5.c. Isotopic characteristics and age of crystallization
5.c.1. Rb–Sr and Sm–Nd radiometric isotopes
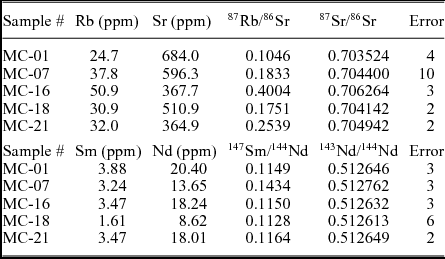
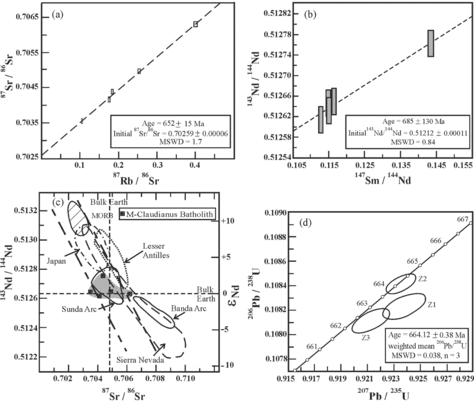
Strontium and neodemium isotopes have been determined for five representative whole-rock samples of the MCB, and the analytical results are presented in Table 3 and plotted in Figure 10a, b. The batholith exhibits 87Sr/86Sr isotopic compositions ranging from 0.703524 to 0.706264. The regression line of the five MCB data points yields a Rb–Sr Neoproterozoic age of 652 ± 15 Ma (2σ), and an initial 87Sr/86Sr ratio of 0.70259 ± 0.00006 (Fig. 10a). The regression line has an MSWD value of 1.7; therefore, it is not an isochron in the strict sense. The MCB exhibits 143Nd/144Nd isotopic compositions that range from 0.512613 to 0.512762, with ε Nd values ranging from –0.5 to +2.4. The Sm–Nd regression line (Fig. 10b) yields an older age of 685 ± 130 Ma (2σ), and an initial 143Nd/144Nd ratio of 0.51212 ± 0.00011 (MSWD = 0.84). The Sr–Nd isotopic compositions of the MCB (plotted in Fig. 10c) fall along the mantle array between mid-oceanic ridge basalt (MORB) and arc-related basaltic andesites. This, along with the low initial 87Sr/86Sr ratio (0.70259), is suggestive of a mantle source with no or only insignificant contribution from an older continental component (see Section 6.c). More specifically, the Sr–Nd isotopic compositions of the MCB are nearly identical to those of the Sunda arc basaltic–andesitic lavas of Indonesia (Fig. 10c).
Results of Sr and Nd isotopic analyses of five whole rock samples from the Mons Claudianus batholith (Egypt)

(a) Whole-rock Rb–Sr isotope data regression line for the MCB. Raw data are given in Table 3. (b) Whole-rock Sm–Nd isotope data regression line for the MCB. Raw data are given in Table 3. (c) Sr–Nd isotope diagram showing representative TTG rocks of the MCB (squares), along with some general ranges of values of several types of rock suites from selected tectonic settings: MORB, Japan arc, Lesser Antilles, Sunda Arc, Banda Arc and Sierra Nevada batholith (California). Data for these suites are taken from Faure (Reference Faure1986) and references therein. (d) U–Pb concordia diagrams for the MCB (see text for details).

5.c.2. The U–Pb–zircon radiometric isotopes
The analytical results for the U–Pb–zircon radiometric isotopes (TIMS method) are presented in Table 4, with uncertainties quoted at the 2σ level. Zircon fractions are composed of single grains; the three zircon crystals used are all colourless to beige, variably cloudy elongate prisms with well-formed pyramidal terminations. The data are plotted on the Concordia diagram (Fig. 10d). Two of the three zircon grains analysed (Z-1 and Z-3) are very slightly discordant, producing 206Pb/238U ages of 663.05 ± 0.51 Ma and 662.36 ± 0.48 Ma, respectively. Owing to the minimal scatter and the presence of one zircon grain (Z-2) that is concordant, a precise 206Pb/238U age of 664.12 ± 0.38 Ma obtained on this concordant grain (Fig. 10d) is considered the age of crystallization of the MCB. The very slightly discordant ages obtained on the other two zircon grains probably reflect some minor Pb loss, rather than the time of emplacement of the investigated batholith. The precise 206Pb/238U age falls within the range between the older Nd-age of 685 Ma and the somewhat younger Sr age of 652 Ma obtained in this study (cf. Fig. 10a and b). The 206Pb/238U age obtained in this study using the TIMS method could be further improved in the future via a detailed geochronological investigation including SIMS U–Pb analyses of zircon and titanite from more rock samples of the TTG suite of the MCB using Sensitive High-mass Resolution Ion MicroProbe (SHRIMP) and other techniques.
Results of U–Pb isotopic analysis (TIMS method) of zircon from the Mons Claudianus batholith

(a) Zircon fractions are composed of single grains.
(b) Total weight of common Pb.
(c) Ratio of radiogenic Pb to common Pb.
(d) Measured ratio corrected for spike and fractionation only. Mass fractionation correction of 0.25 %/amu ± 0.04 %/amu (atomic mass unit) was applied to single-collector Daly analyses (based on daily analysis of NBS-981).
(e) Corrected for fractionation, spike and blank. All common Pb in the analyses was assigned to procedural blank with a measured composition of 206Pb/204Pb = 18.271 ± 0.05, 207Pb/204Pb = 15.587 ± 0.05, 208Pb/204Pb = 38.119 ± 0.05 (2σ). U blanks were <0.1 pg.
(f) Errors are 2σ.
(g) Age calculations are based on the decay constants of Steiger & Jäger (Reference Steiger and Jäger1977).
(h) Error in the dates reported at 2σ.
(i) % discordance = 100 − (100 × (206Pb/238U age)/(207Pb/206Pb age)).
6. Discussion
6.a. Neoproterozoic orogenies and the MCB geodynamic regime
The Pan-African thermotectonic cycle was a long-lived mountain-building process that operated across Gondwana during the Neoproterozoic, producing magmatic assemblages ranging in age from c. 950 to 520 Ma. The Pan-African event was considered to include four orogens: the Brasiliano, Kuungan, Damaran and the East African orogenies (Trompette, Reference Trompette and Corozzi1994; Shackleton, Reference Shackleton1996; Hoffman, Reference Hoffman1999; Meert & Lieberman, Reference Meert and Lieberman2008). The four orogens resulted in the polyphase assembly of Gondwana, producing extensive mountain chains. Meert & Liberman (Reference Meert and Lieberman2008) demonstrated that the vast mountain chains produced and their associated geochemical–tectonic changes may later have delivered nutrients into a shifting oceanic realm, thus causing significant positive impact on evolutionary events associated with the Cambrian radiation. In this context, Neoproterozoic terrains including the Egyptian crystalline belt of the East African orogeny have been considered one of the most remarkable geologic episodes in all of Earth's history (Hoffman, Reference Hoffman1999; Meert & Lieberman, Reference Meert and Lieberman2008).
According to Meert & Van der Voo (Reference Meert and Van der Voo1996, Reference Meert and Van der Voo1997), the ‘East African Orogeny’ resulted from the collision of greater India (India, Tibet, Seychelles, Madagascar, Enderby Land) with the conjoined Kalahari and Congo cratons, whereas the ‘Kuunga orogeny’ (c. 550 Ma) represents the collision of Australia – East Antarctica with proto-Gondwana (Hoffman, Reference Hoffman1999). The ‘East African Orogen’ which was developed during the closure of the Mozambique Ocean, entails two principal periods of orogenies: one extending from 870 to 650 Ma, and the other occurring in the period 580–520 Ma (Shackleton, Reference Shackleton1996; Wilson, Grunow & Hanson, Reference Wilson, Grunow and Hanson1997). The age of the MCB (664 Ma) places it near the end of the earlier orogenic period that witnessed the closure of the Mozambique Ocean. Thus, oceanic-arc magmatism associated with this tectonic event seems to have produced voluminous magmas including that of the MCB. This is consistent with the mineral assemblage of the MCB, and with its voluminous calc-alkaline character, as well as its subsolvus nature, which are traits typical of those of I-type, arc-related magmatism. Moreover, the low initial 87Sr/86Sr ratio (0.70259) of the MCB, its ε Nd values (–0.5 to +2.4) that fall along the mantle array (cf. Fig. 10c), thus suggestive of a juvenile magma, along with the progression from intermediate to felsic calc-alkaline MCB lithologies, are all consistent with an intra-oceanic magmatic arc setting.
Using tectonic discrimination diagrams, rocks of the MCB are clearly orogenic, and all data points plot exclusively in the field of volcanic-arc granites (cf. Fig. 8). Orogenic magmatism that produced the MCB and other similar Neoproterozoic batholiths led to the development of various Pan-African belts. These belts include older ophiolite complexes with ages ranging mainly between c. 810 Ma and 700 Ma as reported on ophiolites from the Arabian–Nubian Shield (e.g. Berhe, Reference Berhe1990; Ali et al. Reference Ali, Azer, Gahlan, Wilde, Samuel and Stern2010). The occurrence of ophiolite sutures across this shield is consistent with its development on an oceanic crust by the juxtaposition of a series of island arcs with later development of continental arcs (Abdel-Rahman, Reference Abdel-Rahman1995, Reference Abdel-Rahman1996; Blasband et al. Reference Blasband, White, Broijmans, De Boorder and Visser2000; Johnson & Woldehaimanot, Reference Johnson, Woldehaimanot, Blundell, Neubauer and von Quadt2003; Abdel-Rahman et al. Reference Abdel-Rahman, Ploat, Dilek, Fryer, El-Sharkawy and Sakran2009; El-Bialy, Reference El-Bialy2013). It should be noted that the Neoproterozoic age obtained in this study on the investigated TTG batholith provides another example supporting the view that TTGs are not strictly an Archaean phenomenon, but occur (albeit rarely) throughout geologic time.
6.b. Petrogenetic considerations: insight into source, depth and melting conditions
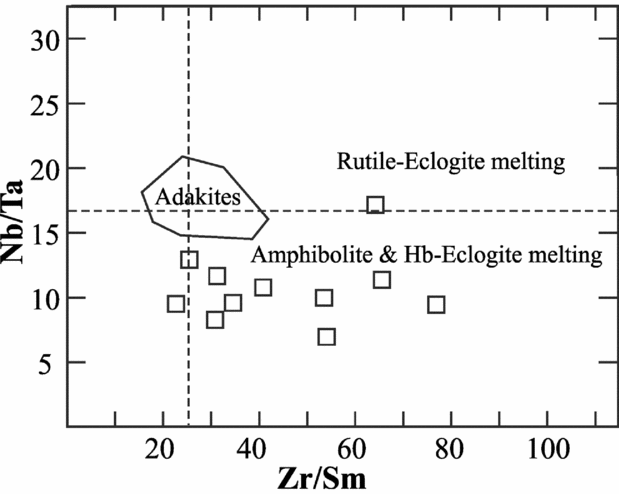
The MCB rocks exhibit low Nb/Ta ratios (8.7 on average) that fall below primitive mantle values (i.e. <16.7), and are typical of those of TTG assemblages in general (i.e. varying from 5 to 15 with an average of 11; Condie, Reference Condie2005). On the Nb/Ta vs Zr/Sm variation diagram, the MCB rocks plot within the TTG space, away from the ‘adakite’ field (Fig. 11), thus implying a mantle source that lacks rutile. This is consistent with the study of Foley, Tiepolo & Vannucci, (Reference Foley, Tiepolo and Vannucci2002) which showed that rutile-bearing eclogites cannot serve as sources for most TTG magmas. Condie (Reference Condie2005) demonstrated that partial melting of rutile-bearing eclogites produces melts with high Nb/Ta ratios (>16.7), whereas high-Al TTGs exhibit lower ratios (cf. Fig. 11). Most rocks of the MCB also exhibit relatively high Zr/Sm ratios (average 45) compared to adakites, which have ratios less than that of the primitive mantle (i.e. <25.2).
Nb/Ta vs Zr/Sm diagram (after Condie, Reference Condie2005) showing the adakite field in relation to compositional fields representing melting of both rutile eclogite and rutile-free eclogite. These melting fields are from Foley, Tiepolo & Vannucci (Reference Foley, Tiepolo and Vannucci2002), and the dashed lines represent primitive mantle values of Sun & McDonough (Reference Sun, McDonough, Saunders and Norry1989). The TTG rocks of the MCB plot mainly in the melting field of rutile-free eclogite.

The significance of the process of partial melting of a subducted oceanic crust of eclogite mineralogy in producing intermediate magma compositions has been realized since some earlier pioneering experimental work (e.g. Green & Ringwood, Reference Green and Ringwood1968). Experimental studies of Wolf & Wyllie (Reference Wolf and Wyllie1989) on vapour-absent (dehydration) melting of a low-K olivine tholeiitic composition (natural amphibolites) at 10 kbar produced high-Al tonalities with a residue rich in Hb–Gnt over a temperature range 750–975 °C. Several other experimental melting studies of eclogites and amphibolites have produced melts of TTG compositions (e.g. Wylie, Wolf & van der Laan, Reference Wylie, Wolf, van der Laan, De Wit and Ashwal1997; Prouteau et al. Reference Prouteau, Scaillet, Pichavant and Maury2001). Thus, there is general agreement that TTG magmas are generated by partial melting of subducted, hydrous metabasaltic oceanic crust transformed into eclogite or garnet amphibolite (Martin & Moyen, Reference Martin and Moyen2002; Moyen, Jayananda & Auvray, Reference Moyen, Jayananda and Auvray2003; Condie, Reference Condie2005; Halla et al. Reference Halla, van Hunen, Heilimo and Hölttä2009; Almeida et al. Reference Almeida, Dall'Agnol, Oliveira, Macambirab, Pimenteld, Rämöe, Guimarãesa and Leite2011; Almeida, Dall'Agnol & Rocha, Reference Almeida, Dall'Agnol and Rocha2017). Moyen & Stevens (Reference Moyen, Stevens, Benn, Mareschal and Condie2006) argued that even when melting starts in amphibolite-facies conditions, and as amphibole disappears relatively quickly during melting, the liquid produced would be in equilibrium with an amphibole-free assemblage (Gnt + Cpx, generally), which is actually eclogitic.
Several studies have confirmed that the trace elements Sr, Y, Nb, Ta and the REE are sensitive to the pressure of melting of eclogitic or amphibolitic assemblages (e.g. Rapp, Shimizu & Norman, Reference Rapp, Shimizu and Norman2003; Xiong, Adam & Green, Reference Xiong, Adam and Green2005; Moyen & Stevens, Reference Moyen, Stevens, Benn, Mareschal and Condie2006; Moyen, Reference Moyen2009; Almeida et al. Reference Almeida, Dall'Agnol, Oliveira, Macambirab, Pimenteld, Rämöe, Guimarãesa and Leite2011; Almeida, Dall'Agnol & Rocha, Reference Almeida, Dall'Agnol and Rocha2017). Based on the work of Martin (Reference Martin1999), Condie (Reference Condie2005) pointed out that depletion in HREE and the low Nb/Ta ratios (in the range 5–15 kbar; average 11 kbar) in high-Al TTGs require both garnet and low-Mg amphibole in the restite, and meeting these requirements necessitates melting in the Hb-eclogite stability field at depths between 40 and 80 km, with temperatures in the range 700–800 °C. Schmidt et al. (Reference Schmidt, Dardon, Chazot and Vannucci2004) and S. F. Foley et al. (unpub. report, 2004) demonstrated that partial melting of rutile-bearing eclogite produces melts with high Nb/Ta ratios (>16.7 value of primitive mantle; Condie, Reference Condie2005): as in most high-Al TTGs, the lower values of the MCB rocks (average Nb/Ta ratios = 8.7) suggest that rutile-bearing eclogite cannot serve as a protolith for the MCB magma. Thus, a possible rutile-free eclogitic source for the MCB magma is indicative of pressures below 15 kbar. The relatively high Sr and Eu contents, as well as Sr/Y ratios, the fractionated REE profiles and the low HREE and Y contents in the TTG suite of the MCB are suggestive of melting in the presence of garnet and amphibole (i.e. the MCB melt must have been in equilibrium with garnet). This is also consistent with a pressure range of 10–15 kbar, as demonstrated in a number of experimental studies (e.g. Winther, Reference Winther1996; Moyen & Stevens, Reference Moyen, Stevens, Benn, Mareschal and Condie2006). In such a P-range of melting, the plagioclase breaks down, releasing Sr, while Y and Yb would be locked in garnet.
In terms of heat of fusion, and according to Martin (Reference Martin1999) and Condie (Reference Condie2005), minimum melting temperatures needed to generate TTG magmas from eclogite or garnet amphibolite protoliths should reach 700–800 °C, whereas experimental work by Wolf & Wyllie (Reference Wolf and Wyllie1989) showed a range of 750–975 °C at P = 10 kbar. Almeida et al. (Reference Almeida, Dall'Agnol, Oliveira, Macambirab, Pimenteld, Rämöe, Guimarãesa and Leite2011) indicated that tonalite liquids are obtained at c. 1000 °C (at P < 15 kbar), and require higher temperatures as pressure rises (c. 1200 °C at 30 kbar), while trondhjemitic liquids are generated at temperatures below 1000 °C. In the MCB case (with a possible rutile-free eclogitic source for its magma, thus indicative of pressures below 15 kbar), it is doubtful that such a pressure range corresponding to the stability domain of garnet (necessary to explain the La/Yb ratio of the MCB) could have been attained at 700–800 °C, and an assumed melting temperature in the range 850–950 °C might be more realistic.
The pressure at the site of magma emplacement of the investigated epidote-bearing TTG suite of the MCB was calculated based on the Al-in-hornblende geobarometers of Hammarstrom & Zen (Reference Hammarstrom and Zen1986) and Hollister et al. (Reference Hollister, Grissom, Peters, Stowell and Sisson1987), and values in the ranges 4.8–6.1 kbar and 5.1–6.5 kbar, respectively (average of 5.5 kbar) were obtained (Abdel-Rahman, Reference Abdel-Rahman2016). Pressure of magma emplacement and the albitic component of plagioclase coexisting with hornblende have been utilized (by Abdel-Rahman, Reference Abdel-Rahman2016) to calculate crystallization temperatures of the MCB using the geothermometer of Blundy & Holland (Reference Blundy and Holland1990); the calculated crystallization temperature range is 729–754 °C (mean = 747 °C). Assuming a pressure at the melting site in the middle of the 10–15 kbar P range as discussed above (e.g. Winther, Reference Winther1996; Moyen & Stevens, Reference Moyen, Stevens, Benn, Mareschal and Condie2006; Almeida et al. Reference Almeida, Dall'Agnol, Oliveira, Macambirab, Pimenteld, Rämöe, Guimarãesa and Leite2011), the MCB magma must have risen in the form of a diapir c. 20 km from the site of its emplacement.
6.c. Origin of the Mons Claudianus Batholith
Data presented above indicate that the orogenic calc-alkaline nature of the TTG suite of the MCB, with its strong arc geochemical signatures (having low K2O/Na2O ratios (average 0.38), high Sr/Y ratios (average 58), large Ba enrichment, strong Nb, Ti and Yb depletions), are all consistent with typical slab melts. As one of the least-evolved samples (#MC-7 with 59 wt % SiO2) of the examined TTG suite contains the highest 143Nd/144Nd ratio (0.512762), its magma still represents a suitable example for examining mantle source despite experiencing some internal fractionation.
According to Nohda & Wasserburg (Reference Nohada and Wasserburg1981) and Davidson (Reference Davidson1987), lower 143Nd/144Nd ratios (in the range 0.5110–0.5126, and compared to a bulk Earth value of 0.51264) reflect contamination or crustal sources, whereas higher values suggest mantle sources. The relatively higher 143Nd/144Nd ratios in the MCB rocks (0.512613–0.512762, ε Nd = –0.5 to +2.4), coupled with low Sr-isotope values and a very low initial 87Sr/86Sr ratio of 0.70259, with their isotopic compositions falling between those of MORB and arc-related basaltic andesites along the mantle array (cf. Fig. 10c), are all suggestive of slab melting. It should be noted that the MCB was emplaced into an earlier Pan-African juvenile crust that was thinner and increasingly oceanic in nature as it is part of an arc complex developed on a Late Proterozoic oceanic crust. As pointed out by Moyen & Stevens (Reference Moyen, Stevens, Benn, Mareschal and Condie2006), tholeiitic basalt seems to be the most appropriate to account for the genesis of most TTGs.
In their geochemical study, Halla et al. (Reference Halla, van Hunen, Heilimo and Hölttä2009) demonstrated that magma of the juvenile early Neoarchaean low-HREE TTG group of the western Karelia and Kola cratons of the Fennoscandian Shield was generated via high-pressure partial melting (>2.0 GPa) of a garnet-bearing basaltic source. According to Laurent et al. (Reference Laurent, Martin, Moyen and Doucelance2014), the volumetrically dominant Neoarchaean (3.0–2.5 Ga) juvenile TTGs were generally produced as a result of melting of hydrous meta-igneous mafic rocks (at depth >35 km): subduction takes place with possible episodic break-off and foundering of rafts of basaltic oceanic crust and/or oceanic plateaus, followed by metasomatism of the overlying ‘mantle wedge’ by fluids or melts derived from metabasalts. They stated that this process was generally associated with closure of an oceanic basin and welding of two (proto-)continental blocks. The study of Santos et al. (Reference Santos, Dantas, Cawood, Santos and Fuck2017) on the Palaeoproterozoic Floresta tonalitie–granodiorite suite of NE Brazil showed that this suite records both juvenile magmatism and intense crustal reworking of Archaean to Palaeoproterozoic crust, and is of a heterogeneous source, with a likely tectonic setting that involved crustal thickening by terrane accretion, coeval with slab break-off.
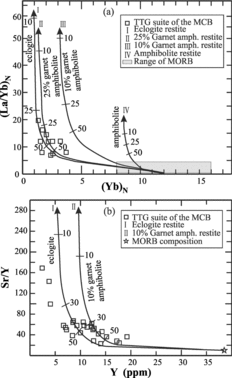
More specifically, Drummond & Defant (Reference Drummond and Defant1990) and Condie (Reference Condie2005) indicated that partial melting of a basaltic slab under eclogitic / garnet-amphibolitic conditions leaving around 10–15 % garnet in the residue produces high-Al TTG magma characterized by low (<1.8 ppm) Yb (it is 0.65–1.8 ppm in MCB), high (La/Yb)N values (11.7 in MCB), low (<20 ppm) Y (2.2–19 ppm in MCB), low (<10 ppm) Nb (1.2–6.4 ppm in MCB), 7–20 Nb/Ta values (7–17 in MCB), and high (>20) Sr/Y and Zr/Sm ratios (58 and 45 in MCB, respectively); the MCB data suggests similar petrogenetic conditions. Thus, chemical traits of the TTG suite of the MCB (with its high-Al and low-HREE nature) support the inference of ‘slab melting under eclogitic conditions’ leaving residual garnet in the source. More specifically, the high Sr/Y and (La/Yb)N ratios, and the positive correlation between these values within the MCB rocks (Fig. 12a) are also consistent with a petrogenetic process involving partial melting of a subducted basaltic slab with residual garnet and/or amphibole. As the latter has high Kd's for MREE, the presence of amphibole in the residue would normally produce concave REE patterns, a feature not present in the MCB rocks. In brief, the MCB chemical/isotopic nature appears to reflect a petrogenetic process involving anatexis of a basaltic slab under eclogitic conditions leaving garnet in the residue, a process envisaged by a number of authors (e.g. Drummond & Defant, Reference Drummond and Defant1990; Condie, Reference Condie2005; Martin et al. Reference Martin, Smithies, Rapp, Moyen and Champion2005; Moyen & Stevens, Reference Moyen, Stevens, Benn, Mareschal and Condie2006).
(a) (Yb)N vs (La/Yb)N diagram and (b) Y (ppm) vs (Sr/Y) diagram containing various partial melting curves produced using initial MORB source materials (modified after Drummond & Defant, Reference Drummond and Defant1990 and Martin, Reference Martin1993) for the TTG suite of the MCB. Data points of the MCB plot along the garnet–amphibolite and eclogite curves, suggesting its magma was generated by partial melting (F = 0.25–0.50) leaving eclogitic– or 10–25 % garnet–amphibolitic restite.

On the diagram containing various partial melting curves produced from MORB source materials (after Drummond & Defant, Reference Drummond and Defant1990; Martin, Reference Martin1993), the MCB data points plot along the eclogite and garnet–amphibolite curves, suggesting its magma was generated by partial melting (F = 0.25–0.50) leaving an eclogitic– or 10–25 % garnet–amphibolitic restite (Fig. 12a, b). Almeida et al. (Reference Almeida, Dall'Agnol, Oliveira, Macambirab, Pimenteld, Rämöe, Guimarãesa and Leite2011) suggested somewhat similar partial melting values (F = 0.25–0.30) for comparable (medium La/Yb) TTG suites. The moderately high Kd's of garnet–Hb–Cpx for Y and their low Kd's for Sr allowed the MCB melt to evolve to low Y contents and high Sr/Y ratios.
The studies of Smithies & Champion (Reference Smithies and Champion2000), Moyen, Jayananda & Auvray (Reference Moyen, Jayananda and Auvray2003) and Martin et al. (Reference Martin, Smithies, Rapp, Moyen and Champion2005) indicated that interactions between TTG-like melts and mantle peridotites produced ‘sanukitoid’ magmas enriched in compatible transition elements, implying the generation of TTG melts in general did not involve interaction with the mantle wedge (e.g. Moyen & Stevens, Reference Moyen, Stevens, Benn, Mareschal and Condie2006; Almeida et al. Reference Almeida, Dall'Agnol, Oliveira, Macambirab, Pimenteld, Rämöe, Guimarãesa and Leite2011). This is consistent with the current study, as the low concentrations of Mg, Ni and V in the TTG rocks of the MCB (which are not related to ‘sanukitoid’ magmas) reflect there being no geochemical evidence to indicate interaction between the investigated TTG magma and the mantle wedge. In sharp contrast, relatively high concentrations of these compatible transition elements in ‘adakites’ (unlike TTGs; Condie, Reference Condie2005) are generally ascribed to interaction of slab melts with the overlying mantle wedge, a process that has been verified by experimental studies (e.g. Drummond & Defant, Reference Drummond and Defant1990; Rapp et al. Reference Rapp, Shimizu, Norman and Applegate1999).
6.d. From fragmented Rodinia to united plates of Gondwana: role of Pan-African belts
The break-up of Rodinia, separating Laurentia from west and east Gondwana, and the opening of both the Iapetus and the Pacific oceans (Hoffman, Reference Hoffman1991; Dalziel, Reference Dalziel1992) preceded the assembly of Gondwana. As a result of its break-up, vestiges of the fragmented Rodinian supercontinent were assembled into Gondwana (e.g. Meert & Torsvik, Reference Meert and Torsvik2003; Collins & Pisarevsky, Reference Collins and Pisarevsky2005; Meert & Lieberman, Reference Meert and Lieberman2008) via the unification of east Gondwana (India, Seychelles, Sri Lanka, Madagascar, East Antarctica and Australia) with west Gondwana (Africa and South America). According to Affaton (Reference Affaton1998), fragments of west Gondwana were linked by orogenic belts such as the Trans-Saharian, Brasilia, Ribeira and Dom Feliciano belts. Other belts, such as the Central African Belt and its counterpart in Brazil (the Borborema Province; Santos et al. Reference Santos, Dantas, Cawood, Santos and Fuck2017), connected West Africa with NE Brazil. Major cratonic elements of west Gondwana comprise Amazonia, West Africa, Sao Francisco, Congo, Kalahari, Grunehogna and Rio de la Plata, besides some smaller cratonic fragments (Tohver, D'Agrella & Trindade, Reference Tohver, D'Agrella and Trindade2006). It should be noted that TTG rocks in several belts within some cratons in West Gondwana (such as the Riacho das Lajes suite of NE Brazil; Santos et al. Reference Santos, Dantas, Cawood, Santos and Fuck2017) represent remnants of Archaean to Palaeoproterozoic crust (i.e. part of ancient exotic cratons). Such cratons were welded by Pan-African/Brasiliano orogenic belts that resulted from the closure of Neoproterozoic oceans. Dalziel (Reference Dalziel1992) and Hoffman (Reference Hoffman1999) indicated that the assembly of Gondwana involved the closure of two major oceans, Mozambique and Adamastor (or Aka Brasilide). The Kalahari and Congo cratons were already joined at the Zambezi Belt, which closed at 850–800 Ma (Hanson, Wilson & Munyanyiwa, Reference Hanson, Wilson and Munyanyiwa1994; Hargrove et al. Reference Hargrove, Martin, Hanson, Singletary, Bowring and Munyanyiwa1998), although the western and central portions of the join reopened shortly thereafter and did not finally close until 600–550 Ma, forming the Damaran and Katangan Belts, respectively (Wilson, Grunow & Hanson, Reference Wilson, Grunow and Hanson1997; Hoffman, Reference Hoffman1999). The period bracketing the fragmentation of Rodinia and the birth of Gondwana was recognized as one of Earth's most remarkable geologic periods (Hoffman, Reference Hoffman1999; Meert & Lieberman, Reference Meert and Lieberman2008).
In addition to the various crystalline belts of the Arabian–Nubian Shield, numerous other Pan-African Neoproterozoic belts that occurred across Gondwana do form crustal segments that are currently widely scattered over several regions. Examples of such segments include those located in western India (de Wall et al. Reference de Wall, Pandit, Dotzler and Just2012), Sri Lanka (Dissanayake & Chandrajith, Reference Dissanayake and Chandrajith1999), the Seychelles (Ashwal, Demaiffe & Torsvik, Reference Ashwal, Demaiffe and Torsvik2002), Australia (Dalziel, Reference Dalziel1991; Veevers, Reference Veevers2003, Reference Veevers2004), East Antarctica (Jacobs et al. Reference Jacobs, Fanning, Henjes-Kunst, Olesch and Paech1998), Madagascar (Handke, Tucker & Ashwal, Reference Handke, Tucker and Ashwal1999), the crudely U-shaped belt that girdles Africa as the Arabian–Nubian Shield and the Mozambique belt (Abdel-Rahman, Reference Abdel-Rahman1995; Meert & Lieberman, Reference Meert and Lieberman2008), along with other crustal segments in eastern Brazil (Silva et al. Reference Silva, McNaughton, Armstrong, Hartmann and Fletcher2005a; Silva, McNaughton & Fletcher, Reference Silva, McNaughton and Fletcher2005b), in the Avalon ‘suspect’ terrains of Newfoundland / Nova Scotia (Krogh et al. Reference Krogh, Strong, O'Brien and Papezik1988; Keppie & Dostal, Reference Keppie and Dostal1991) and in the Balkans (Haydoutov & Yanev, Reference Haydoutov and S. Yanev1997; Savov et al. Reference Savov, Ryan, Haydoutov and Schijf2001).
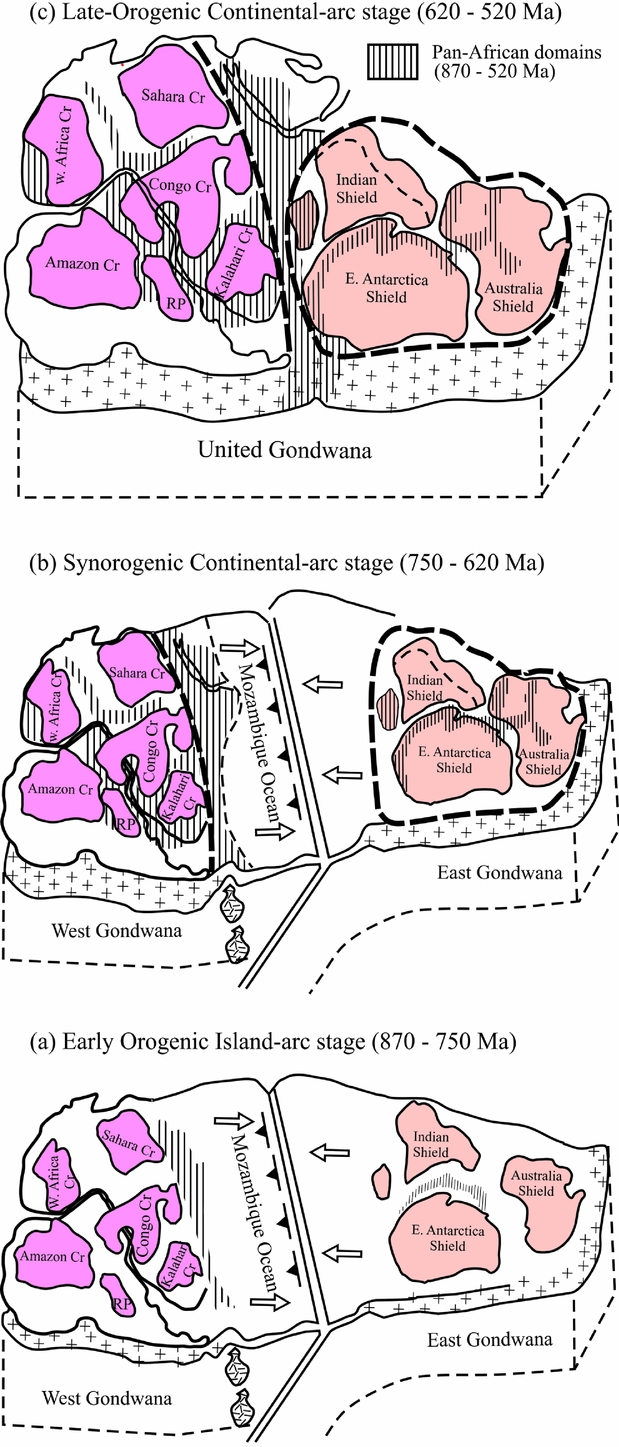
The petrogenetic scenario discussed earlier conforms to the proposal that widespread recycling of Neoproterozoic oceanic crust must have accompanied the formation and development of the MCB and similar large batholiths which form the core of the magmatic belts of the Arabian–Nubian Shield. As illustrated in Figure 13, the closure of the Mozambique Ocean took place via convergence of east and west Gondwana over three (early-orogenic, synorogenic, late-orogenic) stages. This long-lived orogenic event occurred near the end of the Proterozoic (c. 870–520 Ma; Shackleton, Reference Shackleton1996; Wilson, Grunow & Hanson, Reference Wilson, Grunow and Hanson1997). Slab melts accompanying the closure of the Mozambique Ocean during the synorogenic stage (c. 750–620 Ma; Meert, Reference Meert2002) may have produced magma for the MCB (Fig. 13). In brief, melting of a subducted Mozambique oceanic crust (transformed to eclogite in an oceanic-arc environment) generated the TTG magma of the MCB, as well as similar large batholiths forming the core of Pan-African belts.
Block diagrams showing orogenic stages of development of Pan-African belts and the reconstructed Gondwana megacontinent (modified from Meert & Lieberman, Reference Meert and Lieberman2008) via the closure of the Mozambique Ocean and the welding together of east and west Gondwana during the Neoproterozoic (870–520 Ma; Shackleton, Reference Shackleton1996; Wilson, Grunow & Hanson, Reference Wilson, Grunow and Hanson1997; Meert, Reference Meert2002). The tectono-magmatic events took place in three orogenic stages: (a) early-orogenic island-arc stage (c. 870–750 Ma) produced primitive gabbro–diorite assemblages of a juvenile crust, (b) syn-orogenic continental–arc stage (c. 750–620 Ma; Meert, Reference Meert2002) produced tonalite, trondhjemite and granodiorite lithologies (such as the MCB and similar Pan-African batholiths), and (c) late-orogenic stage (c. 620–520 Ma) produced more evolved granite–granodiorite and associated volcanic assemblages dominating the northern segment of the Arabian–Nubian Shield. The latter contributed to the final amalgamation of Gondwana.
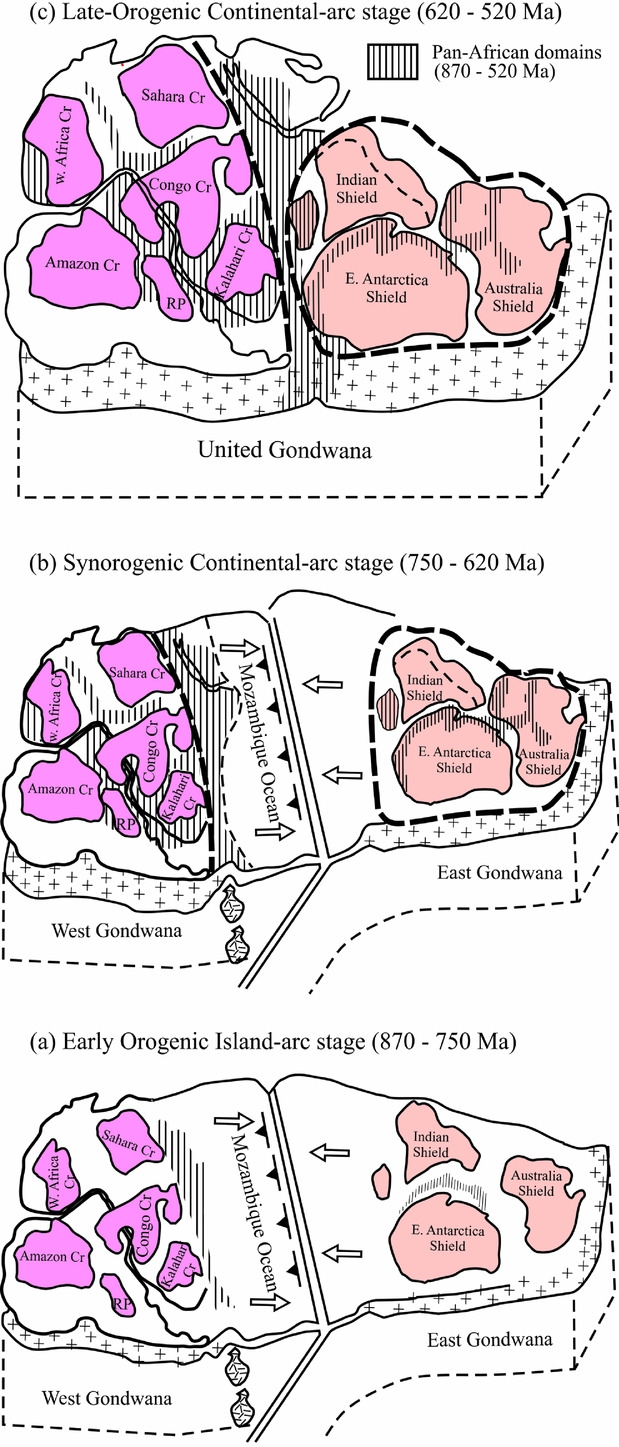
The Neoproterozoic island arc terranes of NE Africa which include several NE-trending ophiolitic suture zones and large batholiths (such as the investigated MCB) were developed and incorporated into the Arabian–Nubian Shield through a series of collisional events during the closure of the Mozambique Ocean (cf. Fig. 13), which ultimately resulted in the collision of east and west Gondwana (e.g. Dalziel, Reference Dalziel1997). Accordingly, the MCB and similar large batholiths welded together, and consolidated, vestiges of fragmented Rodinia and assembled them into a united Gondwana via various orogenic stages operated during the Neoproterozoic (cf. Fig. 13).
7. Conclusions
(a) The magmatic epidote-bearing high-Al TTG suite of the MCB exhibits a wide range of SiO2 (58.8–73.7 wt %), Al2O3 (14–19.5 wt %), Sr (316–764 ppm), Rb (19.9–71.4 ppm), Zr (73–231 ppm), moderate enrichment in REE (∑REE = 86 ppm), depletion in K, Ti, Nb, Y, Hf and HREE, with moderately fractionated REE patterns, and shows strong oceanic-arc geochemical signatures.
(b) The MCB exhibits 87Sr/86Sr isotopic compositions of 0.70352–0.70626 (with a low initial Sr ratio of 0.70259) and 143Nd/144Nd ratios of 0.51261–0.51276 (ε Nd; –0.5 to +2.4), which fall along the mantle array between those of MORB and arc-related basaltic andesites, consistent with a mantle source.
(c) A U–Pb–zircon age of 664.12 ± 0.38 Ma suggests magma generation during the synorogenic stage (c. 750–620 Ma) of the East African orogeny that accompanied the closure of the Mozambique Ocean.
(d) Anatexis of a basaltic slab under eclogitic conditions leaving garnet in the residue produces high-Al TTG rocks characterized by low (<1.8 ppm) Yb (it is 0.65–1.8 ppm in MCB), <20 ppm Y (2.2–19 ppm in MCB), <10 ppm Nb (1.2–6.4 ppm in MCB), 7–20 Nb/Ta values (7–17 in MCB), high (La/Yb)N values (11.7 in MCB), and high (>20) Sr/Y and Zr/Sm ratios (58 and 45 in MCB, respectively). Using various partial melting models and source materials, the MCB data indicate that partial melting (F = 0.25–0.50) of a subducted Mozambique oceanic crust, transformed to eclogite, leaving 15–25 % garnet in the residue, generated the MCB TTG magma.
(e) Voluminous synorogenic magmatic pulses resulting from slab melting during the closure of the Mozambique Ocean via convergence of east and west Gondwana produced the MCB and similar large batholiths which formed the core of Pan-African belts. These belts welded together vestiges of fragmented Rodinia, assembling them into a united Gondwana.
Acknowledgements
Professor R. F. Martin is thanked for discussions and useful comments. Dr Serge Nadeau is acknowledged for helpful suggestions and fruitful exchange of ideas during the initial phase of this work. Dr Z. El-Alfey of the Geological Survey of Egypt in thanked for providing facilities during the field investigation. Dr Y. Kapusta assisted by performing the radiometric isotopic analyses. I also wish to acknowledge the technical assistance provided by Mr Maroun Ijreiss and Ms Eliane Shwairi of the American University of Beirut (AUB). This work was supported by an internal AUB university research grant to the author. Thorough reviews and valuable comments provided by Dr Lauro Cézar Santos and an anonymous referee improved this contribution and are greatly appreciated.