Introduction
The semiarid American West is highly sensitive to environmental change; even small shifts in temperature and precipitation patterns may have outsized effects on regional ecology and susceptibility to wildfire (Calder et al., Reference Calder, Parker, Stopka, Jiménez-Moreno and Shuman2015). Drought and fire activity in the western United States are interrelated hazards whose impacts have become more intense over the past several decades (Abatzoglou and Williams, Reference Abatzoglou and Williams2016). Twenty-first-century moisture deficits throughout much of semiarid western North America are likely the most extreme of the past 1200 years (Williams et al., Reference Williams, Cook and Smerdon2022), while the area burned during recent fire seasons (e.g., 2020) has exceeded previously documented maxima (Higuera and Abatzoglou, Reference Higuera and Abatzoglou2021). These patterns are described at continental scales, however, and are often of limited applicability to the specific circumstances and scales at which management decisions are made. Additionally, the diversity of ecological settings over such broad spatial scales shed little light on how each unique region within the American West will be impacted by future climate change. One such unique ecoregion is the Great Basin where the landscape is a mosaic of sparsely vegetated, arid lowlands separated by patches of moister, more heavily vegetated mountain ranges. Grayson (Reference Grayson2011) describes these high-elevation ranges as “biogeographic islands” where diverse ecological communities can thrive across relatively small spatial scales. Given the distinct conditions in which these ecosystems thrive, even relatively minor changes may have large and unpredictable impacts.
Shriver and Minckley (Reference Shriver and Minckley2012) investigated a 4000 year record of fire and vegetation history from Blue Lake, NV, to better understand the resilience of these montane ecosystems to disturbances such as fire. By sampling sediments at very fine temporal resolution across intervals that archive fire events, the authors found only minor changes in the composition of vegetation, indicating a resilient ecosystem well-adapted to the fire regimes of the last 4000 cal yr BP (i.e., the Late Holocene). How fire regime might change during decadal to millennial reductions in precipitation–evaporation (P-E) balance, as are projected to occur under anthropogenic warming (Williams et al., Reference Williams, Cook, Smerdon, Cook, Abatzoglou, Bolles, Baek, Badger and Livneh2020) and as are thought to have happened during the Middle Holocene (Lachniet et al., Reference Lachniet, Asmerom, Polyak and Denniston2020), is less clear. Pollen-based climate reconstructions suggest summers in this region have gotten cooler and precipitation has increased over the course of the Holocene (Minckley et al., Reference Minckley, Whitlock and Bartlein2007), a pattern that is corroborated by speleothem records and owed largely to changing orbital configurations (Lachniet et al., Reference Lachniet, Denniston, Asmerom and Polyak2014, Reference Lachniet, Asmerom, Polyak and Denniston2020). A consistent picture of Late Holocene fire frequency, however, is difficult to resolve from existing records.
In addition to these millennial-scale trends, pronounced interannual and interdecadal climate plays an important role in the climate of the Great Basin (Wise, Reference Wise2010). Precipitation in much of the western United States is influenced by the El Niño Southern Oscillation (ENSO) and Pacific Decadal Oscillation (PDO), which generate a north-south precipitation dipole centered at about 40°N (Wise, Reference Wise2010). Recent work suggests that this transition zone has migrated several degrees of latitude over the course of the Late Holocene and that during particularly intense periods of decadal- to century-scale drought between 3100 and 1800 cal yr BP, arid conditions were both more intense and spatially widespread than the well-documented megadroughts of the Medieval Climate Anomaly (MCA) (Mensing et al., Reference Mensing, Wang, Rhode, Kennett, Csank, Thomas, Briem, Harper, Culleton and George2023). Thus, it is clear that ENSO and the PDO and the interaction of these climate systems have large impacts on ecological dynamics. Decadal- to century-scale alternations between drought and pluvial conditions can be important for structuring terrestrial ecosystems in western North America (Gray et al., Reference Gray, Betancourt, Jackson and Eddy2006). Cyclic shifts in moisture availability can also be crucial for connecting and subsequently desiccating fuels on the landscape, which can facilitate more severe fires (Cooper et al., Reference Cooper, Porinchu, Reinemann, Mark and DeGrand2021; Mark et al., Reference Mark, Abbott, Steinman, Fernandez, Wise, Walsh and Whitlock2023). As paleoclimate variability on decadal to centennial scales is poorly characterized in existing paleoclimate data in the Great Basin outside of some exceptional speleological (Belanger et al., Reference Belanger, Sharp, Kinsley, Cai, de Wet, McKenzie and Oster2025) and dendrochronological (Salzer et al., Reference Salzer, Bunn, Graham and Hughes2014) reconstructions, paired long-term reconstructions of climate–ecosystem linkages across timescales are rare.
Here, we revisit Blue Lake, NV (Shriver and Minckley, Reference Shriver and Minckley2012) and present a high-resolution X-ray fluorescence (XRF)-based reconstruction of lake level along with charcoal accumulation rates and morphological changes spanning the last 7000 years. The XRF reconstruction is of sufficient resolution and sensitivity to compare directly to long-lived Pinus longaeva (bristlecone pine) and speleothem chronologies, while also spanning major periods of climatic change during the Middle (Benson et al., Reference Benson, Kashgarian, Rye, Lund, Paillet, Smoot, Kester, Mensing, Meko and Lindström2002) and Late (Mensing et al., Reference Mensing, Sharpe, Tunno, Sada, Thomas, Starratt and Smith2013, Reference Mensing, Wang, Rhode, Kennett, Csank, Thomas, Briem, Harper, Culleton and George2023) Holocene. A charcoal accumulation record from the same cores allow us to study the relationship between fire regime and P-E balance during past periods of aridity, which may serve as a valuable analog for future conditions.
Study site
The Pine Forest Range of Humboldt County, NV, trends SSW-NNE in the northwestern quadrant of the Great Basin (Fig. 1). The range is surrounded by lower-elevation sagebrush steppe grasslands, while higher elevations host a mix of sagebrush steppe and conifer stands consisting of Pinus flexilis (limber pine), Pinus albicaulis (whitebark pine), and Populus tremuloides (aspen) (Shriver and Minckley, Reference Shriver and Minckley2012). Blue Lake (41.67°N, 118.71°W, 2434 m above sea level; Fig. 1) is a small, subalpine lake set in a glacial cirque surrounded by steep topography to the south and drains into several smaller basins to the northwest. Blue Lake is the largest and deepest lake in a complex that comprises six smaller downstream basins dammed by a moraine from the last glacial maximum. The lake was 12.5 m deep in 2019, but historic images show the water level across the complex has varied substantially over the last 30 year, at times drying out half the shallower basin (Fig. 1C). The lake is primarily replenished through snowmelt in the spring. Vegetation surrounding the lake is composed of limber pine, whitebark pine, and aspen stands with riparian species located on the banks of the lake and drainage stream (Shriver and Minckley, Reference Shriver and Minckley2012).
(A) Setting of Blue Lake, NV, and other regional proxy records referenced in the text. 1 = Blue Lake (this study); 2 = Patterson Lake, CA (Minckley et al., Reference Minckley, Whitlock and Bartlein2007); 3 = Lily Lake, CA (Minckley et al., Reference Minckley, Whitlock and Bartlein2007); 4 = Dead Horse Lake, OR (Minckley et al. Reference Minckley, Whitlock and Bartlein2007); 5 = Favre Lake, NV (Wahl et al., Reference Wahl, Starratt, Anderson, Kusler, Fuller, Addison and Wan2015); 6 = Leviathan Cave, NV (Lachniet et al., Reference Lachniet, Asmerom, Polyak and Denniston2020). (B) Average annual precipitation and temperature data from Blue Lake (from PRISM Group, Oregon State University; Daly et al., Reference Daly, Halbleib, Smith, Gibson, Doggett, Taylor, Curtis and Pasteris2008). (C) Aerial images of Blue Lake in September 2013 (top) and September 2015 (bottom), showing major changes in lake level.

Figure 1 Long description
The map with the vertical axis label, Latitude, ranging from 35 degrees N to 45 degrees N and the horizontal axis label, Longitude, ranging from 125 degrees W to 110 degrees W. State labels shown include CA, OR, NV, ID, UT and WY. Numbered markers 1 through 6 are plotted on the map. Markers 1, 2, 3 and 4 appear in the area labeled OR. Marker 5 appears in the area labeled NV. Marker 6 appears in the area labeled NV. A scale bar shows 500 kilometer and 200 mile. The combined bar and line graph. The horizontal axis shows months labeled Jan, Feb, Mar, Apr, May, Jun, Jul, Aug, Sep, Oct, Nov, Dec. The left vertical axis label is Precipitation, with unit millimeter, ranging from 0 to 8. The right vertical axis label is Temperature, with unit degree C, ranging from negative 5 to 15. Bars are shown for each month and a line with points is drawn across the months. The bars are tallest in Jan, Feb, Mar, Nov and Dec and shortest in Jul and Aug. The line rises from winter months to a peak around Jul and Aug near the upper end of the temperature axis, then declines toward Dec. Two aerial views. The first aerial view includes the text 2013 and the second aerial view includes the text 2015. Each view shows an irregularly shaped lake near the center with surrounding land features and a small letter A near one corner. The lake outline differs between the 2013 and 2015 views, with a visibly different shoreline shape and water area between the two dates.
The Pine Forest Range receives on average approximately 60 cm of precipitation per year, almost 90% of which falls between October and May (Daly et al., Reference Daly, Halbleib, Smith, Gibson, Doggett, Taylor, Curtis and Pasteris2008; Fig. 1). Interannual to decadal variations in climate are influenced by ENSO and PDO variability. The precise nature of this influence is complex, as the range is in the transition zone of the precipitation dipole (Wise, Reference Wise2010; Mensing et al., Reference Mensing, Wang, Rhode, Kennett, Csank, Thomas, Briem, Harper, Culleton and George2023). Lower elevations are much more arid and experience rain shadow–like conditions (Mock, Reference Mock1996).
Methods
Sample collection
We recovered a 3.2 m composite section from Blue Lake in September 2019 in 12.5 m of water, using a Livingstone corer off an inflatable raft. Cores were extruded into PVC half tube and transported back to the University of Pittsburgh. To preserve the flocculant surface, the upper 40 cm of sediment was collected using a surface corer fit with a piston and extruded in the field at 0.5 cm intervals into Whirl-Pak bags.
Chronological control
Age constraints for the sedimentary sequence were generated from ten 210Pb and seven 14C assays (Fig. 2, Table 1). The 210Pb analyses were carried out on freeze-dried bulk sediments at the University of Pittsburgh on a Canberra BE-3825 germanium detector. Near-surface sediment ages were modeled using a constant rate of supply model (Appleby and Oldfield, Reference Appleby and Oldfield1978). The 14C samples were pretreated according to the methodology of Santos and Ormsby (Reference Santos and Ormsby2013) and analyzed at the W.M. Keck Carbon Cycle Accelerator Mass Spectrometer facility at the University of California, Irvine, on a National Electrostatics Corporation 500kV 1.5SDH-1 Compact Accelerator Mass Spectrometer. A full age model was developed with the BChron software package (Parnell, Reference Parnell2025) using the IntCal20 calibration curve (Reimer et al., Reference Reimer, Austin, Bard, Bayliss, Blackwell, Ramsey, Butzin, Cheng, Edwards and Friedrich2020).
Age–depth model for Blue Lake, NV, core. Black line indicates mean calibrated 14C dates with 95% confidence interval within blue region.

Figure 2 Long description
Age (cal yr BP) Depth (cm) The x-axis is labeled, Age (cal yr BP), with tick labels 7000, 6000, 5000, 4000, 3000, 2000, 1000 and 0. The y-axis is labeled, Depth (cm), with tick labels 0, 50, 100, 150, 200, 250 and 300. A single curve runs from near 7000 at about 300 depth to near 0 at about 0 depth. A surrounding band encloses the curve along its full length. Seven labeled points are plotted along the curve. From left to right, the labels are, UCIAMS 224788, UCIAMS 247541, UCIAMS 247496, UCIAMS 224787, UCIAMS 247540, UCIAMS 247495 and UCIAMS 247539.
Individual age control points for Blue Lake, NV.a

Table 1 Long description
Age control points are listed by sediment-core depth, material dated, radiocarbon age when available, calibrated age, analytical error, and lab identifier. Shallow depths from 2 to 12.5 cm use bulk sediment lead 210 results with calibrated ages from about 59 years before present to 25 years before present, with small errors of about 3 to 11 years. Deeper levels use plant macrofossil radiocarbon dates, with calibrated ages that generally increase with depth: about 1,500 years before present at 48 to 49 cm, about 1,290 at 63 to 64 cm, about 1,810 at 95 to 96 cm, about 2,700 at 164 to 165 cm, about 4,055 at 243 to 245 cm, about 5,550 at 270 to 272 cm, and about 6,770 at 304 to 306 cm. Radiocarbon ages in years before present range from 1,355 to 5,905 for these macrofossil samples. Reported uncertainties are lowest for several macrofossil dates at about 15 to 30 years and highest at 95 to 96 cm at about 60 years. One minor reversal occurs where 63 to 64 cm is younger than 48 to 49 cm, so age depth modeling should account for uncertainty and potential reworking or calibration effects.
a First nine samples are 210Pb ages and the remaining ages are 14C ages from plant macrofossils.
Sedimentology and stratigraphy
Loss-on-ignition (LOI) analysis was carried out on 1 cm3 samples taken at 1 cm resolution and prepared according to the methodology of Heiri et al. (Reference Heiri, Lotter and Lemcke2001). Samples were initially dried at 60°C for 24 hours to remove water and weighed to determine dry bulk density. These samples were then placed in crucibles and combusted at 550°C to calculate the total percentage of organic matter content in each sample. Samples were then re-combusted at 1000°C and reweighed to determine carbonate and mineral content.
XRF analysis
Livingstone cores were scanned on an ITRAX XRF scanner at the University of Minnesota Duluth’s Large Lakes Observatory at 0.1 cm resolution from 43 to 221 cm composite depth (where sediments are finely laminated) and at 0.5 cm resolution from 221 cm to the base at 309.5 cm (where the cores are largely composed of coarser gravels and massive stratigraphy; Schnurrenberger et al., Reference Schnurrenberger, Russell and Kelts2003). Scans were conducted with a 15 second dwell time using a chromium tube.
Charcoal analysis
Macroscopic charcoal analysis was conducted using the methodology of Whitlock and Larsen (Reference Whitlock, Larsen, Smol, Birks, Last, Bradley and Alverson2002). Contiguous 2 cm3 samples were taken at 1 cm resolution and placed in 50 mL of a solution consisting of equal parts 8% sodium hypochlorite (NaClO) and sodium hexametaphosphate (Na6[PO3)6]). The samples remained in solution for at least 24 hours to properly disaggregate the sediment and remove all organic matter, excluding the existing charcoal particles. A >125 µm sieve was then used to wash the samples of any sediment. What remained of the samples was rinsed into small, capped plastic containers to be stored before counting. The total number of charcoal fragments were counted under light microscope magnification for each sample and separated by morphology (herbaceous and woody) according to the classification scheme of Walsh et al. (Reference Walsh, Duke and Haydon2018; Supplementary Fig. S1).
Charcoal concentration values (particles/cm3) for each sample were then used in the CHAR analysis program (Higuera, Reference Higuera2009) to calculate charcoal accumulation rates (CHAR), background charcoal accumulation (BCHAR), and charcoal peaks representing fire episodes, as well as other statistical analyses. A locally weighted scatterplot smoothing, robust to outliers (LOWESS) method was used to calculate long-term, low-frequency changes in BCHAR and account for outliers in the data. This trend was then smoothed over 500 year intervals, similar to values employed by previous fire reconstructions in the Great Basin and semiarid western North America (Brunelle and Anderson, Reference Brunelle and Anderson2003; Gavin et al., Reference Gavin, Hu, Lertzman and Corbett2006; Hallett and Anderson, Reference Hallett and Anderson2010). High-frequency CHAR or “peaks” were calculated as a ratio between charcoal accumulation rates (interpolated using median sample resolution) and BCHAR. Fire episodes occur at any point where the peak component exceeds BCHAR levels. Peak frequency was determined over the course of 1000 year moving windows.
Time series and statistical analysis
Spectral analyses were carried out using the R package Astrochron (Meyers, Reference Meyers2014). XRF data were scanned at 0.1 cm resolution between 43 and 220 cm (the finely laminated interval of the core) and at 0.5 cm resolution between 220 cm and the base (320 cm). The XRF data were interpolated to 2 year timesteps between 43 and 220 cm (the approximate median temporal resolution of the core at that depth step) and left at their native resolution elsewhere. Spectral analysis was conducted on the interpolated section using the multi-taper method (MTM; Mann and Lees, Reference Mann and Lees1996). Wavelet analyses of the interpolated section and the Leviathan Cave speleothem record (Lachniet et al., Reference Lachniet, Asmerom, Polyak and Denniston2020) were conducted using the Cross Wavelet package developed in MATLAB by Grinsted et al. (Reference Grinsted, Moore and Jevrejeva2004), with samples interpolated to 20 year increments. Significance levels for Pearson’s correlation coefficients between time series where autocorrelation was present were calculated by adjusting the effective degrees of freedom per the methods of Hu et al. (Reference Hu, Emile-Geay and Partin2017).
Results
Sedimentology, stratigraphy, and chronology
The full Blue Lake sediment core spans 320 cm, with the uppermost 43 cm collected by a surface core and the remainder with a Livingstone corer. At depths greater than approximately 250 cm (4400–4000 cal yr BP), the core is marked by low organic content, high bulk density, and light sediment color (Fig. 3). Above this, mineral content and density generally decrease toward the top of the sequence and sediment color gets generally darker (Fig. 3). Beneath this contact (the lowest ∼60 cm of the core), the sediments are marked by generally massive and banded stratigraphy, while finer (centimeter-scale) laminae predominate above 250 cm (Supplementary Fig. S2). The core is punctuated by two prominent peaks in dry bulk density and mineral content with low organic matter concentrations occurring between 234–248 and 155–164 cm (3770–4160 and 2470–2660 cal yr BP), respectively. At these intervals there are visible abrupt transitions in stratigraphy from fine- to coarse-grained sediment that is extremely dense and mineral-rich (Fig. 3). Organic matter exceeds 30% at only two intervals between 65–66 (1100–1500 cal yr BP) and 136–137 cm (2050–2450 cal yr BP), respectively. These peaks are preceded by periods of lower organic matter concentration (Fig. 3). The visual stratigraphy consists of alternating bands of light and dark facies (Fig. 3, Supplementary Fig. S2). Lighter facies are associated with higher inorganic mineral content, while darker facies represent relatively more organic-rich sediments (Fig. 3).
Results from Blue Lake, NV, from top to bottom: charcoal accumulation by morphotype, CIELAB a* sediment color, first principal component from X-ray fluorescence (XRF) dataset (positive values are associated with common terrigenous minerals), dry bulk density of sediment, percent mineral composition (negatively associated with organic matter), magnetic susceptibility, and the location by depth of the seven radiocarbon ages and 210Pb analyses.

Figure 3 Long description
Age (cal yr BP) Seven stacked line plots share the same horizontal axis labeled, Age (cal yr BP). The scale runs from 0 to 8000. Top plot: The left vertical axis is labeled, Charcoal (counts), with tick labels at 0, 50, 100 and 150. Two lines are shown, labeled, Herbaceous and, Woody. The Herbaceous line stays near the bottom with small fluctuations and several narrow spikes. The Woody line is higher and more variable, with multiple narrow spikes, including tall spikes around the mid range of the age axis. Second plot: A single black line is shown. The right vertical axis is labeled, a times, with tick labels at 1.5, 5, 10 and 15. The line fluctuates frequently across the full age range. Third plot: A red line is shown. The left vertical axis is labeled, PC1, with the word, Erosion, printed vertically beside it. The line stays near 0 for much of the record, with several sharp peaks, including a prominent peak near the middle of the age axis. Fourth plot: A black line is shown. The right vertical axis is labeled, Dry BD (g cm superscript -3), with tick labels at 0.5, 1.0 and 1.5. The line varies around about 1.0 with several narrow peaks. Fifth plot: A gray line is shown. The left vertical axis is labeled, Mineral matter (percent), with tick labels at 70, 80, 90 and 100. The line trends upward overall with several sharp peaks. Sixth plot: A blue line is shown. The right vertical axis is labeled, Mag susc (SI), with tick labels at 0, 20, 40 and 60. The line stays near 0 for long intervals and has multiple narrow spikes, including several tall spikes in the earlier part of the age axis. Bottom plot: A blue line with circular markers is shown. The left vertical axis is labeled, Depth (cm), with tick labels at 0, 50, 150, 250 and 350. The line slopes downward from near 0 centimeters at age 0 to near 350 centimeters by about 7000 to 8000 on the age axis. Several blue circular points lie on the line at spaced ages.
The bottommost radiocarbon age, collected 15 cm above the base of the core, returns a calibrated age of 6720 yr BP (± 25 yr). An extrapolated sedimentation rate of approximately 0.05 cm/yr suggests the base of the core is approximately 7000 years old and there is no evidence of the Mazama tephra (7600 yr BP; Figs. 2 and 3). The contact between generally banded and massive inorganic sediments and more laminated, organic-rich sediments occurs at approximately 4000 cal yr BP. An age reversal occurs between the two youngest 14C dates; the uppermost sample was excluded from the final age model (Fig. 2). Because of the apparent lack of high-frequency variability in the core below this contact, the XRF sampling resolution decreases from 0.1 to 0.5 cm. Due to this change in sampling resolution, as well as the fact that only two chronological control points lie within the low-resolution section, we avoid interpreting centennial-scale changes in the stratigraphy before 4000 cal yr BP.
Charcoal
Charcoal is present in all sediment intervals. The signal-to-noise index of fire events detected in CharAnalysis generally exceeds 3, indicating peaks (localized fire events) can successfully be delineated from background flux values (Kelly et al., Reference Kelly, Higuera, Barrett and Hu2011). Charcoal accumulation rates (CHAR) are generally less than 1 particle/cm2/yr throughout the record (Fig. 4). Fire events, as delineated by CharAnalysis, are relatively rare (between 1 and 3 per 1 ka) before 3800 cal yr BP, increasing to approximately 5 events per 1 ka by 2500 cal yr BP. A decline in fire frequency occurs between 2500 cal yr BP and 1500 cal yr BP, before increasing to maximum Holocene values (of approximately 8 fires per 1000 years) over the last millennium (Fig. 4). These trends are broadly consistent with other results from this site published by Shriver and Minckley (Reference Shriver and Minckley2012).
Charcoal summary from Blue Lake, NV. Top, charcoal accumulation rate (CHAR) for the duration of the record. Red dots in the top panel indicate individual fire events resolved from CharAnalysis. Note diagonal black lines on y-axis of top panel, denoting axis break. Bottom, proportion of woody morphotypes (dark red line) and fires per 1000 years (smoothed orange line). Gray bars indicate low-stand features.

Figure 4 Long description
Two vertically stacked time series plots share the x-axis label, Age, cal yr BP, with tick labels at 0, 1000, 2000, 3000, 4000, 5000, 6000 and 7000. Upper plot: The y-axis label is Charcoal Accumulation Rate, particles centimeter superscript minus 2 year superscript minus 1. The y-axis has an axis break marked by diagonal slashes. A continuous line shows frequent narrow spikes across the full age range, including several tall spikes that extend into the upper broken-axis region. Small circular markers appear along the upper part of the plot. Two vertical shaded bands span the plotting height, positioned around the 2000 to 3000 age region. Lower plot: The left y-axis label is percent woody morphotypes, percent, with tick labels from 0 to 100 in increments of 10. The right y-axis label is Fires per 1000 years, with tick labels from 0 to 8 in increments of 1. Two lines are plotted: one line corresponds to percent woody morphotypes on the left axis and fluctuates mainly between about 10 percent and about 60 percent, with higher values early in the record and lower values toward the middle ages. A second, smoother line corresponds to Fires per 1000 years on the right axis and varies between about 0 and about 8, with higher values near the youngest ages, lower values through much of the mid record and a later rise and fall toward older ages. The same two vertical shaded bands appear in the lower plot at the same age positions as in the upper plot.
Charcoal particles are primarily herbaceous throughout, but especially during the earliest part of the record (7000–3800 cal yr BP; Fig. 3). The highest raw charcoal counts of the entire Blue Lake fire record occurred at depths of 147 and 234 cm (Fig. 4). These peaks in raw charcoal abundance both occur within areas of the core containing coarser-grained, high-density mineral clasts and lower organic matter (Fig. 3). These prominent spikes, among most other fire events within the raw charcoal record, displayed higher percentages of woody charcoal particles as opposed to the herbaceous morphology.
Scanning XRF
We performed a principal component analysis (PCA) on the Blue Lake XRF dataset. The first principal component (hereafter XRF-PC1) explains approximately 78% of the overall variance in the dataset and is therefore the sole factor discussed further here (Supplementary Fig. S3). XRF-PC1 is positively correlated with Ti, Si, Ca, Sr, K, Rb, Fe, and Mn, all common terrigenous indicators (Brown, Reference Brown, Croudace and Rothwell2015; Supplementary Figs. S3 and S4). Carbon, which is too light to be detected using traditional scanning XRF methods, is often associated with high values of incoherent/coherent (Inc/Coh) scatter (Davies et al., Reference Davies, Lamb, Roberts, Croudace and Rothwell2015). Inc/Coh is strongly anti-correlated with XRF-PC1. XRF-PC1 and percent mineral abundance show similar trends over the course of the record, although XRF-PC1 has greater temporal resolution and can thus be used to resolve shorter-term changes in mineral flux.
Discussion
Climatic interpretation of sedimentological proxies
XRF-PC1, mineral content, dry bulk density, and magnetic susceptibility all reflect erosion and terrigenous input from the surrounding catchment and are also sensitive to changes in lake level (Schnurrenberger et al., Reference Schnurrenberger, Russell and Kelts2003). While elevated mineral content is sometimes an indicator of runoff-driven high-energy lithofacies (e.g., Dearing, Reference Dearing1991; Bernttson et al., Reference Berntsson, Jansson, Kylander, De Vleeschouwer and Bertrand2015), it can also represent shallow-water facies formed during low lake stands and drought conditions (e.g., Abbott et al., Reference Abbott, Binford, Brenner and Kelts1997, Reference Abbott, Finney, Edwards and Kelts2000; Finkenbinder et al., Reference Finkenbinder, Abbott, Edwards, Langdon, Steinman and Finney2014). We interpret sediments here to reflect the latter case. The mineral-rich sediments in the Middle Holocene portion of the record lack fining-upward deposits and clear contacts associated with abrupt sediment delivery (Allen Reference Allen1965; Sabatier et al., Reference Sabatier, Moernaut, Bertrand, Van Daele, Kremer, Chaumillon and Arnaud2022). Blue Lake is also situated in a small alpine catchment with no clear inflow to deliver terrestrial sediments during high-flow conditions (Fig. 1); it is more likely that inorganic sedimentation is driven by processes like shoreline erosion and reworking during periods of lower than present lake levels (Digerfeldt, Reference Digerfeldt, Berglund and Ralska-Jasiewiczowa1986; Shuman et al., Reference Shuman, Pribyl and Buettner2015). Also notable is the coarse-grained, massive inorganic stratigraphy and complete absence of laminae, another classic sign that these inorganic sediments were deposited under low-stand conditions (Schnurrenberger et al., Reference Schnurrenberger, Russell and Kelts2003). High evapotranspiration, and lower water levels decrease the distance between the lake’s depocenter, where the cores were collected, and the source of the clastic material on the steep headwalls of the catchment. Pluvial periods, when P-E balance is high, create the opposite pattern, increasing the proportion of fine-grained organic material deposited at the coring location (Abbott et al., Reference Abbott, Binford, Brenner and Kelts1997, Reference Abbott, Finney, Edwards and Kelts2000; Schnurrenberger et al., Reference Schnurrenberger, Russell and Kelts2003; Finkenbinder et al., Reference Finkenbinder, Abbott, Edwards, Langdon, Steinman and Finney2014). Thus, we interpret high values of XRF-PC1, percent mineral material, and magnetic susceptibility, all of which are positively correlated (Fig. 3), to be indicators of lower lake levels. The Late Holocene portion of the core, after approximately 3800 cal yr BP is characterized by millimeter- to centimeter-scale laminations, darker color, and higher organic content. Increased P-E balance would raise lake levels and allow for the formation of light–dark couplets without disruption via bioturbation or wave energy. Given the variable shorelines observed with satellite imagery between 1999 and 2015 CE (Fig. 1C), lake level is highly responsive to interannual fluctuations in climate. Thus, with sufficiently high sampling resolution, these proxies at Blue Lake faithfully record sub-decadal shifts in lake level.
Long-term lake-level changes in regional climate context
The warmest and driest conditions in the Great Basin occurred during the Early Holocene, likely driven by peak summer insolation values before the establishment of a permanent lake at approximately 7000 cal yr BP (e.g., Lachniet et al., Reference Lachniet, Asmerom, Polyak and Denniston2020; Saban and Gavin, Reference Saban and Gavin2025). The base of the Blue Lake sediment core is coarse-grained sand that represents a sustained period of seasonal lake desiccation. Although lacustrine sediments were deposited after ∼7000 cal yr BP, conditions remained arid and evaporative throughout the Middle Holocene as indicated by centimeter-scale bands of sediment layers with high values for all erosion-sensitive proxies, including lighter color represented by the reflectance parameter a* (Murton and Crowhurst Reference Murton and Crowhurst2020), higher bulk density, elevated mineral content, and higher XRF-PC1 representing elements in clastic sediments (Fig. 3). Between 4200 and 3800 cal yr BP, a marked increase in all erosion-sensitive proxies indicates a prolonged low stand. At 3800 cal yr BP, a notable shift in sedimentary facies occurs characterized by finer grain size and millimeter-scale laminations composed of darker organic-rich material, lower bulk density, lower mineral matter content, and decreased XRF values reflecting deeper water sedimentation. We interpret this to reflect a period of consistently higher water levels. A second low-water stand occurred between 2600 and 2400 cal yr BP as indicated by higher values for all erosion-sensitive proxies, after which sedimentation returned to millimeter-scale laminae characteristic of deeper water sedimentation until present (Smoot et al., 1988; Fig. 3, Supplementary Fig. S2).
Throughout the Great Basin, the Early and Middle Holocene have been characterized as an arid, warm period compared with modern (Wahl et al., Reference Wahl, Starratt, Anderson, Kusler, Fuller, Addison and Wan2015; Lachniet et al., Reference Lachniet, Asmerom, Polyak and Denniston2020). Lachniet et al. (Reference Lachniet, Asmerom, Polyak and Denniston2020) synthesized hydroclimate records from around the Great Basin into a single Aridity Index that documents increasing moisture after about 7000 cal yr BP (Fig. 5). Pollen-based evidence from the few other continuous Great Basin paleolimnological records suggests lower proportions of riparian taxa and pine between 7600 and 5800 cal yr BP (Wahl et al., Reference Wahl, Starratt, Anderson, Kusler, Fuller, Addison and Wan2015), with an estimated increase in annual precipitation of approximately 100 mm between 6000 cal yr BP and present (Minckley et al., Reference Minckley, Whitlock and Bartlein2007). Chironomid-inferred warm-season temperature reconstructions from Stella Lake in eastern Nevada suggest maximum Holocene warmth occurred at approximately 5400 cal yr BP and that conditions began to cool at approximately 4000 cal yr BP (Reinemann et al., Reference Reinemann, Porinchu, Bloom, Mark and Box2009), during what has widely been described as a “Neoglacial” in the Great Basin and North American Cordillera (Porter and Denton, Reference Porter and Denton1967; Briner and Porter, Reference Briner and Porter2018; Larsen et al., Reference Larsen, Crump and Blumm2020).
Middle to Late Holocene paleoclimate records from around the Great Basin (top to bottom): first principal component from X-ray fluorescence dataset (XRF-PC1) and percental mineral abundance, Blue Lake, NV (this study); speleothem 13C and 18O from Leviathan Cave, NV (Lachniet et al., Reference Lachniet, Asmerom, Polyak and Denniston2020); bristlecone pine–derived July–September temperature anomaly (Salzer et al., Reference Salzer, Bunn, Graham and Hughes2014); regional aridity index (Lachniet et al., Reference Lachniet, Asmerom, Polyak and Denniston2020); and fire events per 1000 years from Blue Lake (this study). Gray vertical bars highlight the two low-stand features. Middle Holocene aridity and high temperatures (uppermost six panels) are associated with less frequent significant fires, as resolved from CharAnalysis (bottom panel). Blue lines indicate data from this study, and black lines indicate data from Salzer et al. (Reference Salzer, Bunn, Graham and Hughes2014) and Lachniet et al. (Reference Lachniet, Asmerom, Polyak and Denniston2020).

Figure 5 Long description
The horizontal axis is labeled, Age (cal yr BP), ranging from 0 to 8000. The first time series panel has a left vertical axis labeled, Blue Lake XRF PC1, with tick labels at minus 5, 0, 5 and 10. A line varies around 0 with a sharp peak near 3000 reaching close to 10, then returns toward 0 and shows smaller fluctuations through 8000. The same panel has a right vertical axis labeled, Blue Lake dolomite percent, with tick labels at 60, 70, 80, 90 and 100. A second line varies between about 60 and 100, with a pronounced dip near 4000 and higher values after about 5000. The second time series panel has a left vertical axis labeled, Leviathan delta C (per mil), with tick labels at minus 10, minus 8, minus 6, minus 4, minus 2 and 0. A line shows frequent oscillations, with larger swings before about 3000 and smoother variation after about 4000. The same panel has a right vertical axis labeled, Leviathan delta O (per mil), with tick labels at minus 12.5, minus 11.5, minus 10.5 and minus 9.5. A second line varies within that range and shows a broad rise after about 4000. The third time series panel has a left vertical axis labeled, Bristlecone JAS Anom (degrees C), with tick labels at minus 2, 0, 2 and 4. A line rises from near 0 at younger ages to higher values around 3000 to 4000, then declines toward about 0 by about 8000. The fourth time series panel has a right vertical axis labeled, Great Basin Aridity Index, with tick labels at 0.3, 0.5, 0.7 and 0.9. A line increases from about 0.3 to about 0.7 by around 4000, then remains between about 0.6 and 0.8 through 8000. The fifth time series panel has a left vertical axis labeled, Blue Lake Wt percent Fire, with tick labels at 0, 2, 4, 6 and 8. A line starts near 0 at younger ages, rises to about 2 by around 3000, reaches about 6 near 4500, then varies between about 4 and 7 through 8000. Two vertical shaded bands span all panels, one centered near 3000 on the age axis and one centered near 4000 on the age axis.
An extremely long-lived bristlecone pine temperature reconstruction (Salzer et al., Reference Salzer, Bunn, Graham and Hughes2014) and the XRF-PC1 record are closely correlated for the approximately 3000 year period covered by both records (i.e., cooler summer temperatures are associated with lower terrigenous sedimentation and thus higher lake levels) (Fig. 6). This close correspondence between moisture-sensitive and temperature-sensitive proxy records suggest that warm temperatures and increased evaporative stress have been associated with drier conditions in the Great Basin during the Early to Middle Holocene with wetter, cooler conditions during the Middle to Late Holocene (Lachniet et al., Reference Lachniet, Asmerom, Polyak and Denniston2020; Fig. 6).
First principal component from X-ray fluorescence dataset (XRF-PC1) from Blue Lake, NV (top) and July–September temperature anomaly from bristlecone pine chronologies (bottom; Salzer et al., Reference Salzer, Bunn, Graham and Hughes2014) between 0.8 and 3.7 ka BP. Higher temperatures are associated with higher XRF-PC1 values, indicating a link between higher temperature and increased aridity. Gray bar indicates low-stand feature. The r and P values on the figure indicate Pearson’s correlation coefficient and significance value between the two records over the time window displayed.

Abrupt changes and megadroughts in the sedimentary record of Blue Lake, NV
We interpret the dense, mineral-rich, organic-poor increments formed between 4200–3800 and 2600–2400 cal yr BP as prominent multi-century low-stand facies. These abrupt transitions into these features are marked by a complete absence of lamination, coarser grain size, higher mineral matter content, and high bulk density (Fig. 3), all consistent with deposition in shallow water or a seasonally desiccated environment (e.g., Abbott et al., Reference Abbott, Binford, Brenner and Kelts1997, Reference Abbott, Finney, Edwards and Kelts2000). These low-stand deposits were previously described by Shriver and Minckley (Reference Shriver and Minckley2012), who concluded they were landslide debris. While some degree of widespread vegetation mortality related to drought may have increased landscape instability and terrestrial erosion, we suggest these deposits are more likely indicative of pronounced, long-term changes in lake level. Cores collected in this analysis were taken from greater water depths (despite lower overall water levels) and indicate the sediment packages in the depocenter are thicker (13–14 cm) than those reported by Shriver and Minckley (Reference Shriver and Minckley2012) (3–10 cm). Radiocarbon dates taken above and below the deposits indicate these deposits represent relatively long (multi-centennial) spans of time (Table 1). Thus, we conclude these deposits are more likely reflective of changes in lake level rather than short-lived landscape instability and slopewash events.
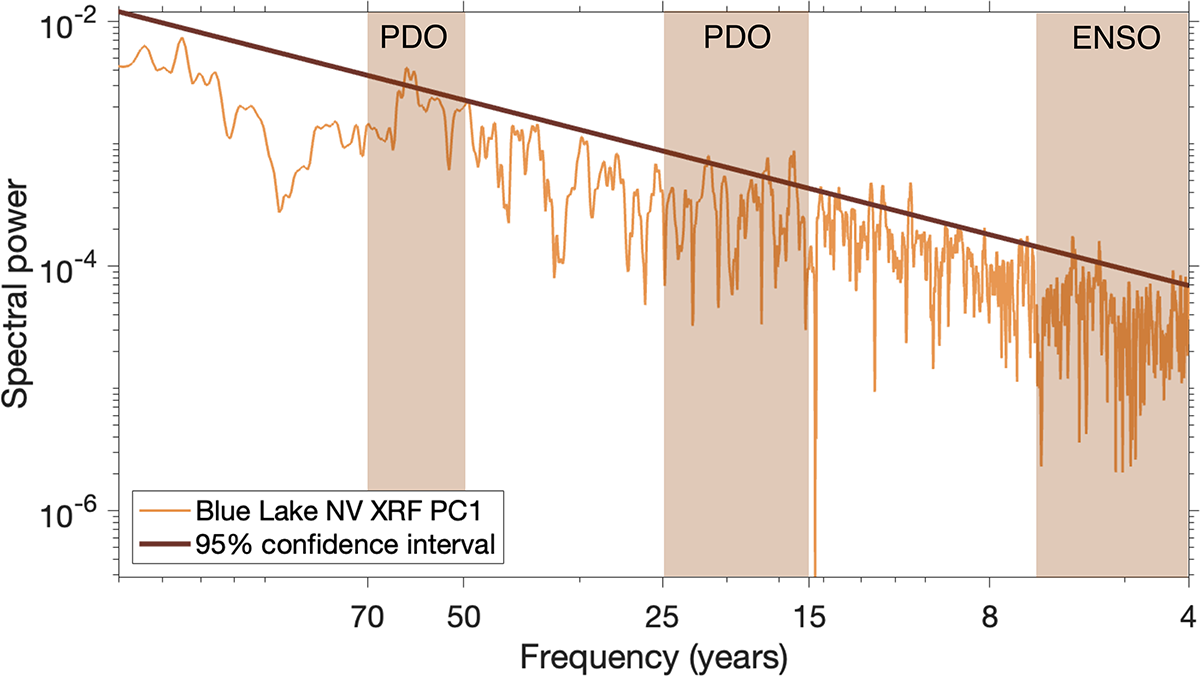
The first of these two low-stand features begins at 4200 cal yr BP, during a period of widespread change in hydroclimate across broad swaths of North America (Booth et al., Reference Booth, Jackson, Forman, Kutzbach, Bettis, Kreigs and Wright2005), and shifts toward more intense El Niño– and PDO-like Pacific Ocean–atmosphere circulation patterns (Broadman et al., Reference Broadman, Kaufman, Henderson, Malmierca-Vallet, Leng and Lacey2020; Du et al., Reference Du, Hendy, Hinnov, Brown, Zhu and Poulsen2021). Drought conditions are apparent in several reconstructions to the south and east of Blue Lake (Little Molas Lake, CO [Shuman et al., Reference Shuman, Henderson, Colman, Stone, Fritz, Stevens, Power and Whitlock2009]; Emerald Lake, CO [Shuman et al., Reference Shuman, Carter, Hougardy, Powers and Shinker2014]; Upper Big Creek Lake, CO [Shuman et al., Reference Shuman, Pribyl and Buettner2015]; and Highway 130 Lake, WY [Liefert and Shuman, Reference Liefert and Shuman2022]). This occurs contemporaneously with widespread dune formation in the western United States (Booth et al., Reference Booth, Jackson, Forman, Kutzbach, Bettis, Kreigs and Wright2005). Water levels at Blue Lake increase at 3800 cal yr BP, and the stratigraphy becomes more finely laminated and organic-rich (Figs. 3 and 5). Other proxy records in the region suggest a transition to greater P-E and cooler temperatures immediately thereafter (Fig. 5). Barron and Anderson (Reference Barron and Anderson2011) suggest a transition from generally La Niña– to El Niño–like conditions occurred at ∼4000 cal yr BP. Other work indicates that the North Pacific experienced a state change toward a stronger Aleutian Low at 4000 cal yr BP as well, consistent with a strengthened ENSO state (Broadman et al., Reference Broadman, Kaufman, Henderson, Malmierca-Vallet, Leng and Lacey2020). This is consistent with drier conditions throughout the southwest before 4000 cal yr BP and wetter conditions immediately thereafter (Fig. 5). Oxygen isotope records from Castor and Round Lake, WA, north of the ENSO/PDO dipole boundary, indicate enhanced cool-season precipitation during the Middle Holocene, transitioning at about 4000 cal yr BP (Mark et al., Reference Mark, Whitlock, Abbott, Steinman, Fernandez and Steeple2024). Blue Lake, NV, sits within the so-called dipole “transition zone” between 40°N and 42°N, which contracts and expands depending on inter-ocean basin interactions (Wise, Reference Wise2010). This proximity to the transition zone may in part explain conflicting timings for dry periods within the Great Basin (Mensing et al., Reference Mensing, Wang, Rhode, Kennett, Csank, Thomas, Briem, Harper, Culleton and George2023). While the relationship between ENSO/PDO phase and individual lake-level changes at Blue Lake is not resolvable, the impact of these modes on spectral characteristics at approximately 4000 yr BP is apparent. At both Blue Lake and Leviathan Caves, significant sub-decadal and multidecadal periodicities associated with ENSO and the PDO become prominent features of the records after 4000 cal yr BP (Figs. 5 and 7, Supplementary Fig. S5). This, too, suggests that Pacific climate phenomena are significant in pacing water balance changes in the Great Basin, at least over the past 4000 cal yr BP.
Multi-taper method (MTM) periodogram of Blue Lake, NV, first principal component from X-ray fluorescence dataset (XRF-PC1; which explains 78% of total XRF variance) over the past 4000 years, illustrating statistically significant spectral power at frequencies corresponding to known Pacific Ocean–atmosphere climate modes. Vertical windows highlighted in orange indicate 2–8 yr periodicity characteristic of El Niño Southern Oscillation (ENSO; high-frequency end clipped at 4 years due to the Nyquist frequency imposed by sampling resolution), and both 15–25 and 50–70 yr periodicities associated with the Pacific Decadal Oscillation (PDO; Mantua and Hare, Reference Mantua and Hare2002). This suggests sediment delivery to Blue Lake has been persistently and dominantly paced by Pacific-driven hydroclimate variability throughout the past 4000 years.

Figure 7 Long description
Spectral power. The horizontal axis is labeled, Frequency years, with tick labels 70, 50, 25, 15, 8 and 4. The vertical axis is labeled, Spectral power, with tick labels 10 superscript 2, 10 superscript 0, minus 10 superscript 2, minus 10 superscript 4 and minus 10 superscript 6. A legend shows two entries, Blue Lake NV XRF PC1 and 95 percent confidence interval. One jagged line runs from left to right, starting near 10 superscript 2 at the left edge and generally decreasing toward the right, reaching values near minus 10 superscript 6 close to the right edge. A smooth curved line runs above the jagged line and slopes downward from left to right. Three vertical shaded bands appear across the plot area. The left band is labeled, Pacific Decadal Oscillation and spans around the 70 to 50 region on the horizontal axis. The middle band is labeled, Pacific Decadal Oscillation and spans around the 25 to 15 region. The right band is labeled, El Nino Southern Oscillation and spans around the 8 to 4 region.
The second low-stand feature from 2600 to 2400 cal yr BP occurs during an approximately 1300 year dry period beginning at 3100 cal yr BP in the Great Basin (Mensing et al., Reference Mensing, Sharpe, Tunno, Sada, Thomas, Starratt and Smith2013, Reference Mensing, Wang, Rhode, Kennett, Csank, Thomas, Briem, Harper, Culleton and George2023; Lyon et al., Reference Lyon, Erhardt, Streib, Zimmerman and McGlue2025). Depositional hiatuses and low-stand features from wet meadows in Nevada all record low water levels during this period (Mensing et al., Reference Mensing, Wang, Rhode, Kennett, Csank, Thomas, Briem, Harper, Culleton and George2023). Sedimentological evidence from Mono Lake, CA, documents low lake levels overlapping almost entirely with the second low-stand feature from Blue Lake (Davis, Reference Davis1999). At Newark Valley and Dufurrena Ponds, NV, encroachment of grasses and salt-desert shrubs indicate heightened aridity beginning at 2600 cal yr BP, overlapping with the end of this low-stand feature (Mensing et al., Reference Mensing, Benson, Kashgarian and Lund2004, Reference Mensing, Wang, Rhode, Kennett, Csank, Thomas, Briem, Harper, Culleton and George2023). Pollen and oxygen isotopes from Pyramid Lake, NV, also suggest dry conditions between 2600 and 2000 cal yr BP (Benson et al., Reference Benson, Kashgarian, Rye, Lund, Paillet, Smoot, Kester, Mensing, Meko and Lindström2002; Mensing et al., Reference Mensing, Benson, Kashgarian and Lund2004). The spatial signature of these droughts generally conforms to the ENSO/PDO hydroclimate dipole, which suggests prolonged periods when climate remains in a state analogous to La Niña (Mensing et al., Reference Mensing, Wang, Rhode, Kennett, Csank, Thomas, Briem, Harper, Culleton and George2023; Belanger et al., Reference Belanger, Sharp, Kinsley, Cai, de Wet, McKenzie and Oster2025). Many of these records, however, indicate maximum aridity occurring between 2000 and 1800 cal yr BP (Mensing et al., Reference Mensing, Wang, Rhode, Kennett, Csank, Thomas, Briem, Harper, Culleton and George2023), when the Blue Lake record suggests generally higher lake levels (Fig. 5). Another alpine lake from northern Nevada, Favre Lake, also fails to document any abrupt event during this period (Wahl et al., Reference Wahl, Starratt, Anderson, Kusler, Fuller, Addison and Wan2015). Uncertainty associated with the respective age models from each core may explain part of the difference in timing; however, the uncertainty on the individual radiocarbon dates from the Blue Lake core are less than 100 years. This could reflect a reduced expression of this drought at higher elevational settings or simply an uneven and possibly transitory boundary of the ENSO/PDO dipole in time (Wise, Reference Wise2010). Widespread and apparently unforced long-term drought conditions in proxy records from around the Great Basin suggest that despite long-term trends toward increasing moisture balance after the Middle Holocene, periodic and extensive droughts with no clear forcing are persistent features of Great Basin climate.
Fire, fuel, and climate from the Middle Holocene to present
The two most prominent charcoal accumulation peaks in the Blue Lake record occur within these low-stand features (Fig. 4). This suggests an increase in fires near the catchment during these prolonged droughts; however, it is also likely that the magnitude of these peaks is primarily a function of brief pulses of terrestrial erosion in the aftermath of severe fire (Soto et al., Reference Soto, Basanta, Perez and Diaz-Fierros1995; Carcaillet et al., Reference Carcaillet, Richard, Asnong, Capece and Bergeron2006; Pompeani et al., Reference Pompeani, McLauchlan, Chileen, Calder, Shuman and Higuera2020), leading to more charcoal particles washing into the lake, rather than to the magnitude of the individual fire event. This so-called secondary charcoal component has been shown to accumulate in sediments for extended periods after certain fires (Anderson et al., Reference Anderson, Davis, Miller and Stuckenrath1986; Cooper et al., Reference Cooper, Porinchu, Reinemann, Mark and DeGrand2021). As such, we do not interpret these charcoal peaks to reflect a prolonged increase in fire proportional to their magnitude in the charcoal accumulation record.
The Blue Lake charcoal accumulation record indicates low-intensity fires predominated before 4000 cal yr BP. Only five distinct peaks occurred within the first approximately 3000 years of the record (Fig. 4). Additionally, the Middle Holocene is marked by the highest proportions of herbaceous versus woody charcoal (Fig. 4), suggesting a fire regime dominated by low-intensity ground fires before 4000 cal yr BP (Walsh et al., Reference Walsh, Duke and Haydon2018). While large-scale fire events may not have been common at this time, it is possible that frequent, small-scale ground fires persisted. Small, frequent fires that burn grassy and herbaceous vegetation do not produce as much charcoal as higher-intensity fires in more forested settings (Mustaphi and Pisaric, Reference Mustaphi and Pisaric2014). Patterson Lake, CA, Lily Lake, CA, and Dead Horse Lake, OR (Minckley et al., Reference Minckley, Whitlock and Bartlein2007), also document increases in severe fire events after 3500 cal yr BP. These sites also record a higher proportion of Artemisia pollen during the Early and Middle Holocene (Minckley et al., Reference Minckley, Whitlock and Bartlein2007). These findings are consistent with a more fuel-limited fire regime at Blue Lake, NV before the past 4000 years.
Much of the Great Basin experienced a shift toward cooler and wetter conditions after approximately 4000 cal yr BP (Thompson, Reference Thompson1992; Reinemann et al., Reference Reinemann, Porinchu, Bloom, Mark and Box2009; Fig. 5), coincident with a shift to millimeter-scale laminations and an increase in the frequency of fire episodes (charcoal peaks that stand significantly above background accumulation rates) at Blue Lake (Fig. 4). Moreover, a drastic increase in woody morphotypes (from approximately 5% to approximately 20%) occurs at the same time as these changes, indicating a change in fuel source from herbaceous to woody vegetation (Fig. 4). Grassland fires often burn at high frequency and low intensity, making the detection of individual fire events in charcoal records extremely difficult (Brown et al., Reference Brown, Clark, Grimm, Donovan, Mueller, Hansen and Stefanova2005; Leys et al., Reference Leys, Brewer, McConaghy, Mueller and McLauchlan2015). The transition in both the spectral characteristics (i.e., peaks identified as fire events above background) and the transition to woodier charcoal morphotypes may indicate the transition from a grassland pyrome to a lower-frequency higher-intensity fire regime facilitated by the encroachment of the modern forest ecosystem (Shriver and Minckley Reference Shriver and Minckley2012; Wahl et al., Reference Wahl, Starratt, Anderson, Kusler, Fuller, Addison and Wan2015). The existing pollen record from Blue Lake (Shriver and Minckley, Reference Shriver and Minckley2012) suggests that vegetative communities have remained generally consistent over the past 4000 years, consisting of primarily pine and sagebrush. Individual fire events facilitated immediate shifts toward greater sagebrush cover and reduced pine in the immediate (>30 year) aftermath of large fires, but pine recovery occurred within several decades after a fire (Shriver and Minckley, Reference Shriver and Minckley2012). This Late Holocene pattern indicates a significant degree of ecosystem resilience during periods of relatively moist hydroclimate. Prolonged drought analogous to Middle Holocene conditions (Todd et al., Reference Todd, Shanahan, DiNezio, Klavans, Fawcett, Anderson, Jiménez-Moreno, LeGrande, Pausata and Thompson2025), which is projected to occur over the coming centuries (McEvoy et al., Reference McEvoy, Pierce, Kalansky, Cayan and Abatzoglou2020), seemingly has the capacity to override this resilience and catalyze major top-down shifts in fire regime.
Increasing hydroclimate variability—that is, intense cyclic shifts between wet and dry cycles—may play an important role in fuel development, connectivity, and desiccation and fire regime in semiarid western ecosystems. Cooper et al. (Reference Cooper, Porinchu, Reinemann, Mark and DeGrand2021) note that although the MCA (1050–850 cal yr BP, 900–1100 CE) was marked by heightened temperatures and greater aridity, there is a conspicuous absence of high-intensity fire events recorded in Stella Lake, NV. Conversely, the subsequent Little Ice Age (LIA: 550–150 cal yr BP, 1400–1850 CE), during which the western United States experienced pronounced hydroclimatic variability (Benson et al., Reference Benson, Kashgarian, Rye, Lund, Paillet, Smoot, Kester, Mensing, Meko and Lindström2002; Loisel et al., Reference Loisel, MacDonald and Thomson2017; Mark et al., Reference Mark, Abbott, Steinman, Fernandez, Wise, Walsh and Whitlock2023) was marked by two catchment-scale fire events (Cooper et al., Reference Cooper, Porinchu, Reinemann, Mark and DeGrand2021). Anomalously high LIA fire activity is also seen at nearby Lily Lake, CA, and Dead Horse Lake, OR (Minckley et al., Reference Minckley, Whitlock and Bartlein2007). Prolonged increases in moisture facilitate the production of fine fuels, and subsequent drought periods create ideal climate conditions for large-scale fires (Mark et al., Reference Mark, Abbott, Steinman, Fernandez, Wise, Walsh and Whitlock2023). Pacific Ocean–atmosphere variability has previously been identified as a major driver modulating fire regime over the Holocene in semiarid western North America (Walsh et al., Reference Walsh, Marlon, Goring, Brown and Gavin2015; Brunelle, Reference Brunelle2022; Mark et al., Reference Mark, Abbott, Steinman, Fernandez, Wise, Walsh and Whitlock2023, Reference Mark, Whitlock, Abbott, Steinman, Fernandez and Steeple2024). XRF-PC1 documents significant periodicities within the ENSO band (2–8 years) as well as within those characteristics of the PDO after 4000 cal yr BP (Mantua and Hare, Reference Mantua and Hare2002; Fig. 7). Other work has documented increasingly variable conditions during the Late Holocene (Thompson, Reference Thompson1992; Wahl et al., Reference Wahl, Starratt, Anderson, Kusler, Fuller, Addison and Wan2015). This high-frequency variability, superimposed atop long-term transitions toward moister conditions, may have also been crucial in shaping fire ecology in the Great Basin. The transition to increased biomass burning at approximately 4000 cal yr BP, then, may reflect a combination of greater effective moisture overcoming fuel limitations, as well as the onset of increased cyclic moisture and temperature variability.
Humans have lived throughout the Great Basin for the entirety of the Holocene (Grayson, Reference Grayson2011), and Shoshone and Paiute people who inhabited the region used fire for a variety of purposes (Griffin, Reference Griffin and Vale2002). Previous work on fire-scarred trees from the eastern Great Basin suggests that humans were a major ignition source before Euro-American settlement, complicating a simple and straightforward attribution of fire regime to climate alone (Kitchen, Reference Kitchen2016). Archaeological evidence suggests populations moved upslope and altered food sources in response to the aridity of Late Holocene droughts (Thomas et al., Reference Thomas, Rhode, Millar, Kennett, Harper and Mensing2023). A period of increased Late Holocene fire activity between 2000 and 600 cal yr BP observed in the northwestern Great Basin (Minckley et al., Reference Minckley, Whitlock and Bartlein2007) may also relate to increased human habitation and resource use at high elevations (Jenkins et al., Reference Jenkins, Connolly and Aikens2004). Other studies have documented a decrease in fire activity occurring with Euro-American incursion on the landscape during the mid-nineteenth century. Mass mortality caused by the introduction of new diseases (Walsh et al., Reference Walsh, Duke and Haydon2018) and the introduction of Euro-American land-use practices (Hessburg et al., Reference Hessburg, Agee and Franklin2005) represented major disruptions to local fire ecology. Cattle grazing, common in the region today, represents a particularly notable shift, as livestock consume connective fuels on the landscape, preventing frequent, low-intensity ground fires (Covington and Moore, Reference Covington and Moore1994). While charcoal accumulation in Blue Lake is generally low after the beginning of the nineteenth century, possibly due to the depopulation of native groups and widespread grazing on the landscape, the relatively low frequency of fires in this high montane setting makes detecting an abrupt reduction in fire over the past 200 years impossible.
Summary
A 7000 year sediment record from Blue Lake, NV, reveals long-term changes in climatic and ecological conditions from a sensitive, high-elevation site located in the Great Basin. Mineral content and XRF-derived elemental composition document changes in lake level and P-E balance, as lower lake levels result in a greater amount of terrigenous mineral sediment being transported into the depocenter of the lake. Massive stratigraphy and thick, centimeter-scale clastic-rich bands during the Middle Holocene stand in contrast to the thinner millimeter-scale laminations of fine-grained organic matter–rich sediments formed during Late Holocene high stands. Consistent with most proxy records from the Great Basin, the Middle Holocene (until approximately 3800 cal yr BP) is marked by arid conditions. Two pronounced low-stand facies formed between 4200–3800 and 2600–2400 cal yr BP suggest major centennial-scale droughts, temporally consistent with other periods of widespread environmental change in western North America. Lake levels increase after this time, but cyclic water level changes become more prominent thereafter and occur on a semi-regular basis, possibly driven by ENSO and PDO variability.
Identifiable fire events in the Blue Lake sedimentary record increase with wetter conditions after 3800 cal yr BP, reflecting a fuel-limited fire regime. Herbaceous charcoal morphotypes represent ∼95% of all charcoal before 3800 cal yr BP, reflecting a fire regime in which grasses and herbs are the dominant fuel type, while afterward, woody morphotypes become more prominent. Enhanced hydroclimate variability, reflected by cyclic, but smaller-scale shifts in lake-level proxies, may also facilitate greater fire activity through periodic fuel production and desiccation events. The role of native groups using fire for a variety of purposes is difficult to disentangle in this dataset. Close correlations (r = 0.43, P < 0.01) between the lake-level history and nearby temperature-sensitive bristlecone pine chronologies suggest that future warming may decrease P-E balance as it did in the Middle Holocene, when two megadroughts produced low water stands lasting multiple decades to centuries, which are associated with the two highest levels of charcoal accumulation—possibly reflecting both extreme wildfires and high postfire erosion. While modern anthropogenic warming and associated aridity will increase the probability and severity of burns in the near-term future (McEvoy et al., Reference McEvoy, Pierce, Kalansky, Cayan and Abatzoglou2020) a return to Middle Holocene conditions would likely reduce vegetation cover and profoundly alter the fire regime. The Blue Lake paleo-record suggests that projected near- and medium-term warming could put unique biogeographic settings like the Pine Forest Range at major risk.
Supplementary material
The supplementary material for this article can be found at https://doi.org/10.1017/qua.2026.10114.
Acknowledgments
We thank Nick Wondoloski, Jamie Vornlocher, Hailey Sinon, Michelle Kim, and Joseph Stoner for assistance in the field.
Funding Statement
The authors thank support from National Science Foundation grants no. 2317931 and no. 1446283.
Competing Interests
The authors declare no competing interests.