
I. INTRODUCTION
Laser cladding, as a new surface strengthening and repairing technology, possesses excellent characteristics, such as fine microstructure, little stress deformation, small heat-affected zone, low dilution ratio, and better metallurgical bonding with the substrate. Reference Zhang, Zou, Zou and Shi1–Reference Lin, Lei, Fu and Lin4 It shows good application prospects in the aspect of improving the wear resistance and corrosion resistance of materials. Especially in recent years, many researchers at home and abroad combined metal matrix composites with laser cladding. The cladding coating was obtained with both the ductility and toughness of the metal, as well as the high strength and high modulus of the reinforcing phase by adding a high-performance second phase (usually ceramic phase) into the matrix. Reference Zhao, Huang, Liu, Zou, Zhu and Wang5–Reference Han, Li and Wang8 At present, there is more research on composite ceramic phases, such as (V, Cr)C, (Ti, V)C, (Ti, Zr)C, (Ti, W)C, (Ti, Nb)C, etc. Reference Wu, Li, Zhong, Gang and Wang9–Reference Li, Lei, Fu, Wu and Lin15 Researchers have done extensive experiments to study the mechanical properties of these composite carbides. However, the information obtained was very limited because of the limitation of experimental conditions and the complexity of the experimental methods.
In recent years, the investigation of transition metal composite properties with the method of a first-principles pseudopotential plane wave based on density functional theory (DFT) has attracted the interest of researchers. Some results have been reported. For example, Jang et al. Reference Jang, Lee, Heo and Suh16 investigated the lattice parameters, formation energy, and bulk moduli of (Ti, Nb)C, (Ti, V)C, (Ti, Mo)C, and (Ti, W)C with first-principles calculations. They showed that the replacement at zero Kelvin of Ti by Mo or W was larger than that of TiC, it was energetically unfavorable with respect to the formation energy whereas decreased the misfit strain between the carbide and ferrite matrix. Zaoui et al. Reference Zaou, Kacimi, Boukortt and Bouhafs17 studied the structural, elastic, and electronic properties of transition metal carbides (Zr, Nb)C and nitrides (Zr, Nb)N, and their ternary alloys Zr x Nb1−x C and Zr x Nb1−x N (0 ≤ x ≤ 1) by using the APW+lo method to solve Kohn–Sham equations. The ground state properties, equilibrium lattice constants, elastic constants, electron charge distribution, density of electron states and band structures were calculated and discussed for all the above compounds. Ramasubramanian et al. Reference Ramasubramanian, Rajagoplan, Thangavel and Kumar18 calculated the Ti1−x Zr x C compounds with a 2 × 2 × 2 supercell of 16 atoms (Ti8C8); the properties of Poisson ratio, Young’s moduli, bulk moduli, shear moduli, hardness, and Debye temperature were discussed with LAPW+lo based on the density functional theory with the generalized gradient approximation. Maouche et al. Reference Maouche, Louail, Ruterana and Maamache19 studied the formation energy and stability of transition metal carbides Ti x Zr1−x C, Ti x Hf1−x C, and Hf x Zr1−x C; the calculated bulk modulus, elastic stiffness coefficients, and equilibrium volume of the binary carbides TiC, ZrC, and HfC were in reasonable agreement with the reported measured values. Wang et al. Reference Wang, Zhang, Ruan and Zou20 found that the Ti x V1−x C compounds were stable characterized by elastic constants C ij and moduli (E, B, G); Ti0.5V0.5C was more stable and had higher hardness than others, but it presents brittleness based on the analysis of ductile/brittle behavior. Feng et al. Reference Elliott and Kempter21 investigated the structural, electronic, and elastic properties of Ti x N1−x , Zr x Nb1−x C, and HfC x N1−x alloys. The variations of the equilibrium lattice constants and bulk modulus with the composition were found to be linear, and the calculated elastic constants C 44 and shear constants as a function of alloy concentration reveal the anisotropic hardness of these compounds.
In our previous work, TiC and NbC were in situ synthesized from titanium powder, niobium powder, and graphite to fabricate the (Ti, Nb)C/Ni composite surface coating with an IPG 6000 fiber laser system. The stability, mechanical properties, and thermodynamic properties of materials have great significance for understanding the properties and further development of materials. However, the properties of Ti x Nb1−x C are seldom discussed systematically. To design (Ti, Nb)C with outstanding properties in the cladding layer, a more comprehensive understanding of (Ti, Nb)C is required. Therefore, the stability, mechanical properties, electronic structures, and thermodynamic properties of (Ti, Nb)C compounds using first-principles calculations have been investigated systematically in this study, which will provide guidance for developing a high-performance (Ti, Nb)C/Ni composite surface coating.
II. METHODS AND DETAILS
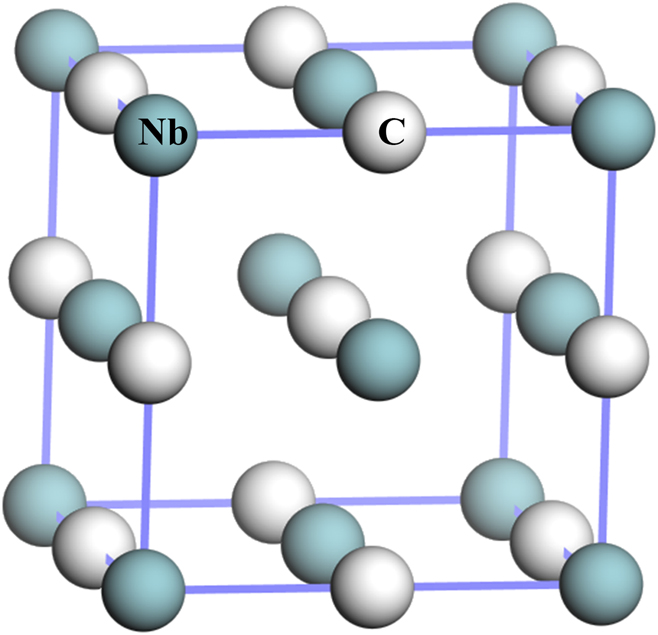
The stability, mechanical properties, electronic structures, and thermodynamic properties of (Ti, Nb)C compounds were investigated with the first-principles calculations based on DFT, as performed in the Cambridge Serial Total Energy Package code. In the elastic constants evaluations, the exchange-correlation energy was calculated with generalized gradient approximation (GGA) of the Perdew–Burke–Ernzerh (PBE) scheme. In the tensile simulations, uniaxial strain was introduced into the cubic crystal structure of the equilibrium configuration with the minimum energy. The tensile test was simulated with increasing the dimension along various directions at the tensile strain increment of 5% of the system gradually. The transition metal carbides TiC and NbC are similar to the crystal structure of NaCl (B1), which is described as cubic structure with a motif consisting of a metal atom (Nb or Ti) at (0, 0, 0) and a carbon atom at (0, 0, 0.5). The initial lattice parameters were based on the experimental lattice parameter a
NbC = 4.469 Å
Reference Elliott and Kempter21
at room temperature, and the internal atomic positions of Ti
x
Nb1−x
C were according to the crystal model of
 $Fm\bar{3}m$
NbC illustrated in Fig. 1; the unit cell of NbC contained four Nb atoms and four C atoms in the nonmagnetic state. The crystal structures were constructed by substituting the Nb atoms with Ti of 0, 25, 50, 75, 100%. The interactions between valence electrons and ionic cores were represented by ultrasoft pseudopotential. The valence electrons of C, Ti, and Nb were 2s
2 2p
2, 3s
2 3p
6 3d
2 4s
2, 4s
2 4p
6 4d
4 5s
1, respectively.
The crystal structure of NbC.

To achieve equilibrium crystal structures of these compounds, the BFGS (Broyden–Fletcher–Goldfarb–Shannon) algorithm was used for the crystal lattice parameter of the compounds. The minimum process of electron energy was calculated by the density mixing method. The cut-off energy of the plane-wave expansion was 500 eV; the Monkhorst–Pack scheme was applied to k-point sampling in the first irreducible Brillouin zone (BZ), as 16 × 16 × 16 for the calculation of structural stability, elastic constants, and stress–strain relation under various tensile and electronic properties for Ti x Nb1−x C compounds. The root-mean square stress was less than 0.1 GPa, the finite atomic displacement was less than 5 × 10⁻⁴ Å, the total energy was finally converged to 5 × 10⁻⁶ eV/atom during the optimization process, and the atomic force of every atom was less than 0.02 eV/Å. The minimum value was determined by a fourth order polynomial fitting. The total energy and force minimization scheme with the Broyden method were used to relax the internal atomic positions fully, and it can find the multidimensional zero. To investigate the relative stability of (Ti, Nb)C compounds, the formation energy was calculated as the differences between the total energy of each phase and the sum energy of pure elements in the stable states. The formation energy (ΔU) at zero Kelvin of each system is defined in the following equation Reference Yogeswari and Kalpana22 :
 $$\Delta U = {{E\left( {\left( {{\rm{T}}{{\rm{i}}_x},{\rm{N}}{{\rm{b}}_{1 - x}}} \right){\rm{C}}} \right) - x \cdot E\left( {{\rm{Ti}}} \right) - \left( {1 - x} \right) \cdot E\left( {{\rm{Nb}}} \right) - E\left( {\rm{C}} \right)} \over 2}\quad ,$$
where E((Ti x , Nb1−x )C) is the total energy, E(Ti), E(Nb), and E(C) are the total energies of the referenced state which are nonmagnetic HCP Ti, BCC Nb, and graphite carbon at corresponding equilibrium lattice constants; the abbreviations of HCP and BCC represent the hexagonal close-packed crystal structure and the body-centered cubic structure.
III. RESULTS AND DISCUSSION
A. The equilibrium lattice constants and stability
The equilibrium lattice constants and stability of transition metal carbides were mainly discussed in this section. To ensure that the parameters used in the calculation can be calculated accurately, the relaxation of the crystal structure was obtained firstly, and the equilibrium lattice constants in the ground state were calculated. The optimized equilibrium lattice constants of NbC, Nb0.75Ti0.25C, Nb0.5Ti0.5C, Nb0.25Ti0.75C, and TiC were 4.481 Å, 4.448 Å, 4.417 Å, 4.373 Å, and 4.331 Å, respectively. The equilibrium lattice constants reduced with increasing the Ti content, this was consistent with the 4.469 Å, Reference Elliott and Kempter21 4.471 Å, Reference Nartowski, Parkin, Mackenzie and Craven25 4.48 Å, Reference Liu, Jiang, Zhou and Feng26 4.4756 Å, Reference Isaev, Simak, Abrikosov and Ahuja27 4.47 Å Reference Häglund, Fernández, Grimvall and Körling28 of NbC and 4.323 Å, Reference Teresiak and Kubsch29 4.332 Å, Reference Nartowski, Parkin, Mackenzie and Craven25 4.27 Å, Reference Price, Cooper and Wills30 4.318 Å, Reference Raju, Mohandas, Terrance and Raghunathan31 4.336 Å Reference Isaev, Simak, Abrikosov and Ahuja27 of TiC from the experimental data and previous calculations in the literatures, it was found that the errors of lattice constants were less than 1.2%, and it was proved that the parameters adopted were reliable taking into account the differences between the experimental equipment and the calculation methods. However, we found that the calculated equilibrium lattice constants were about 0.8–1.2% larger than the experimental data Reference Elliott and Kempter21,Reference Isaev, Simak, Abrikosov and Ahuja27 because of typical GGA errors.
To understand whether transition metal carbides were easy to synthesize in the experiment, the relative stability of these compounds was described by the formation energy. Reference Jiang, Wang, Hu, We and Tong23 If the stability of a compound is better, the compound may be synthesized easily; if a compound is not stable, it may not be easy to synthesize in the experimental stage, or the compound may not exist under normal temperature and pressure. The calculated formation energy values of NbC, Nb0.75Ti0.25C, Nb0.5Ti0.5C, Nb0.25Ti0.75C, and TiC were −54.67 kJ/mole, −61.31 kJ/mole, −67.03 kJ/mole, −71.13 kJ/mole, and −72.71 kJ/mole, respectively, which were consistent with the −47.40 kJ/mole of NbC Reference Jang, Lee, Heo and Suh16 and −81.90 kJ/mole of TiC. Reference Jang, Lee, Heo and Suh16 The formation energy of the above compounds is a negative value, which indicated that they were stable crystal structures. The lower the formation energy is, the more stable the compound is. The Ti x Nb1−x C compound was more stable with increasing the Ti content. Thus, TiC was the most stable among them, and this was in good agreement with the literature. Reference Hua and Li24
B. Mechanical properties
1. Elastic constants and moduli
The elastic constants C ij depend mainly on the response of the crystal to external forces and it is a direct representation of the bond strength between the atoms. It can be used to calculate the bulk modulus B, shear modulus G, Young’s modulus E, and Poisson’s ratio σ. Therefore, the elastic constants C ij of (Ti, Nb)C compounds play an important role in the application of abrasive resistance phases. It is calculated with a stress–strain approach based on the generalized Hooke’s law, an appropriate number of strain patterns and amplitudes are applied in the cell, and then the total energy associated with each strain mode is optimized.
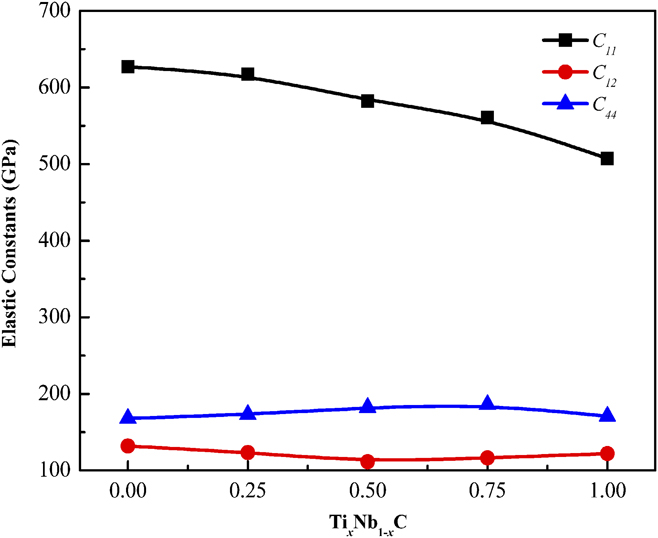
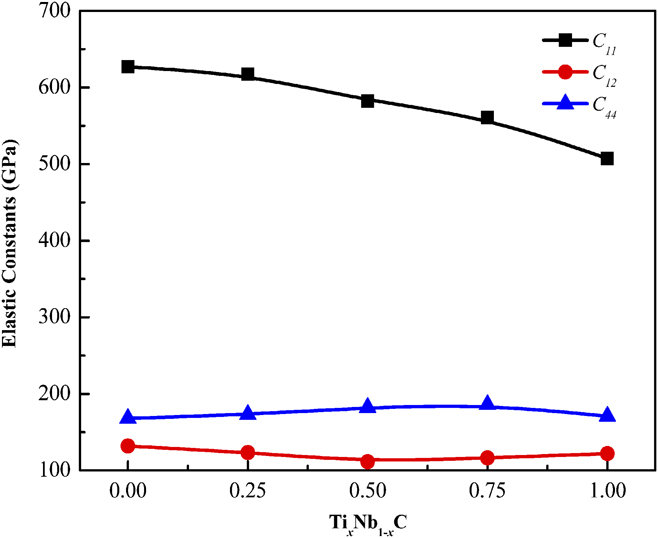
The crystal structures of NbC, Nb0.75Ti0.25C, Nb0.5Ti0.5C, Nb0.25Ti0.75C, and TiC are cubic; there are only three elastic constants (C 11, C 12, and C 44) illustrated in Fig. 2. The accuracy of the elastic constants is related to the reciprocal space grids of the BZ integral; there will be a slight difference from the others because of the different k mesh points. C 11 represents the linear compressive resistance along the x and z directions, the C 11 value of NbC was higher than that of other compounds, which means that the compressive resistance along the x and z axis was larger under uniaxial stress. C 12 is related to the Poisson effect in the cubic structure, and C 44 stands for shear resistance in the [001] direction of the (0 1 0) or (1 0 0) plane; the C 44 value of Nb0.25Ti0.75C was higher than that of others, which means shear resistance was larger.
The calculated elastic constants C ij of (Ti, Nb)C compounds.
For cubic crystal, the criterion of mechanical stability is Reference Chong, Jiang, Zhou and Feng32 :
 $${C_{11}} > 0,\quad {C_{44}} > 0,\quad {C_{11}} - {C_{12}} > 0,\quad {C_{11}} + 2{C_{12}} > 0\quad .$$
The calculated elastic constants of the studied (Ti, Nb)C compounds satisfied the above criterion, which illustrated that they were mechanically stable structures. The bulk modulus, shear modulus, and Young’s modulus can be estimated using Voigt–Reuss–Hill (VRH) approximation. The Voigt–Reuss–Hill approximation is an average of the lower bound of Voigt and upper bound of Reuss, which provides the best estimation for the mechanical properties of polycrystalline materials from the known elastic constants as the following equations Reference Luo, Wang, Li, Hu and Wang33 :
 $$B = {1 \over 2}\left( {{B_{\rm{V}}} + {B_{\rm{R}}}} \right)\quad ,$$
 $$G = {1 \over 2}\left( {{G_{\rm{V}}} + {G_{\rm{R}}}} \right)\quad ,$$
 $$E = {{9B \cdot G} \over {3B + G}}\quad ,$$
 $$\sigma = {{3B - 2G} \over {2\left( {3B + G} \right)}}\quad ,$$
where B V, B R, and B are the bulk moduli calculated by Voigt, Reuss, and Voigt–Reuss–Hill approximation, respectively. G V, G R, and G are the shear moduli calculated by Voigt, Reuss, and Voigt–Reuss–Hill approximation, respectively. E is the Young’s modulus and σ is the Poisson’s ratio, which are both calculated by Voigt–Reuss–Hill approximation.
The results of these moduli were presented in Table I, which were in good agreement with previous reports. Reference Chen, Xu, Wei and Lu34–Reference Gilman and Roberts39 In general, bulk modulus is related to valence electrons in the bonding state, which represents the solids compressibility under a hydrostatic pressure. The bulk modulus order of these transition metal compounds was NbC > Nb0.75Ti0.25C > Nb0.5Ti0.5C > Nb0.25Ti0.75C > TiC. The valence electron number of Nb is more than that of Ti, and the number of valence electrons decreased with increasing the Ti content. Then, the number of electrons in the bonding states decreased. According to the band filling theory, the electron filling with the nonbonding state or anti bonding state will reduce the stability of materials; otherwise, the electron is added to the bonding state, and the stability of the materials increases. The less the valence electron was, the more the electrons of the nonbonding state or antibonding state. The binding among atoms in the metal will become weaker, and the bulk modulus will became smaller. Therefore, these properties made NbC behave like a low-compressibility liquid, and it was difficult to compress when applying hydrostatic pressure specifically (as indicated by its high bulk modulus). In contrast, the compressibility of TiC was better than that of others. The shear modulus (G) and Young’s modulus (E) refer to the stiffness and the resistance transverse deformation, respectively. Nb0.5Ti0.5C was a stiffer and more resistant transverse deformation material because G and E were the largest among the compounds from Table I. The ratio of bulk modulus to shear modulus (B/G) is used to predict the brittleness/ductility of the materials with a critical value of 1.75. If the value is greater than 1.75, it is ductile; otherwise, it is brittle. In this study, the values of the studied transition metal compounds were less than 1.75, and they were brittle. In addition, the elastic modulus, especially shear modulus, is concerned with the melting temperature, which a higher melting temperature is corresponding to a larger shear modulus. Reference Duan, Huang, Sun, Peng and Zhou40 Therefore, Nb0.5Ti0.5C may have the highest melting temperature than other compounds. The Poisson’s ratio σ is the ratio of the transverse strain to the axial strain, and it can also be used to represent the ductility and brittleness of compounds. If the value is larger than 0.26, it is ductile; otherwise, it is brittle. The calculated Poisson’s ratios of these carbides varied from 0.20 (Nb0.5Ti0.5C and Nb0.25Ti0.75C) to 0.23 (NbC), which clearly illustrated the brittle character of the transition metal compounds, and this was consistent with the above analysis. In general, high hardness materials have larger bulk modulus, shear modulus, and smaller Poisson’s ratio; thus, Nb0.5Ti0.5C and Nb0.25Ti0.75C were predicted to have greater hardness.
The calculated mechanical moduli of (Ti, Nb)C compounds, including bulk moduli (B V, B R, and B), shear moduli (G V, G R, and G), Young’s modulus (E) (in GPa), and Poisson’s ratio (σ).

2. Anisotropy
Anisotropy exists in all materials, and it is closely related to the hardness and microcrack of the materials. Therefore, the analysis of anisotropy is important for understanding the mechanical properties of crystals. According to the present research, there exist several methods to evaluate the elastic anisotropy. In this study, a universal anisotropic index (A U) and a percent anisotropy (A B and A G ) were proposed to explain the elastic anisotropy. Reference Chong, Jiang, Zhou and Feng41 The equations can be expressed as:
 $${A^U} = 5{{{G_{\rm{V}}}} \over {{G_{\rm{R}}}}} + {{{B_{\rm{V}}}} \over {{B_{\rm{R}}}}} - 6 \ge 0\quad ,$$
 $${A_B} = {{{B_{\rm{V}}} - {B_{\rm{R}}}} \over {{B_{\rm{V}}} + {B_{\rm{R}}}}}\quad ,$$
 $${A_G} = {{{G_{\rm{V}}} - {G_{\rm{R}}}} \over {{G_{\rm{V}}} + {G_{\rm{R}}}}}\quad .$$
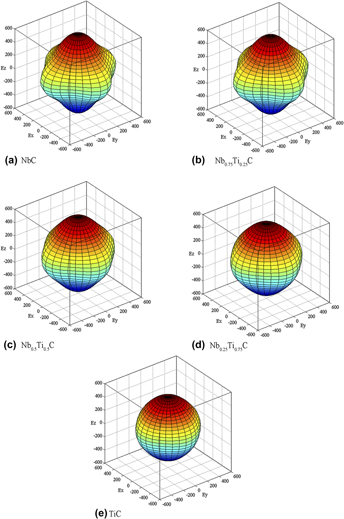
If all of the indexes in the above equations are zero, it may be an isotropic structure. The large discrepancies between zero reveal highly mechanical anisotropic properties. A B and A G represent the elastic anisotropy of compressibility and shear in the materials, respectively. The values of A B and A G were calculated by Eqs. (8) and (9). They were 0.0000, 0.0001, 0.0010, 0.0003, 0.0001 and 0.0179, 0.0152, 0.0093, 0.0063, and 0.0019, respectively. We found that the calculated values of A B for these compounds were almost zero, and A B was less than A G , which indicated that elastic anisotropy of compressibility was less. Voigt and Reuss approximations give a more close value for the bulk modulus than that for the shear modulus. The difference between Voigt and Reuss approximations for shear modulus affects the A U significantly. The universal anisotropic index (A U) is a better indicator than other indices, which provides unique and consistent results for the mechanical anisotropic properties of these compounds. The larger the value of A U is, the stronger the anisotropy of the compounds is. Therefore, the anisotropy of NbC may be stronger than that of others because the value of A U was the largest. The anisotropy order of these transition metal compounds was NbC > Nb0.75Ti0.25C > Nb0.5Ti0.5C > Nb0.25Ti0.75C > TiC. To analyze and characterize the results more intuitively, the compound’s anisotropy was confirmed by mechanical moduli which were plotted as a function of crystallographic orientation. Reference Xiao, Feng, Zhou, Jiang and Zhou42 Spherical coordinates were used to describe the Young’s modulus in different directions. For a cubic crystal, the directional dependence of Young’s modulus is defined in the following equation Reference Liu, Jiang, Feng and Zhou43 :
 $$E = {1 \over {{S_{11}} - \left( {2{S_{11}} - 2{S_{12}} - {S_{44}}} \right) \cdot \left( {n_1^2n_2^2 + n_1^2n_3^2 + n{}_2^2n_3^2} \right)}}\quad ,$$
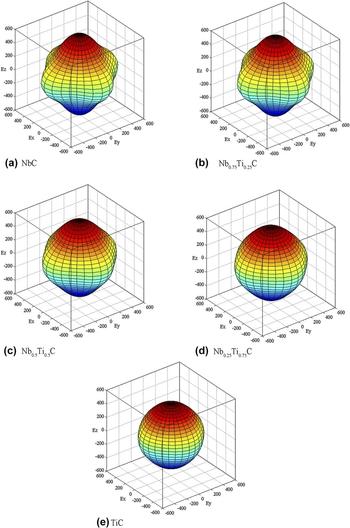
where S 11, S 12, and S 44 are the elastic compliance constants and n 1, n 2, and n 3 are the direction cosines. The surface anisotropy contours were shown in Figs. 3(a)–3(e). The more irregular the sphere, the stronger the anisotropy, and on the contrary, the stronger the isotropy is. From the graphs, we can clearly find that the Young’s modulus of NbC showed strong anisotropic effects for different orientations. Thus the Young’s modulus anisotropy of NbC was stronger than that of the others, this was consistent with the calculated anisotropy index basically.
The surface construction of the Young’s modulus of (Ti, Nb)C compounds (a) NbC; (b) Nb0.75Ti0.25C; (c) Nb0.5Ti0.5C; (d) Nb0.25Ti0.75C; and (e) TiC.

3. Hardness
The hardness of materials plays an important role in its applications, especially when used as an abrasive resistant phase. Generally, the higher the hardness of the materials is, the better is the wear resistance. Thus, hardness is one of the important scales to measure the wear resistance of the materials. The bulk modulus or shear modulus of crystals obtained by experiment or theory was used to predict the magnitude of hardness indirectly for a long time. Although bulk modulus is inversely proportional to the bond length which in turn was related to hardness, it has little direct correlation with hardness from the dislocation theory; the study of the bulk modulus is insufficient for determination of the hardness, Reference Gilman44–Reference Liu and Cohen46 and the shear modulus proposed by Teter Reference Butler and Windischmann47 was introduced to express hardness. Hardness can be calculated as follows Reference Chen, Niu, Li and Li48 :
 $${H_{\rm{V}}} = C{\left( {{k^2}G} \right)^{0.585}} - 3\quad ,$$
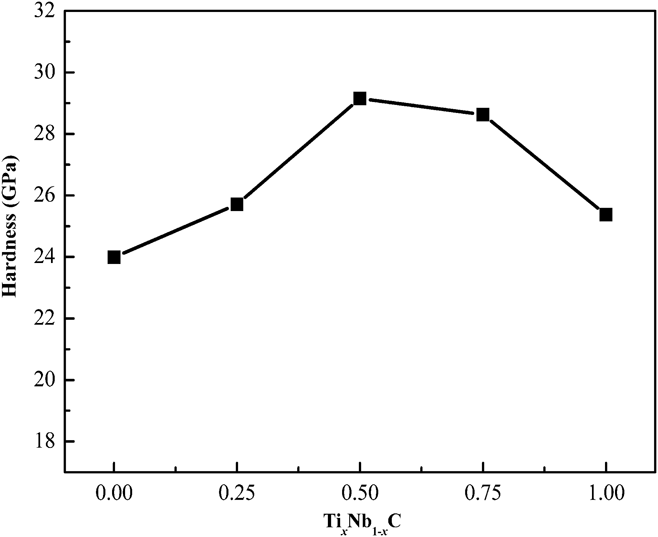
where H V, G, and B are hardness, shear modulus, and bulk modulus, respectively. C is the coefficient of proportionality, and the value is 2. The ratio k of the shear modulus to bulk modulus (G/B) was introduced by Pugh. Reference Pugh49 Figure 4 showed the results of hardness. From Fig. 4, the hardness of NbC, Nb0.75Ti0.25C, Nb0.5Ti0.5C, Nb0.25Ti0.75C, and TiC increased firstly and then decreased because the number of free electrons around the stable shell configuration in the transition metal compound was less with increasing the Ti content; thus, the metallicity of the compound was reduced, and the hardness was increased. The number of free electrons in the Nb0.5Ti0.5C compounds was close to zero, the hardness of Nb0.5Ti0.5C was the largest, and the value was 29.15 GPa. Then the stable shell configuration decreased with the electrons decreasing gradually, and the hardness decreased. Pierson Reference Pierson50 reported that the hardness of TiC is higher than that of NbC which was similar to the results of our calculation. The difference of hardness may be attributed to different slip systems activated in Ti x Nb1−x C compounds. When the slip system with the higher shear strength is activated in Ti x Nb1−x C, it will lead to a higher value of hardness; thus, Nb0.5Ti0.5C may have the highest shear strength. Besides, the hardness order of compounds was Nb0.5Ti0.5C > Nb0.25Ti0.75C > Nb0.75Ti0.25C > NbC > TiC, which was in accordance with the order of shear modulus (G) and Young’s modulus (E); it indicated that the resistance to shear deformation force and the normal stress of Nb0.5Ti0.5C were obviously higher than those of other compounds.
The hardness of (Ti, Nb)C compounds.

4. Tensile deformation
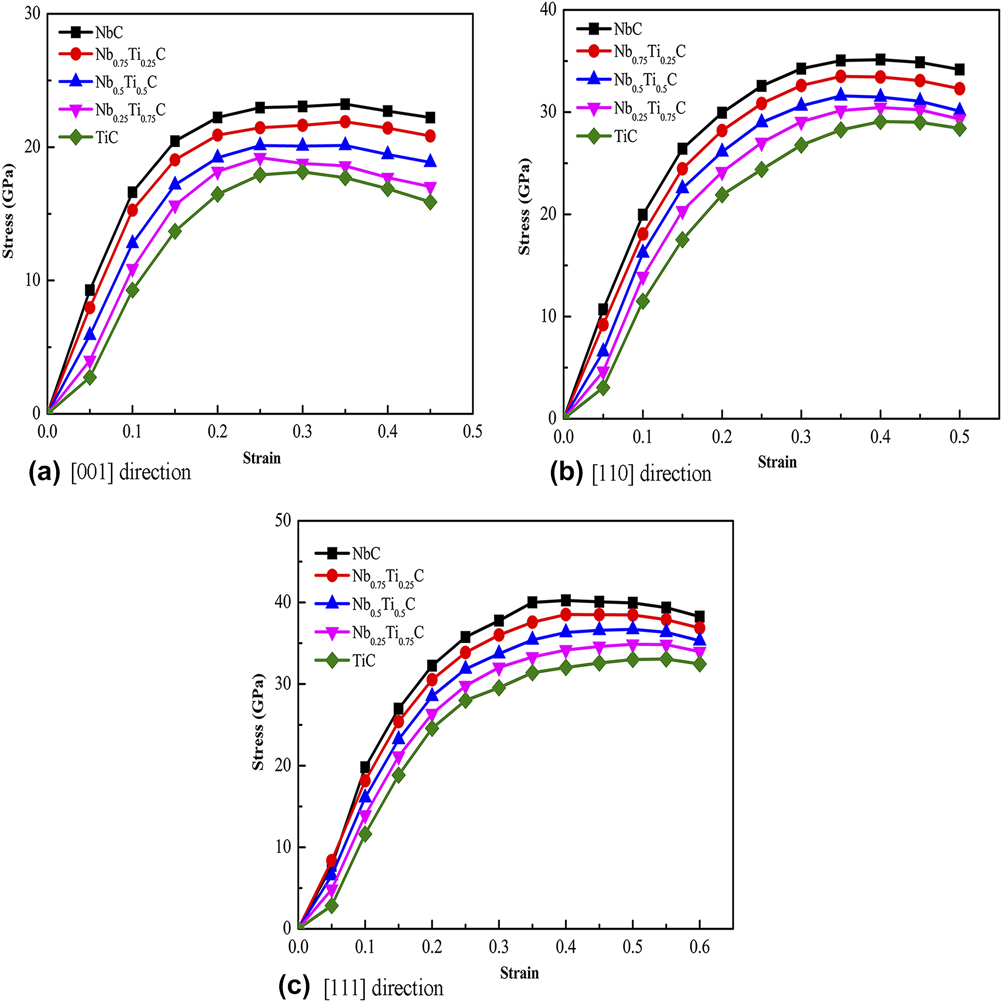
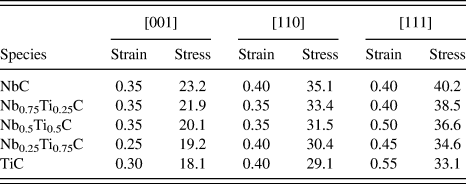
To study the influence of the Ti content in Ti x Nb1−x C compounds, which affects the application of materials. In this section, the strengthening law of Ti x Nb1−x C compounds was evaluated by tensile simulations. The stress–strain relation was obtained with a quasi-static relaxation method which simulated various tensile deformation directions and determined the corresponding ideal strength. Reference Wang, Huang, Wang, Xue and Jiang51 [001], [110], and [111] are special directions for face-centered cubic structures; uniaxial strain was introduced into the three directions at the tensile strain increment of 5%. The stress–strain curves were illustrated in Figs. 5(a)–5(c). In addition, as the tensile simulation was done, the strain increased gradually. After each strain was applied, the atomic positions of the new configuration were fully relaxed at each strain stage. The next initial strain configuration would start from the former relaxed configuration. The cycle continued until the stress reached its highest point and fell. It should be stressed that the theoretical simulations imply a tensile process without any defect in the material at zero Kelvin and the plastic deformation is not considered. Reference Zhou, Su, Wang, Zeng and Li52 These results in a much higher (at least over an order) stress or strength compared with the experimental detections naturally since the experiments apply the tensile force within a limited time, and the defects are unavoidable. The ideal tensile strength was the maximum tensile stress of the stress–strain curve, and the results were shown in Table II.
The calculated stress–strain relations of (Ti, Nb)C compounds in various tension deformation directions (a) [001] direction; (b) [110] direction; and (c) [111] direction.

The calculated results of ideal tensile strength (GPa) and the corresponding strain.

From Figs. 5(a)–5(c), when the strain was less than 0.10, the stress–strain curve changed linearly with the elastic deformation stage. When the strain of these carbides varied from 0.10 to 0.20, the stress–strain curves were no longer in linear relationship with the yield stage, and the point corresponded to the value of the yield strength. The stress values continued to increase until it reached the maximum and it was the ideal tensile strength. From Table II, Ti x Nb1−x C compounds displayed relatively strong stress responses along the [001], [110], and [111] directions with the peak tensile stresses ranging from 18.1–23.2 GPa, 29.1–35.1 GPa, and 33.1–40.2 GPa, respectively. The weakest tensile direction was found to be along the [001] direction, which was the ideal tensile strength direction. The ideal tensile strength decreased with increasing the Ti content, and NbC was the largest. This is because C was clearly indicated to carry the negative charges in the Ti x Nb1−x C compounds, with positive charges shared by the surrounding Ti and Nb atoms. A high density of valence electrons of Ti and Nb atoms was introduced into the compounds to resist compression, while the C atom was to help form a strong covalent bonding network to enhance structural integrity and to function as barriers to dislocations during deformation. The valence electrons of Nb were more than those of Ti which enhanced the p–d bonding; the valence electrons reduced, and the interatomic bonding force decreased gradually with increasing the Ti content. Besides, the electrons in Ti x Nb1−x C compounds, which were not localized between particular atoms, directly contribute to other physical properties of NbC over others. Therefore, the ideal tensile strength gradually diminished with increasing the Ti content, and NbC was the strongest.
C. Electronic structures
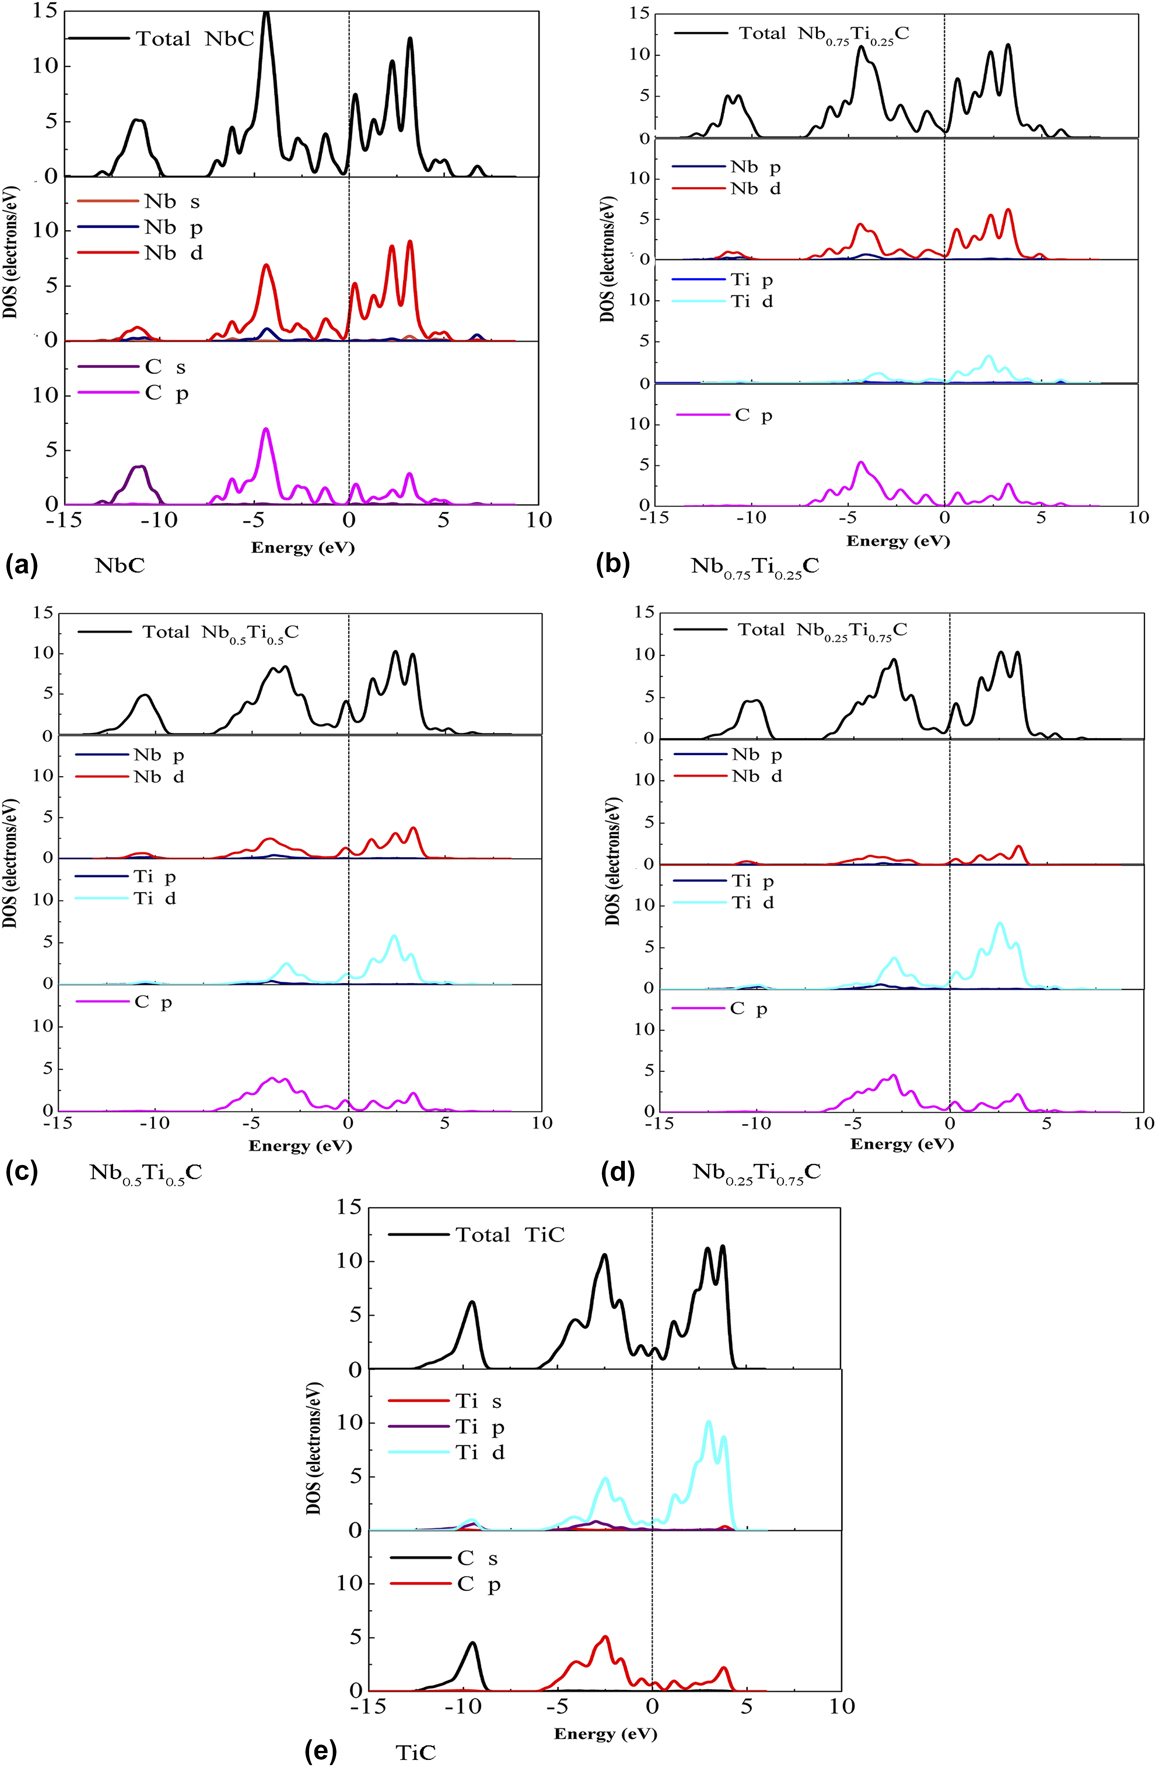
It is well known that the properties of materials are associated with electronic states which represent the distribution of the electron states in the energy space. Reference Hirayama, Iida, Morioka, Sakamoto, Nishio, Kogo, Takanashi and Hamada53 Our results were not surprised that all the calculated properties were relevant to strong chemical bonding characteristics of carbon, titanium, and nitrogen in this case. The total density of states (TDOS) is the sum of all allowed electron wave vectors of all bands, and the electrons were integrated from the band minimum to the Fermi level. The partial density of states (PDOS) is an effective semiempirical method for analyzing the electronic band structures of individual elements; it can analyze and understand the electronic hybridization states quantitatively, chemical bonding, crystal binding characteristics and so on. The TDOS and the PDOS of NbC, Nb0.75Ti0.25C, Nb0.5Ti0.5C, Nb0.25Ti0.75C, and TiC at their equilibrium geometries were calculated at the GGA level with the PBE functional, and the results were illustrated in Figs. 6(a)–6(e). The total DOS of Ti x Nb1−x C compounds exhibit non-zero at the Fermi level, which indicated the metallic feature in these carbides. Bonding and antibonding state density of overlapping peaks group were formed with the Fermi level boundary.
Density of states of Ti x Nb1−x C compounds (a) NbC; (b) Nb0.75Ti0.25C; (c) Nb0.5Ti0.5C; (d) Nb0.25Ti0.75C; and (e) TiC.

From Fig. 6, with increasing the Ti content, the density of states on both sides of the Fermi level were determined mainly by the Nb-4d and C-2p firstly, then by the contribution of the Nb-4d, Ti-3d, and C-2p, and were determined by Ti-3d and C-2p finally. The d orbit of the transition metal (Nb and Ti) and the 2p orbit of carbon have a strong hybridization, which suggested a strong covalent bond between the transition metal and carbon atom. The exhibited p–d hybridization in Ti x Nb1−x C compounds determined the lattice constants and lead to good elastic properties of transition metal carbides. In the bonding states below the Fermi level, the electron density peak of C was higher than that of Nb and Ti; this showed that low-energy electrons were affected by the potential field of the C atomic nucleus greatly in the valence band, their electronic localization was stronger, and they exhibited nonmetallic properties. In the antibonding states, the electron density peak of Nb and Ti was higher than that of C, which showed that high-energy electrons were affected by potential field of Nb and Ti atomic nucleus greatly in the conduction band. Their electronic delocalization was stronger, and they exhibited metallic of d electrons.
D. Thermodynamic properties
The Debye temperature (ΘD) is an important fundamental parameter which is closely bound up with many physical properties of solids, such as specific heat, elastic stiffness constants, and melting temperature. Reference Tian and Wu54 The vibration excitations are caused merely by acoustic vibrations at low temperatures. Therefore, the calculated Debye temperature from elastic constants is consistent with the measurements of specific heat. From the above section, we have known the values of Young’s modulus, bulk modulus, and shear modulus, so we can get the Debye temperature at low temperature by using the following relations Reference Xiang, Feng and Zhou55 :
 $${\Theta _{\rm{D}}} = {h \over {{k_{\rm{B}}}}}{\left[ {{{3n} \over {4\pi }}\left( {{{{N_{\rm{A}}}\rho } \over M}} \right)} \right]^{1{\rm{/}}3}}{v_{\rm{m}}}\quad ,$$
where h is Planck’s constant, k B is Boltzmann’s constant, N A is Avogadro’s number, ρ is the density, M is the molecular weight, and n is the number of atoms in the unit cell. The average sound velocity v m can be calculated as follows Reference Xiang, Feng and Zhou55 :
 $${v_{\rm{m}}} = {\left[ {{1 \over 3}\left( {{2 \over {v_{\rm{s}}^3}} + {1 \over {v_1^3}}} \right)} \right]^{ - 1/3}}\quad ,$$
where:
 $${v_1} = {\left[ {\left( {B + {4 \over 3}G} \right){1 \over \rho }} \right]^{1/2}}\quad ,$$
 $${v_{\rm{s}}} = {\left( {{G / \rho }} \right)^{1/2}}\quad ,$$
Where v l and v s are, respectively, the longitudinal sound velocity and transverse sound velocity.
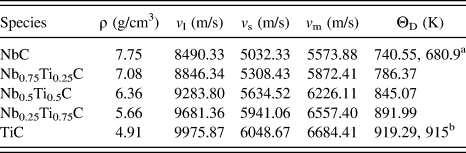
The results were listed in Table III. Both v l and v s are correlated to shear modulus and density, the compound with low density and high shear modulus will have large sound velocities. From Table III, the average values of sound velocities were relatively high, and they were more than 5000 m/s. As we know, the strength of chemical bonding can be characterized by Debye temperature which is inversely proportional to the molecular weight. Stronger chemical bonding favors a higher Debye temperature. As shown in Table III, the Debye temperature increased with increasing the Ti content. NbC and TiC showed a minimum and maximum Debye temperature of 740.55 K and 919.29 K, respectively, which was in accordance with the previous calculations in the literature. Reference Liu, Jiang, Zhou and Feng26,Reference Wang, Liu and Ye56 Therefore, we can conclude that the covalent bonds in TiC were stronger than other carbides. As a matter of experience, a greater Debye temperature means a larger associated thermal conductivity. Reference Liu, Xing, Fu, Li, Sun and Zheng57,Reference Chong, Jiang, Zhou and Feng58 Therefore, TiC should possess the best thermal conductivity relative to the other compounds. On the other hand, NbC had the lowest Debye temperature, which indicated that the metallic bonds of NbC were stronger than those of others.
Theoretically calculated thermal properties of Ti x Nb1−x C compounds, including v l, v s, v m, and ΘD.

IV. CONCLUSIONS
In this study, the stability, mechanical properties, electronic structures, and thermodynamic properties of (Ti, Nb)C compounds were estimated using first-principles calculations. The formation energy showed that NbC, Nb0.75Ti0.25C, Nb0.5Ti0.5C, Nb0.25Ti0.75C, and TiC were stable from the formation energy and the criterion of mechanical stability. The main conclusions were as follows:
-
(1) It was observed that the mechanical behavior can be optimized by mediating the component fractions in the complex carbide. The mechanical parameters, such as bulk modulus B, shear modulus G, Young’s modulus E, Poisson’s ratio σ, anisotropy value, and hardness showed that Ti x Nb1−x C possessed good mechanical stability, and the hardness of Nb0.5Ti0.5C was the largest. The anisotropic index and three-dimensional surface contours of (Ti, Nb)C compounds were discussed; NbC was stronger than others.
-
(2) The stress–strain relation was obtained by calculating the stress response to structural deformation using a quasi-static relaxation method that simulated various-direction tensile deformation and determined the corresponding ideal strength. Ti x Nb1−x C compounds displayed relatively strong stress responses along the [001], [110], and [111] directions; the weakest tensile direction was found to be along the [001] direction, which was the ideal tensile strength direction. The ideal tensile strength gradually diminished with increasing the Ti content, and NbC was the strongest.
-
(3) The electronic structures showed that the bonding characteristic of (Ti, Nb)C compounds was a mixture of metallic and covalent bonds. The Debye temperature of these compounds was estimated, and it was increased with the increase of Ti content. NbC and TiC showed a minimum and maximum Debye temperature of 740.55 K and 919.29 K, respectively, which indicated that the metallic bonds of NbC were stronger than those of others.
-
(4) Combining with the algorithm of quantum mechanics, the calculated results of (Ti, Nb)C compounds will be helpful for future experimental research and the design of materials.
ACKNOWLEDGMENTS
The authors would like to thank the financial support for this work from National Natural Science Foundation of China under grant (51475005, 51775006).