1. Introduction
The deficit in the pension system of North Macedonia – the difference between the original revenues and total expenditure of the pension and disability insurance fund (PDIF) – has been growing over time. In 2017, it reached 44% of the Fund's total expenditure, being 4.6% of GDP, while central budget transfers have nearly doubled over a decade. This trend has been caused by several factors. On the revenue side, a structural transition from a mono-pillar to a three-pillar system took place in 2006, while the contribution rate was reduced from 21.2% in 2008 to 18% in 2010, both reducing Fund's original revenues. On the expenditure side, pensions increased several times between 2006 and 2016, in amounts that usually exceeded the statutory adjustment provisions. Moreover, conditions for early retirement in arduous or hazardous occupations have relaxed. Other pro-populist moves, like subsidised employment, caused or will cause pressure onto pension sustainability. Such structural and policy shifts created strong pressure onto the pension budget and amplified its dependence on the central budget, jeopardizing its sustainability over the medium- to long run. The pension system arrived at a point of a critical need for reform.
The objective of this paper is to simulate and examine the fiscal effects of potential pension reform in North Macedonia and its effects on key development indicators, most notably, are unemployment and poverty. The paper develops MK-PENS Dynamic Microsimulation Pension Model, being a part of a larger corpus of models to examine a variety of ongoing and proposed tax, benefits and pension reforms in the country. Based on MK-PENS, the paper simulates several scenarios of potential pension reform.
The pension literature identifies several key factors affecting the sustainability of the pension system. Population ageing, the decrease in fertility rate, and the increase in life expectancy are some of the factors putting pressure on the pension systems to be sustainable, fair and efficient (Verbič, Reference Verbič2007). Blake and Mayhew (Reference Blake and Mayhew2006) suggest that each subsequent generation will shrink because of lower fertility rates and population ageing. According to the United Nations, the number of persons aged over 60 will double by 2050 globally compared to 2017; in Europe, 25% of the population is already over 60 years of age (World Population Prospects: The 2017 Revision). Such trends place a more significant and heavier burden on the pension system, which then imposes an even higher burden on future generations in employment. However, Blake and Mayhew (Reference Blake and Mayhew2006) argue that the combination of population ageing and declining fertility creates benefits through the so-called ‘demographic dividend,’ where there is a lower number of young dependants and, at the same time, a higher number of persons in the mature stage of productivity. However, these benefits are enjoyed by approximately one generation, and specifically at the beginning of the trend. Labour market trends are the second group of factors affecting the sustainability of the pension system. One dimension is sectoral shifts related to changes in labour demand, mainly an increase in the size of the service sector and a shrinking in the traditional industries. These shifts could impact sectoral wages and prices (Kakes and Broeders, Reference Kakes and Broeders2007), as well as the supply-demand disequilibrium in the labour market (Bonin, Reference Bonin2009). Another dimension is the decrease in labour supply, principally driven by demographic changes. However, labour force figures do not only depend on population structure, but also on the activity rate (in particular, that of women), the average retirement age, and the average age of labour force entrance (an increasing number because of spending more time in education). Reduction of the working-age population increases the dependency ratio, leaving each worker with a higher number of retirees he/she supports. The imbalance in the number of pensions and the potential of the economy to finance them is the third sustainability factor. The pressure for higher pensions is mainly driven by the power of retirees to impact policies, due to their increasing numbers and their electoral importance (Kruse, Reference Kruse and Bengtsson2010). Higher pensions increase the replacement rate (the share an average pension has in an average wage) and the need to make larger contributions in order to ensure the pension pay-out.
Models assessing the sustainability of the pension systems and making projections for their fiscal implications are mainly developed by the key national pension institutions and by the international organisations. The common component in these models is the possibility to make microsimulations, as they simulate changes in a representative sample of individuals, usually collected through surveys or obtained from administrative data (Gál et al., Reference Gál, Horváth, Orbán and Dekkers2009). These models are divided into static and dynamic categories, whereby the latter has the possibility of modelling changes over time (Dekkers, Reference Dekkers2007), thus creating a theoretical life path for each person in the sample, including their probability of death, change in their economic status, their year of retirement, earnings, etc. (Emmerson et al., Reference Emmerson, Reed and Shephard2004).
The empirical literature has been quite abundant in utilizing a variety of such microsimulation models to investigate – ex-ante or ex-post – effects of pension reforms. Atkinson et al. (Reference Atkinson, Bourguignon, O'Donoghue, Sutherland and Utili2002) examined the implications of a European minimum pension (EMP) using a Europe-wide tax-benefit microsimulation model (EUROMOD) to determine the distributional impact of such a reform in five Member States and find the EMP to be an anti-poverty policy, despite ‘a highly uneven effect across countries’. Likewise, the usage of dynamic microsimulation models underscored the work of Harding (Reference Harding2006) for Australia, Dekkers et al. (Reference Dekkers, Buslei, Cozzolino, Desmet, Geyer, Hofmann, Raitano, Steiner, Tanda, Tedeschi and Verschueren2009) for Belgium, Germany and Italy, Fehr et al. (Reference Fehr, Kallweit and Kindermann2012) for Germany, Fredriksen et al. (Reference Fredriksen, Holmøy, Strøm and Stølen2019) for Norway, Blau (Reference Blau2016) for the USA, Goodman et al. (Reference Goodman, Brewer, Emmerson, Muriel, Browne and Tetlow2007) for the UK, Fonseca and Sopraseuth (Reference Fonseca and Sopraseuth2007) for France and Italy, Buyse et al. (Reference Buyse, Heylen and Van de Kerckhove2017) for a set of OECD countries. Soede et al. (Reference Soede, Vrooman, Ferraresi and Segre2004) and Ferraresi and Monticone (Reference Ferraresi and Monticone2009) simulated – in a static framework – how ageing would affect the levels of poverty, income inequality, and government spending between 2000 and 2025 across the European continent and concluded that the cost of pension provision would significantly increase while poverty and income inequalities would also increase though slightly. A strand of papers focusses on the replacement rates before versus after effective or proposed reforms: Bottazzi et al. (Reference Bottazzi, Jappelli and Padula2006), Indicators Sub-Group (2009), OECD (2007), Martin and Whitehouse (Reference Martin and Whitehouse2008), Hering (Reference Hering2006), Orban and Palotai (Reference Orban and Palotai2005) and many others.
The paper is organised as follows. Section 2 presents stylised facts about demographic developments and the design and financing of the pension system. Section 3 explains the simulations for potential pension reform, including a description and methodology, inputs and reform scenarios. Section 4 presents the results, including fiscal implications and effects of the simulated reform scenarios on the poverty and unemployment rates. Section 6 concludes, as well includes an update on the policy discussions.
2. Stylised facts
The Macedonian pension system is based on the principle of inter-generational solidarity, i.e. pay-as-you-go (PAYG), where the current contribution payments are used to finance the current pensions. Until 2006, it had only one pillar. In 2006, the system was redesigned to introduce the principle of fully funded pension insurance, whereby two pillars were added, a mandatory and voluntary private pension funds. The first pillar provides a portion of the old-age pension, disability and survivor pensions, and the minimum pension (PDIF, Actuarial Report for 2014, 2015). The second pillar provides an additional portion of the old-age pension for the pensioners who have been contributing in this pillar. The third pillar provides additional material security. The pension system is financed through contributions of the wages of insured persons. The pension contribution rate for the first pillar is currently 18% of the gross wage (for contributors insured in the first pillar only), of which 6 percentage points of those (6% of gross wage) are transferred to the second pillar (for contributors insured in both pillars).
The rights from pension and disability insurance depend on the funds invested (determined by a person's average wage during their working life) and length of service. Rights from pension include old-age pension, survivor pension, and disability pension, and cover 99.4% of the beneficiaries. Of these, about two-thirds are old-age pensioners, constituting the key pension group. North Macedonia has a statutory retirement age of 64 for men and 62 for women, despite the effective ages are lower, 62 and 61, respectively, mainly due to early retirement of specific groups of contributors (survivors and disabled persons), and due to reduced years of service in certain occupations.
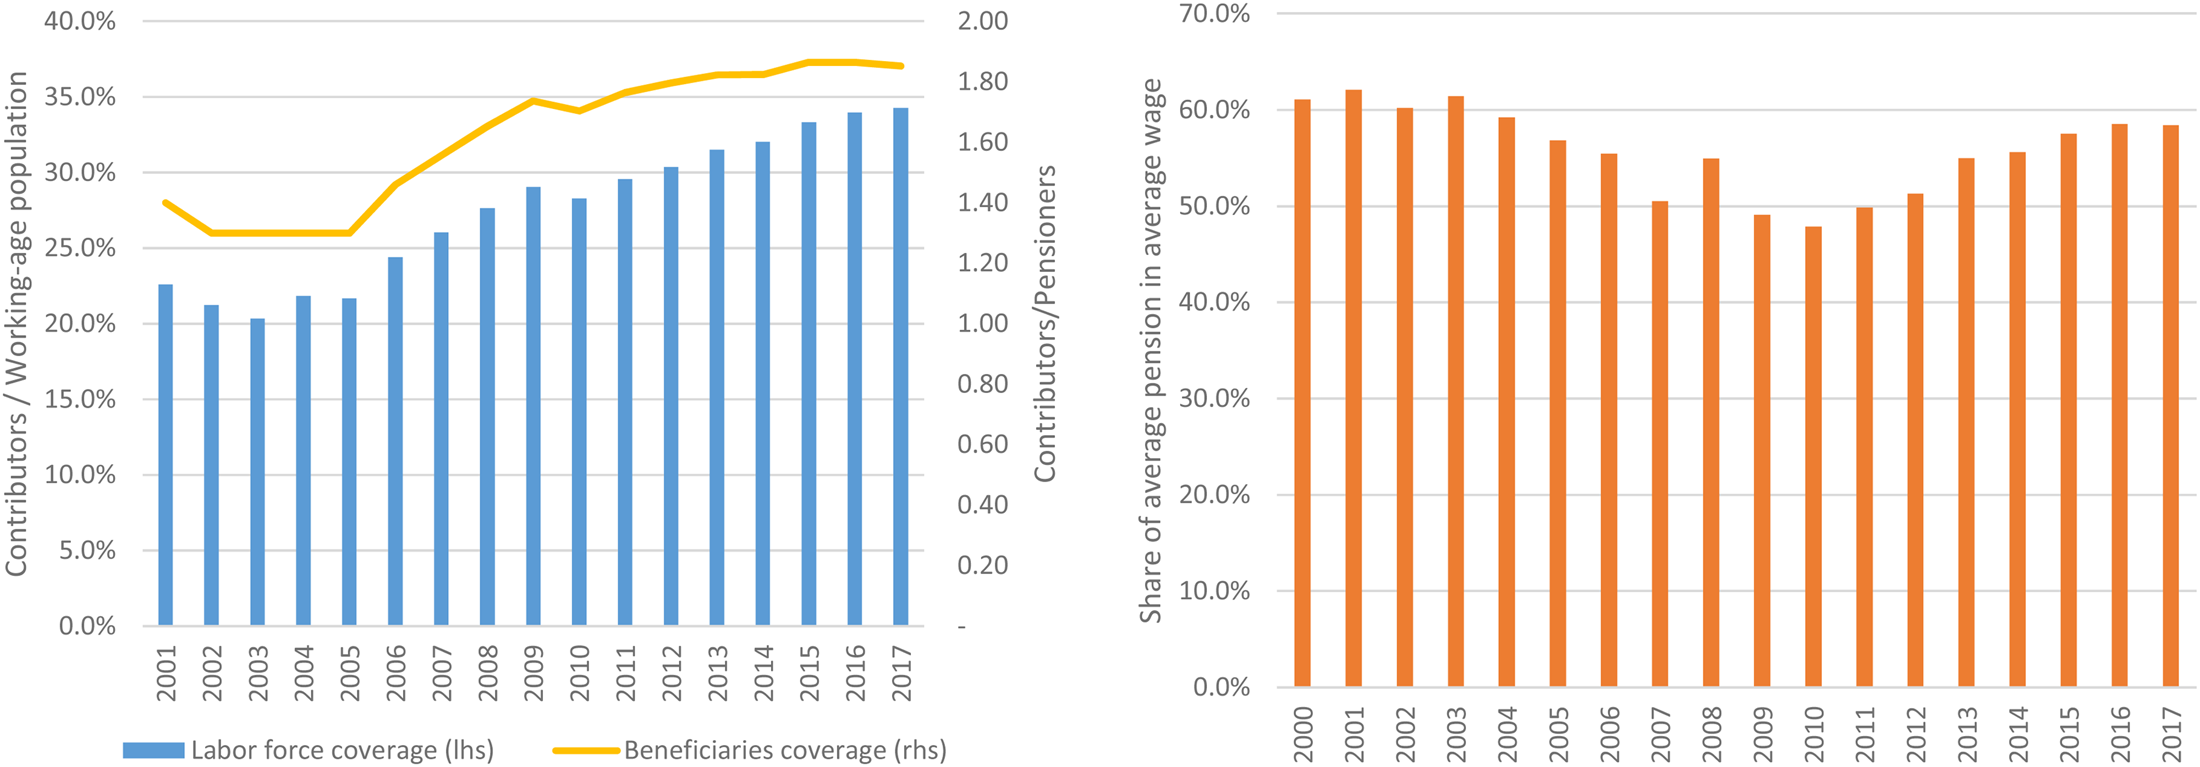
We turn to present some figures on the replacement rates, demographic trends, and financing pressures onto the Macedonian pension system. Figure 1 displays the coverage of the labour force and pension beneficiaries by contributors (left figure) and the replacement rate (right figure). The contributors' participation in the labour force has increased by more than 10 percentage points (p.p.) over the period under analysis (from 23% in 2001 to 34% in 2016Footnote 1). The indicator for the pension beneficiaries' coverage also experiences an upward trend (from 1.5 contributors for every pensioner in 2001 to 1.86 in 2016). This is due to the increase in employment, which in recent years was mainly driven by the entry of foreign direct investments in the country and active employment measures, which were not always compensated by payments in the PDIF because of the exemptions and subsidised contributions for pension insurance in some of these recruitments.
Coverage of the labour force and pension beneficiaries by contributors (left) and replacement rate (right).

In parallel with the increase in the number of contributors and the coverage of pension beneficiaries, there has been an increase in the replacement rate. Actually, it was noting a decline until 2008, though an accelerated growth afterwards, which corresponds to the ad-hoc pension increases which outpaced wage growth.
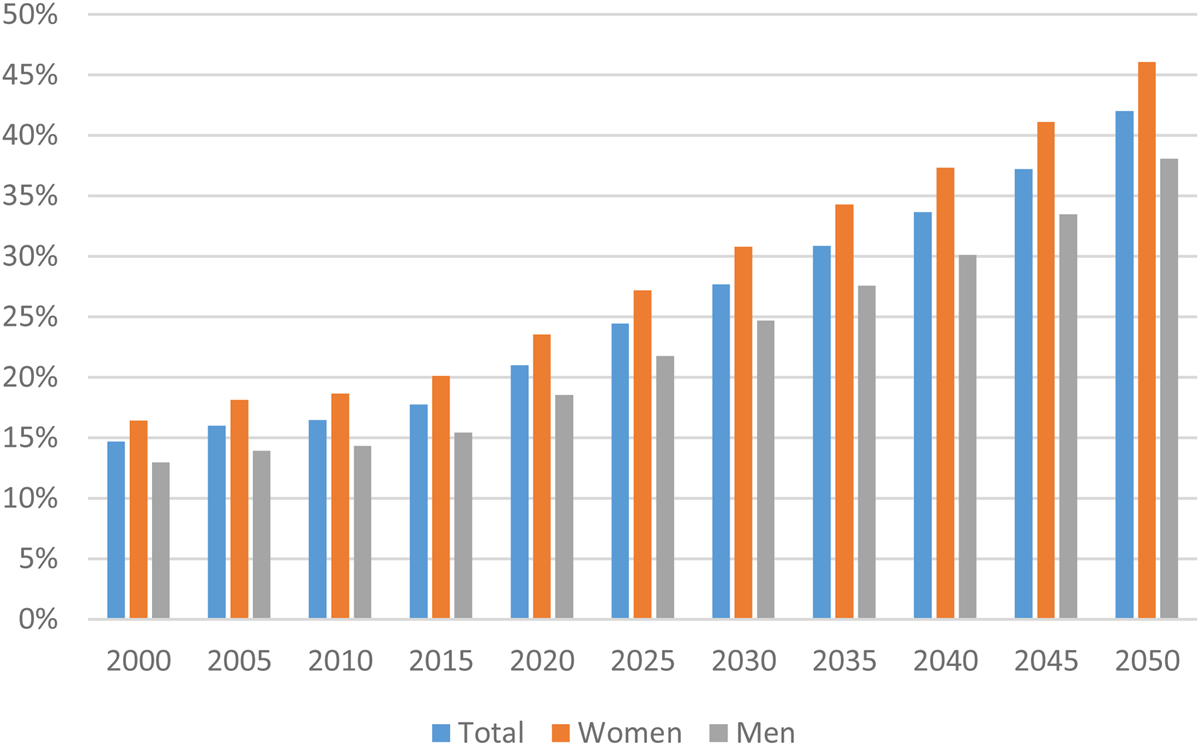
The population in North Macedonia is ageing, as it is expected that until 2050 the old-age dependency ratio will reach a record high of 42% (Figure 2). In addition, this ratio is higher among women: in 2000, it was 16% for women compared to 13% for men, and the expectations are that in 2050 this gap will widen to 8 p.p.
Old-age dependency ratio 65+/ (15–65).

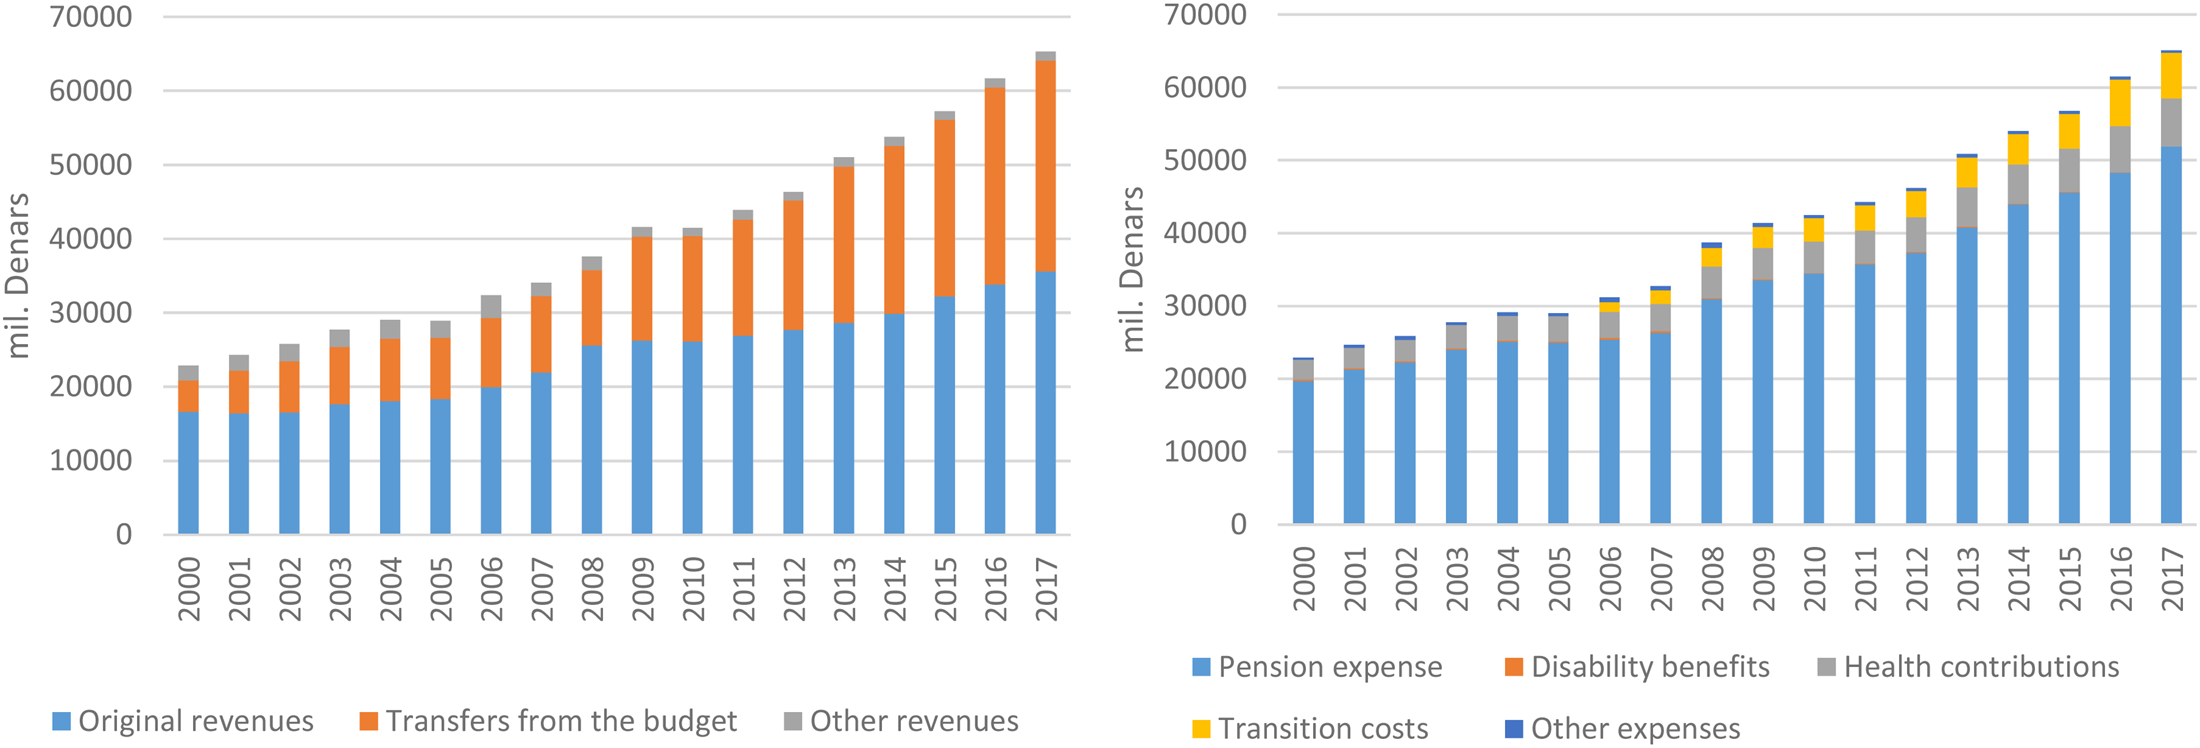
The growth of wages and employment resulted in doubling of the revenues from pension contributions between 2000 and 2017 (Figure 3, left). However, the need for pay-outs over the same period nearly tripled, determining a growing need for the pension deficit to be financed from the central budget. Hence, between 2000 and 2017, the transfers from the central budget increased six-fold. This brought about a significant change in the PDIF revenue structure, where the original revenues significantly dropped despite remaining the main source of funding, while the revenues from the central budget increased from 18% in 2000 to 43.6% in 2017. Pension expenditures likewise grew, particularly faster after 2008 (Figure 3, right), partially because of the emergence of the transition costs appearing with the transition from mono- to the three-pillar system in 2006, but predominantly because of the frequent ad-hoc increases of pensions in the wake of the populist promises. Before 2008, the economy, on average, grew 3.1% annually, and pensions 2.9%; whereas after 2008, the figures have been 2.4% and 6.5%, respectively.
Pension fund revenue (left) and expenses (right) structures, 2000–2017.

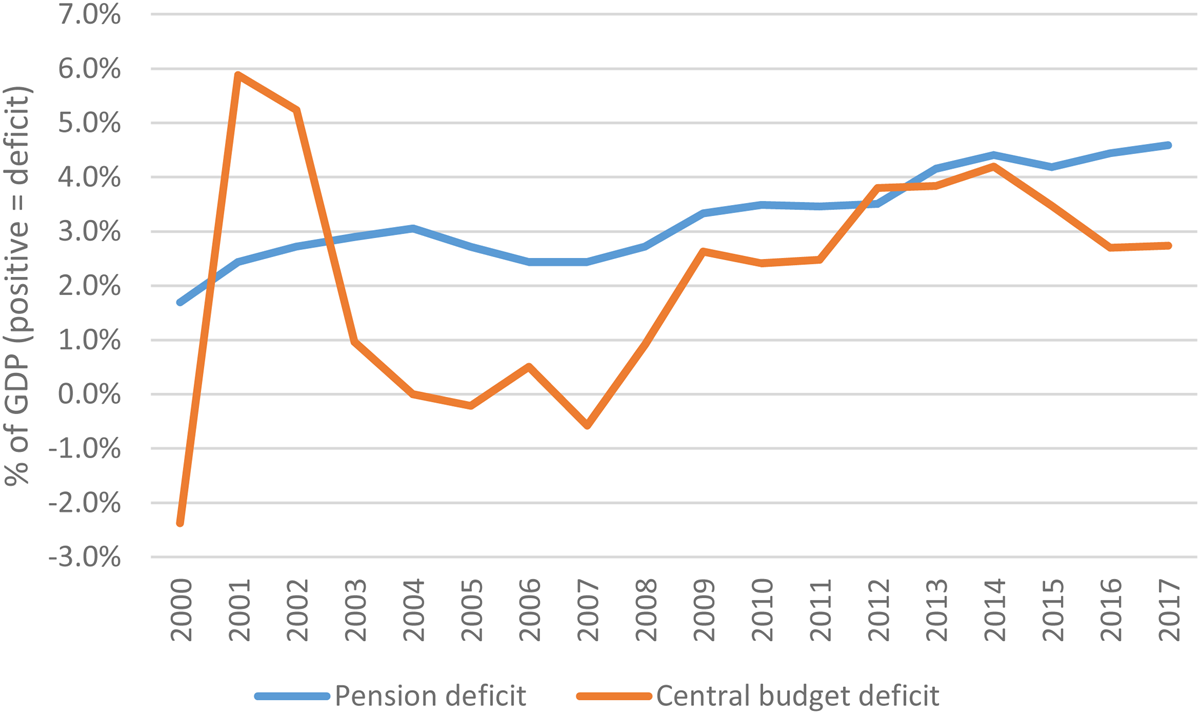
These developments created a soaring pension deficit, which is a major part of the observed period outpaced the central budget deficit (Figure 4).
Pension deficit.

Given population ageing, yet low coverage of the working-age population, as well the increasing pressure onto the public finances in the form of part dependence on budget revenues, pension system sustainability is at significant risk in North Macedonia, with a strong potential for negative impact onto current and future beneficiaries' welfare.
3. The modelling and simulation setup
3.1 Methodology and data
The starting point for the methodology of this paper is MK-MOD, the Tax & Benefit Microsimulation Model, which belongs to the EUROMOD family (Petreski and Mojsoska Blazevski, Reference Petreski and Mojsoska-Blazevski2017). It is a static model where individual behaviour (labour-market activity, employment, childcare, saving, etc.) is assumed to be exogenous to the tax-benefit system. It belongs to the family of ‘standard’ static models where individuals/households choose to supply labour (hours of work) until the point where the ‘marginal disutility of work equals the marginal utility of disposable (net-of-tax) income.’ (Saez, Reference Saez2010, p. 180). In this setting, taxes and social transfers affect labour-market behaviour by changing the relative value of work versus leisure. The model allows, in the starting year, the simulation of taxes, benefits and contributions of pension, health and unemployment insurance, social transfers, and static replication of pensions on a system level. Despite the extensiveness of the static model for simulations and replication of indicators in the system as a whole, the simulation of the pension system and the projections of future developments require dynamic components. Hence, MK-MOD has been upgraded by the MK-PENS Dynamic Microsimulation Pension Model based on individual data.
MK-PENS includes the movement of individuals from the sample in a time range, enabling them to be traced as they age, considering their interpersonal (family) relations, behavioural responses, and the effects from the changes in their labour-market status on development indicators (mainly, poverty, and unemployment). Thus, MK-PENS creates a life path for each individual in the sample, including the probability of death, change in economic status, time of retirement, earnings, etc.
The first component of MK-PENS’ dynamics is the population flow over time. In models with static population ageing, projections are given exogenously and the groups are only re-weighted, without changing the individual characteristics over time (age, change in economic status, mortality etc.) (Merz, Reference Merz1993, Reference Merz1994). In models with dynamic population ageing, individual characteristics change endogenously over time (Caldwell, Reference Caldwell and Harding1996), considering that there is some probability of the characteristics changing. The number of variables that could be foreseen in a dynamic way depends on the availability of data, risks, and the ability to predict the probabilities (Dekkers, Reference Dekkers2007). In MK-PENS, projections of fertility and total population are given exogenously, i.e. they are taken from the projections in UN-Population (static component), while the total mortality is a residual and is scaled to replicate the mortality rate published by the State Statistical Office of North Macedonia. However, the mortality of individuals in the sample was derived from the health function (dynamic component), and we used the following two equations for that purpose:
For persons aged from 25 to 62 (women) and 64 (men)
 $$\Pr \lpar {Health_i = 1} \rpar = \alpha _1 + \gamma _1age_i + \gamma _2gender_i + \gamma _3education_i + \gamma _4hhincome_j + \gamma _5hronic_i + u_{1i}$$
For persons aged over 62 (women) and 64 (men):
 $$\Pr \lpar {Health_i = 1} \rpar = \alpha _2 + \gamma _{11}age_i + \gamma _{12}gender_i + \gamma _{13}pension_i + \gamma _{14}married_i + \;u_{2i}$$
where: Health i is a binary variable obtaining a value of 1 if a person i is in good health (where the self-reported health condition is good, very good or excellent) and 0 when the person is in ill-health (the self-reported health condition is poor or very poor); age i denotes the age of person i in years; gender i denotes sex, and has a value of 1 for men and 0 for women; education i is a categorical variable about the level of education (primary education is the reference category) of person i; hhincome i is the household income level j in MKD; pension i is person's i pension amount, in MKD; married i denotes marital status, and obtains a value of 1 for married individuals, and 0 for all others. u 1i and u 2i are the usual idiosyncratic errors that are assumed to be well-behaved. In the model, the life status (alive-dead) changes over time based on the probability of health defined in these two functions. The predictions of both functions (1) and (2) are used to determine which person will die-out after a given period. Hence, persons aged over 62/64 whose predicted probability of good health is under 0.15 die according to the model, and this value in the working population is 0.53. The total mortality rate published by the SSO is replicated according to these dynamics of dying.
The second dynamic component is the change in the individuals' economic status as it concerns their behavioural responses. The purpose of behavioural microsimulations is to assess the behaviour of individuals as a function of variables that directly depend on the change in the policy being simulated (Spadaro, Reference Spadaro2007). Pension reform has different effects and will cause different behaviours among different groups in the sample. Therefore, the assessment of individual behaviours to the policy change is important for later simulations of the taxes, benefits, and expenditure. Individuals in the model are classified into the following economic statuses: unemployed, employed, inactive working-age persons, pensioners, and persons without pension aged over 62/64. The main assumptions about the transfer from one economic status to another are the employment rate, which is an exogenous variable, and the employment growth. This assumption is that employment rate growth is on average, 4 percentage points in a 5-year period, according to the average annual growth in recent years. Individuals obtain an employed-person status according to a derived function of employment probability, regressed on a vector of variables. The equation calculates the probability that individuals with an unemployed and inactive status will transition to employed-persons statusFootnote 2. The equation has the following form:
 $$\Pr \lpar Emp_i = 1\rpar = \alpha _3 + \gamma _{31}age_i + \gamma _{32}gender_i + \;\gamma _{33}education_i + u_{3i}$$
where Emp i takes a value of 1 if the person is employed and 0 otherwise, regressed on a vector of explanatory variables described before and u 3i denotes the error. Function (3)'s predictions are used to determine which individuals will be employed after a given period. Hence, individuals whose predicted employment probability is over 0.7 are employed. The average employment rate of the previous 5 years is replicated according to these employment dynamics.
However, individuals transitioning to employed-persons status do not have a wage, which is key for determining the contributions increase driven by the employment increase. To determine the wage, we use the following Mincer earnings function:
 $$lnw_i = \alpha _4 + \gamma _{41}age_i + \gamma _{42}gender_i + \;\gamma _{43}education_i + \gamma _{44}experience_i + \varepsilon _i$$
where lnw i is the logarithm of monthly earnings of an employed person i; experience i is a person's experience, and the other explanatory variables are the same as in (3); ɛi is the idiosyncratic shock to the wage. The predictions from equation (4) are used to estimate the income from work of the unemployed and inactive individuals, who are assumed to be employed according to the predictions in (3).
The estimated coefficients of equations (1)-(4), used for the predictions we use in the simulations, are presented in Appendix 1, along with a short discussion.
Children, students, and pensioners change their economic status in a static way by ageing over time. Children transition to pupils/students when they reach the age of 6; pupils/students transition to inactive working-age individuals when they reach the age of 15; and employed individuals transition to pensioners after meeting the retirement requirements. After a change in status, the model re-weights the individuals in the sample according to their new status. This re-weighting is done only for the statically determined statuses (children, students, inactive working-age population, and persons in the age of retirement without a pension).
Designed this way, MK-PENS fully replicates the actual data and is hence robustly validated. Validation figures are provided in Appendix 2.
The model's dynamic component allows for microsimulations and projections of future developments regarding these indicators under simulated assumptions about policy changes. As an advantage, the database allows the compilation of all the information on the individual characteristics of persons (age, education, economic status, health status, revenues on different grounds, etc.), information about household composition, and about the socioeconomic status. The Quality of Life Survey in North Macedonia – 2017 has been the data source used, comprising a random sample at a national level of 1,200 households, covering 4,071 individuals.
3.2 Parameters and assumptions
In the simulations, we model the following pension types: old-age, survivor, and disability pension. The number of pension beneficiaries is defined as the sum of the number of existing pensioners in the baseline year, for each type, increased by the number of new pensioners and decreased by the number of deceased pensioners (previously identified by health equation 2).
The eligibility requirements to be entitled to a pension are in accordance with the conditions set out in the Law, namely:
• For an old-age pension, the beneficiary has a minimum of 15 years of service and has reached 62 years of age for women and 64 years for men. In the old-age pension, individuals with reduced years of service due to having worked in military occupationsFootnote 3 have been simulated separately. The eligibility requirements for an old-age pension beneficiary with reduced years of service are: the person had a military occupation, has reached 50 years of age for women and 55 years for men, and has a minimum 25 years of service;
• For survivor pension, the beneficiaries are members of the deceased person's family: a spouse with the status of a widow(er), whose economic status is unemployed, having reached 50 years of age; all children being under the age of 15 or between the age of 15 and 26 years if they have the status of students. For future beneficiaries of survivor pensions, the pension right is acquired by members of the family, under the previously identified criteria, for a person whose status has transitioned from alive to deceased, according to the health function (2).
• For a disability pension, we consider the current disability pension beneficiaries regardless of the reason for the disability, and for future disability pension beneficiaries, we simulate only beneficiaries whose disability is caused by a diseaseFootnote 4. The disease is derived from the health function (1), when the person has a probability of ill-condition, within limits that replicate the current number of disability pension beneficiaries.
The pension amount is determined by a person's earnings during their career and the length of their service. Career earnings are approximated to the average net wage earned in the last 2 years for individuals that are still in employment, or the last 3 years before retirement for pensioners, adjusted to the wage growth from a 5-year average. The length of service refers to the years spent in work for which contributions and benefits have been paid. Depending on the length of service, we apply the replacement rates, as defined in the Law on Pension and Disability Insurance (2016), to the average earnings. For contributors covered by the mandatory pension and disability insurance before 2001, the replacement rate is: for 15 years of pensionable service, 35% for men and 40% for women, for each following year of pensionable service this rate increases by 1.8 percentage points for men and 2.6 percentage points for women until the 20th year of service, and 1.8 percentage points for each year following 20 years. The maximum replacement rate is 80% for 40 years of service completed for men and 35 for women. For each additional year of pensionable service completed after 1 January 2013, the pension is calculated in the amount of 1.84 for women and 1.61 for men from the pension base. The amount obtained in this manner is the total pension, which is received in the case of an old-age pension. The maximum old-age pension amount is limited to MKD 45,000. In the survivor pension, the pension amount is obtained as a percentage amount from the old-age pension to which the contributor would have been entitled, 70% for the first member, 10% more for each next member, to the maximum of 100%. The disability pension amount is 70% of the calculated old-age pension to which the contributor would have been entitled.
In calculating the pension, we include the pension adjustment in recent years, and we consider the assumption for future adjustments. For pensioners retired in the period between 2007 and 2016, we calculate a cumulative pension adjustment according to the actual annual pension adjustments in that period (maximum 40%). For pensioners retired before 2007, we include a fixed cumulative adjustment in the amount of 51%. Future adjustments were made in accordance with the legal provisions, 50% of the wage growth and 50% of the cost of living, and in our case, this adjustment was set at 1.5% annually.
The wage benefits and taxes are calculated through the net wage identified. The gross wage is calculated based on the net wage, which is reduced by tax exemptions, which is the basis for the calculation of taxes and benefits and depends on whether the person has full-time or part-time insurance. For pensioners, we only calculate the health and disability insuranceFootnote 5 in the amount of 13% of the net pension.
3.3 Scenarios
We set the scenarios for dynamic simulations over a time horizon of 5, 10, and 20 years. Simulations have a dual purpose: (1) to estimate the future developments of the basic parameters if there are no reforms in the pension system; and (2) evaluate the fiscal effects and effects on poverty and unemployment of the potential reforms in the pension system. In the simulated scenarios, we propose two types of reforms: (1) reforms where the burden will mainly affect one stakeholder (pensioners or contributors), (2) reforms with a shared burden and (3) a reform where the burden is shared and the reform is gradual. Reforms concern the following: a change in the contribution rate and in the retirement age limit for different types of beneficiaries, including beneficiaries with reduced years of service due to having military occupations.
The reform scenarios are the following:
(1) The burden is borne by one stakeholder:
• Increase in the contribution rate from 18% to 22%;
• Retirement age limit for old-age pension is extended by 2 years (from 62 for women and 64 for men to 65 and 67, respectively);
• Retirement age limit for survivor pension is extended by 3 years (from 50 for widow(er) to 53);
• Retirement age limit for pension beneficiaries with reduced years of service is extended by 3 years (from 50 for women and 55 for men to 53 and 58, respectively).
(2) The burden is shared among stakeholders:
• Increase in the contribution rate by 2 p.p. and extending the retirement age limit by a year for old-age pension, 2 years for survivor pension, and 2 years for pension-based on reduced years of service;
• Increase in the contribution rate by 3 p.p. and extending the retirement age limit by 2 years for old-age pension, 2 years for survivor pensions, and 2 years for pensions based on reduced years of service;
• Increase in the contribution rate by 3 p.p. and extending the retirement age limit by 2 years for old-age pension immediately, and by an additional 1 year after 5 years, 2 years for survivor pensions, and 2 years for pensions based on reduced years of service.
(3) The burden is shared among stakeholders, and the reform is gradual:
• Increase in the contribution rate by 2 p.p. immediately and an additional p.p. after 10 years; extending the retirement age limit, age limit for survivor pensions and reduced years of service by a year after 5 years and by an additional year after 10 years.
In all scenarios, the pension adjustment is for the legally envisaged level only. Therefore, current pensioners also bear the burden of the difference for the higher adjustment than the one set out in the Law, which they were receiving in the past years.
4. Results
4.1 Fiscal effects from the pension reform
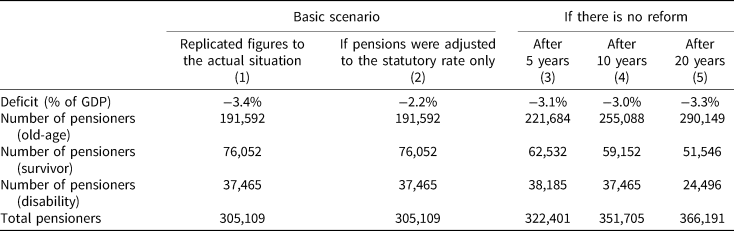
We turn to presenting the results of the proposed pension reforms. Table 1 presents the fiscal effects if the pension system remains with its current design and no reform is made. Column 1 replicates official figures and serves for reference; column 2 shows the effects if the pension adjustment in the past period did not exceed the maximum stipulated in the Law; columns 2–4 show the results after 5, 10, and 20 years, respectively, if the system design remains the same and no pension reform takes place.
Fiscal effects in case of no pension reform

Source: 2017 Quality of Life Survey, authors' estimates.
The results indicate that if the pension increase in the past period was only within statutory adjustment, today, the original deficit would have been 35% lower, and the share in GDP would have been lower by 1.2 percentage points. If there is no pension reform in the next 20 years, and the pension growth remains only on the statutory adjustment level, the original deficit will remain high, persistent, and insignificantly declining.
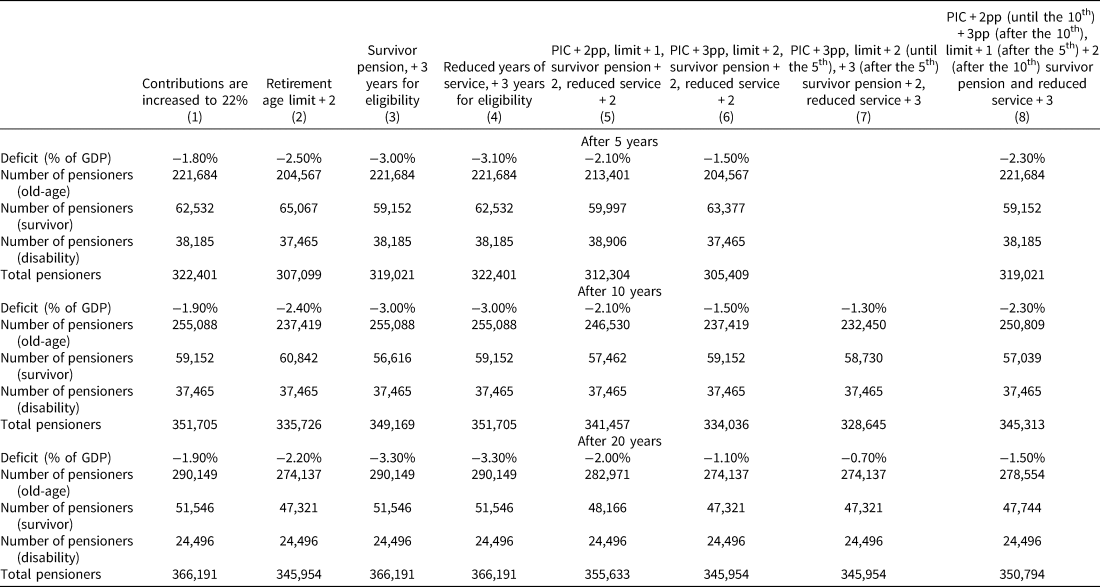
Table 2 presents the fiscal effects of the simulated scenarios for pension reform in the next 5, 10, and 20 years. Columns 1–4 show the results from the scenarios of stronger individual shocks, when the burden falls on one stakeholder, namely: (1) increase in the contributions to 22%; (2) extending the retirement age limit for old-age pension by 2 years; (3) for survivor pension from a spouse by 3 years; and (4) for old-age pension with reduced years of service by 3 years. Columns 5–7 show the results from the scenarios of combined pension reform, with simultaneous changes in the contribution rate and retirement age limits. Column 8 shows the results from the combined cascading reform.
Fiscal effects from the simulated pension reform scenarios

Source: 2017 Quality of Life Survey, authors' estimates.
Results show that the proposed reforms could significantly reduce the pension deficit; after 5 years, the deficit will range from 1.5% to 3.1% of GDP, and between 0.7% and 3.3% after 20 years. The increase in contributions to 22% reduces the deficit by 40% after 5 years, and by 49% after 20 years. It seems that the greatest reduction in the deficit occurs in these individual scenarios. The increase in the retirement age limit by 2 years reduces the deficit by 18% after 5 years, 19% after 10 years, and 35% after 20 years. The effects of the change in the retirement age limit for survivor pensions and old-age pensions for the beneficiaries with reduced years of service are small. However, this is due to two facts: the number of survivor pension beneficiaries is relatively smaller compared to the old-age pension beneficiaries, and the changes proposed concern only those cases where the spouse is the beneficiary; whereas, for the old-age pension beneficiaries with reduced years of service, we covered only the beneficiaries of workers in military occupations and hence the effects are significantly underestimated.
The combined reforms reduce the deficit between 0.7% and 2.1% of GDP compared to the situation of no reform. Fiscal savings from the reform range from EUR 10 to 193 million annually for up to 5 years, and to EUR 230 million after 10 years. Certainly, the greatest effect is produced by the reform where the contribution is increased by 3 percentage points, the retirement age limit is extended to 64/66 years immediately and to 65/67 years after 5 years for old-age pension, to 52 years for survivor pension, and to 53/58 years for old-age pension with reduced years of service. In this scenario, the deficit would reduce to 1.3% of GDP after 10 years and to 0.7% of GDP after 20 years, which represents a significant, robust, and desired consolidation of the pension system.
The gradual reform has similar effects as the individual changes, with weaker fiscal effects than the combined reform starting immediately. This reform reduces the deficit to 2.3% of GDP up to 5 and 10 years, and to 1.5% of GDP in 20 years.
4.2 Effects on poverty and unemployment
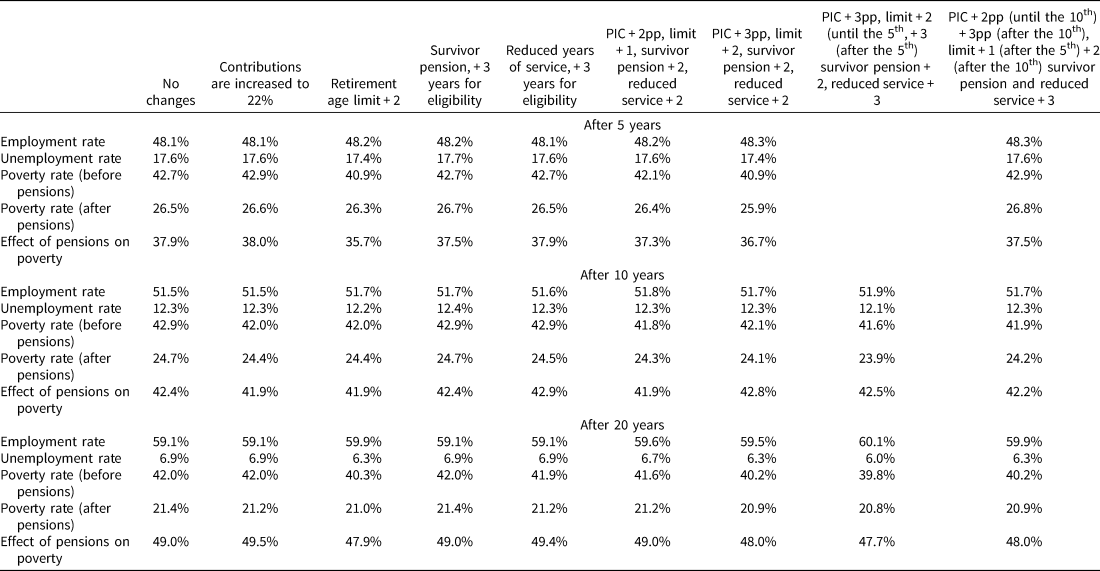
Table 3 presents the results of the pension reform effects on unemployment and poverty. No adverse effects on unemployment are produced as it decreases insignificantly or remains the same compared to the scenario of no reform, except in the scenario for increasing the eligibility limit for survivor pension of spouses, where the unemployment rate insignificantly increases. The greatest decrease in unemployment is observed in the scenario of higher retirement age limit and in the combined reform with increasing pension contribution by 3% and the retirement age limit by two years.
Effects on poverty and unemployment

Source: 2017 Quality of Life Survey, authors' estimates.
No significant changes in the poverty rate are produced of the pension reform either. It increases insignificantly only in the scenario with a higher contribution rate over a 5-year period. This development is expected because contributions directly affect the lower net earnings of workers. Meanwhile in the simulations of the effects over a 10-year period, the poverty rate is in decline or remains constant. This is also the scenario where the poverty-reduction effects are the strongest, mainly due to the fact that the main burden falls on the current contributors and working-age population. On the other hand, the increase in the retirement age limit reduces the poverty rate before and after pensions, as a result of the increased income of the individuals who remained employed compared to the income that these individuals would receive from their pension, though this reduces the effect of pensions on poverty. The largest effects are achieved in the combined scenarios, i.e., the poverty rate after pensions is the lowest there.
5. Conclusion, recommendations and policy follow up
The objective of this paper is to propose a pension reform design and to examine the fiscal effects and effects on key indicators of unemployment and poverty from potential pension reform in North Macedonia. To that end, we constructed MK-PENS Dynamic Microsimulation Pension Model. It includes a movement of individuals over a period of time as they age, considering the interpersonal relations, the behavioural responses and the effects from a change in their labour-market status on poverty and unemployment. Thus, the model creates a life path for each individual, including the probability of death, change in the economic status, time of retirement, earnings, etc. Quality of Life Survey in North Macedonia 2017 has been used, conducted on a representative sample at a national level of 1,200 households and covering 4,071 individuals.
Results suggest that if the pension increase in the recent period was only within the statutory adjustment, the original pension deficit would have been 65% lower today, while its share in GDP lower by 1.2 p.p. With no pension reform assumed, and if pension growth remains only within the statutory adjustment, the original deficit will not subside.
Simulated scenarios suggest that the proposed pension reforms could significantly reduce the pension deficit and after 5 years, it would range from 1.5% to 3.1% of GDP, from 1.3% to 3% after 10 years, and from 0.7% to 3.3% after 20 years. The combined reforms with immediate changes reduce the deficit from 0.7% to 2.1% of GDP. The combined gradual reform moderately reduces the deficit by 26% over 10 years, and halve it in 20 years.
The effects of the proposed pension reform on poverty and unemployment are favourable, though the intensity differs. In the scenarios where some of the individuals remain in the labour force due to late retirement, and in some of the combined reforms, unemployment reduces insignificantly. The effects of poverty are maximized in the combined scenarios.
Based on these findings, the government should consider a reform of the pension system whereby the burden of the tightening is shared among the stakeholders. Immediate effectuation of such reform would produce the strongest results for the fiscal consolidation and for the poverty and unemployment, but as political price may immediately soar, a gradual reform may be highly feasible option. In these lines, the government should strongly refrain from ad-hoc pension increases beyond the potential delivered by the wage and employment growth. The reform may be accompanied by stimulating programmes for voluntary later retirement by introducing additional premium, higher replacement rate or a one-off allowance and particular consideration for jobs requiring hard physical effort.
After the new government assumed office in June 2017, the demonstrated awareness among policymakers that pension finance should be reformed significantly increased. The policy discussions related to the pension system sustainability have been already tense at the time of publishing of the results of this study in the domestic media (March 2018). The policy debate was supported by the IMF and the World Bank, which announced a similar stance as the one presented in the study, in May–June 2018. While the Government announced it was conducting calculations on the matter, no specific moves were announced until November 2018, except the firm stance that the retirement limit would not change. The latter has been mainly driven by political motives and by the sensitivity of the period which coincided with the final resolution of the long-disputed ‘name’ issue between North Macedonia and Greece. A pension reform has been announced in November 2018, effective January 2019, with a cumulative increase of the pension contribution rate of 0.8 percentage points in 2 years (2019 and 2020), an increase of the replacement rates for the three-pillar beneficiaries by cca. 33% and an option for workers born before 1967 and workers with reduced years of service (mainly in police and army) who previously transited into the three-pillar system to voluntarily return to the PAYG. Apparently, the announced reform has been considerably milder than, and without some key elements of the simulated scenarios in this study; such design will surely contribute to the stabilization of the pension finance in North Macedonia, but the required time will be significantly longer. In any case, this study significantly contributed to structured, data- and evidence-driven policy and public discussions on the pension topic in the country and has been the key for the contribution rate increase to have passed through with general acceptance.
Appendix 1
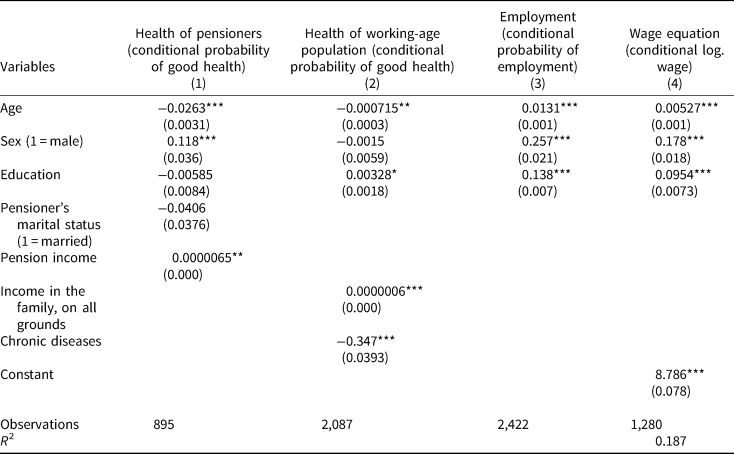
The estimates from the functions for health, employment, and wage are given in Appendix Table 1. Column (1) shows the results for the probability of pensioners' good health; column (2) shows the results for the probability of good health in the working-age population; column (3) shows the results for the probability of employment; and column (4) shows the results for the wage. All coefficients are marginal effects from probit functions (1–3). The ratios also include the expected sign. Age, sex, and pension income are all statistically significant for the health of pensioners. As expected, each additional year of age reduces the probability of good health in pensioners. Men have a higher probability of good health, while higher pensions increase the probability of good health. Education and marital status are statistically insignificant for the health of pensioners (and they are not used for the predictions).
Results of the behavioural equations

The health of the working-age population depends on age, education, and family income. As in the case of pensioners, an additional year of age reduces the probability of good health. However, in the working-age population, the magnitude of this ratio is drastically lower. This is to be expected because in the older populations, an additional year of age has a higher adverse effect on health. Higher education and family income increase the probability of good health, while the existence of chronic diseases reduces it. Unlike the case of pensioners, sex in the working-age population is not statistically significant.
The three explanatory variables of age, education. and sex are important for the probability of employment. Older individuals, men, and individuals with higher education have a higher probability of employment. Likewise, age, education and sex are significant for wages. Older individuals have a higher wage. This is probably due to experience and to wage negotiation skills, which do not appear as observed variables in this equation. Men, on average, earn a higher wage than women by 18%, which confirms the results for the adjusted gender wage gap in North Macedonia in the study by Petreski and Mojsoska-Blazevski (Reference Petreski and Mojsoska-Blazevski2016). As expected, individuals with higher education have higher wages.
Appendix 2
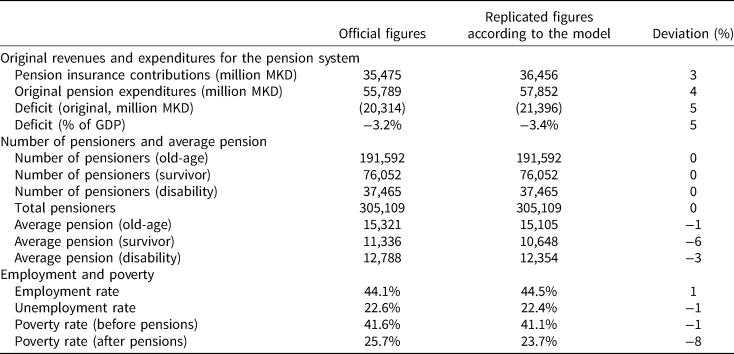
MK-PENS is able to replicate the initial level of the number of contributors, pensioners, and the average pension amount (per pension type), original contributions and benefits for pension, health and disability insurance, the number of original pension expenditures, poverty rates and unemployment, as per the Appendix Table 2.
Validation of MK-PENS

Validation results show that the model fully replicates the official data, with a maximum deviation of −6% in the case of an average survivor pension and of −8% in the poverty rate after pensions. In the first case, the deviation could be caused by two underestimations: underestimation of the deceased person's pension base (which is very hard to estimate adequately, due to lack of information on the deceased person) and the underestimation of the number of beneficiaries in one family.