INTRODUCTION
Progress in neonatology and obstetric care has pushed the limits of viability for premature infants in recent decades. Extremely preterm (EP) infants, born between 23 and 27 weeks of gestation in the surfactant era, are able to survive, yet not without cost. Survival rates of 3.5%, 29%, 50%, 67%, and 72% have recently been reported for 22, 23, 24, 25, and 26 gestational weeks, respectively (Express Group, Reference Fellman, Hellstrom-Westas, Norman, Westgren, Kallen and Lagercrantz2009). The disabilities rate is elevated near the threshold of viability, as established by several cohort studies from industrialized countries. For example, findings from the EPICure study (Woods, Marlow, Costeloe, Gibson, & Wilkinson, Reference Woods, Marlow, Costeloe, Gibson and Wilkinson2000), a follow-up of children from the United Kingdom and Ireland born in 1995, with gestational age < 26 weeks at delivery, revealed that at the median age of 30 months, 30% of the cohort exhibited moderate to severe delay in cognitive or motor development. At the age of six years, 46% percent of the children exhibited such delay (Marlow, Wolke, Bracewell, & Samara, Reference Marlow, Wolke, Bracewell and Samara2005). The Victorian Infant Collaborative Study Group (Doyle, Reference Doyle2004; VICS Group, 1997) reported a moderate to severe disability rate of 30% and 31% in two birth cohorts of two-year-olds (1991/92 and 1997, respectively) estimated to be 23–27 gestational weeks. A Canadian study group (Jacobs, O’Brien, Inwood, Kelly, & Whyte, Reference Jacobs, O’Brien, Inwood, Kelly and Whyte2000) reported a mild to severe disability rate of 35% in surviving infants followed up until 2 years of age and born between 1990 and 1994 at 23–26 weeks’ gestation. Hintz, Kendrick, Vohr, Poole, & Higgins, (Reference Hintz, Kendrick, Vohr, Poole and Higgins2005) analyzed data from the National Institute of Child Health and Human Development (NICHD) Neonatal Research Network and reported that the prevalence of impaired cognitive development (Bayley Mental Development Index < 70) in two cohorts of neonates delivered at < 25 weeks’ estimated gestation, born between 1993 and 1996 or between 1996 and 1999, was 40% and 47%, respectively, at 18–22 months corrected for prematurity. Recent magnetic resonance imaging (MRI) studies, attempting to specify brain substrates underlying the impairments characterizing this population, revealed white and cortical gray matter damage (Horsch et al., Reference Horsch, Hallberg, Leifsdottir, Skiold, Nagy and Mosskin2007; Inder, Wells, Mogridge, Spencer, & Volpe, Reference Inder, Wells, Mogridge, Spencer and Volpe2003; Maalouf et al., Reference Maalouf, Duggan, Rutherford, Counsell, Fletcher and Battin1999; Spittle et al., Reference Spittle, Brown, Doyle, Boyd, Hunt, Bear and Inder2008; Woodward, Anderson, Austin, Howard, & Inder, Reference Woodward, Anderson, Austin, Howard and Inder2006) and unsuspected, yet common, cerebellar pathology (Bednarek et al., Reference Bednarek, Akhavi, Pietrement, Mesmin, Loron and Morville2008; Bodensteiner & Johnson, Reference Bodensteiner and Johnsen2005, Reference Bodensteiner and Johnsen2006; Dyet et al., Reference Dyet, Kennea, Counsell, Maalouf, Ajayi-Obe and Duggan2006).
In addition to differences in the rate of disabilities, significant differences were observed from early school age to adolescence, between EP children and full-term controls, on multiple functional outcome measures. Group differences in cognitive abilities between school-age children born at < 26 weeks gestation and term-birth controls were documented by the VICS (Anderson et al., Reference Anderson and Doyle2003) and the EPICure Study (Marlow et al., Reference Marlow, Wolke, Bracewell and Samara2005) for cohorts born in the 1990s. Anderson and Doyle’s (Reference Anderson and Doyle2008) quantitative integration of studies conducted during the presurfactant and surfactant eras yielded large group differences in IQ, ranging from .8 to 1.5 SDs, between EP- and term-birth children. Other studies revealed additional group differences in language skills (Taylor, Hack, Klein, & Schatschneider, Reference Taylor, Hack, Klein and Schatschneider1995; Taylor, Klein, Minich, & Hack, Reference Taylor, Klein, Minich and Hack2000; Taylor, Minich, Bangert, Filipek, & Hack, Reference Taylor, Minich, Bangert, Filipek and Hack2004), verbal and visuospatial memory (Taylor et al., Reference Taylor, Klein, Minich and Hack2000, Reference Taylor, Minich, Bangert, Filipek and Hack2004), attention and executive functions (Anderson & Doyle, Reference Anderson and Doyle2004; Marlow et al., Reference Marlow, Hennessy, Bracewell and Wolke2007; Taylor et al. Reference Taylor, Minich, Bangert, Filipek and Hack2004), visuomotor performance and finger dexterity (Marlow et al., Reference Marlow, Hennessy, Bracewell and Wolke2007; Taylor et al., Reference Taylor, Minich, Bangert, Filipek and Hack2004), gross motor skills (Hack et al., Reference Hack, Taylor, Drotar, Schluchter, Carter and Andreias2005a; Marlow et al., Reference Marlow, Hennessy, Bracewell and Wolke2007), scholastic achievement (Anderson et al., Reference Anderson and Doyle2003; Hack et al., Reference Hack, Taylor, Drotar, Schluchter, Carter and Andreias2005a, Reference Hack, Taylor, Drotar, Schluchter, Cartar and Wilson-Costellob; Marlow et al., Reference Marlow, Wolke, Bracewell and Samara2005; Taylor et al., Reference Taylor, Hack, Klein and Schatschneider1995), and behavioral adjustment (Anderson et al., Reference Anderson and Doyle2003; Hack et al., Reference Hack, Taylor, Drotar, Schluchter, Carter and Andreias2005a, Reference Hack, Taylor, Schluchter, Andreias, Drotar and Klein2009).
Comparisons of neuropsychological outcome between EP children and more mature preterm-birth controls were conducted on a cohort born during the presurfactant era (1982–1986) by the Cleveland group (Hack et al., Reference Hack, Taylor, Klein, Eiben, Schatschneider and Mercuri-Minich1994; Taylor et al., Reference Taylor, Minich, Bangert, Filipek and Hack2004). In addition to intellectual differences, the group reported discrepancies between EP children with birthweight < 750 g and preterm controls with birthweight between 750 and 1499 g on measures of verbal memory (Taylor et al., Reference Taylor, Klein, Minich and Hack2000), visuomotor performance (Hack et al., Reference Hack, Taylor, Klein, Eiben, Schatschneider and Mercuri-Minich1994; Taylor et al., Reference Taylor, Hack, Klein and Schatschneider1995), achievement, and behavioral adjustment (Taylor et al., Reference Taylor, Hack, Klein and Schatschneider1995). Anderson and Doyle’s quantitative summation (Reference Anderson and Doyle2008) yielded a value between .3 to .5 standard deviations (a small to medium effect size) for studies reporting IQ discrepancy between school-age children born < 26 weeks’ gestation and preterm-birth controls born between 26 and 31 weeks, though results from a recent study with negative findings (Baron, Ahronovich, Erickson, Gidley Larson, & Litman, Reference Baron, Ahronovich, Erickson, Gidley Larson and Litman2009) could not be included.
Little is known about factors associated with neuropsychological outcome variability within the EP population. One such investigation (Anderson et al., Reference Anderson and Doyle2003) involved a comparison of intellectual performance at eight years of age between two EP groups: 23–25 and 26–27 weeks’ gestation. Though the mean difference in IQ was only 2.7 points in favor of the more mature group, significant differences in spatial organization emerged (Anderson & Doyle, Reference Anderson and Doyle2004, Reference Anderson and Doyle2008). Even less information is available about the unique effects of gestational maturity, at the edge of viability, in the context of potentially confounding ante-, peri-, and neonatal risk factors or treatment-related variables. Such confounds, which may independently influence outcome and are more frequent in EP children, include bronchopulmonary dysplasia (Anderson & Doyle, Reference Anderson and Doyle2006), perinatal brain injury, such as intracranial hemorrhage (ICH) or periventricular leukomalacia (Dyet et al., Reference Dyet, Kennea, Counsell, Maalouf, Ajayi-Obe and Duggan2006; Ment et al., Reference Ment, Vohr, Allan, Westerveld, Katz, Schneider and Makuch1999), and postnatal corticosteroid therapy (Yeh et al., Reference Yeh, Lin, Lin, Huang, Hsieh, Lin and Tsai2004). Ayoubi et al. (Reference Ayoubi, Audibert, Boithias, Zupan, Taylor, Bosson and Frydman2002), who examined several confounding variables, reported that gestational age grouping (24–25 vs. 26–27 weeks), remained the principal prognostic factor associated with quality of psychomotor development in toddlers.
Survival at the edge of viability depends on prevailing medical practice. Subramanian (Reference Subramanian, Kurjak and Chervenak2006), who reviewed ethical dilemmas associated with resuscitation guidelines, noted that, “Globally, the viability limit seems to be slowly but steadily converging around 22–24 weeks based on biological and experiential data.” (p. 212). Pignotti and Donzelli (Reference Pignotti and Donzelli2008) concluded, following an international comparison of practical guidelines for the treatment of EP births, that at the threshold of viability, compassionate care is typically given at ≤ 22 weeks, while an individual approach consistent with the parents’ wishes and the infant’s clinical condition at birth is provided at 23–24 weeks. The outcome of the survivors is therefore of substantial interest to parents and neonatologists alike. Developmental researchers may view birth at the threshold of viability as an opportunity to enhance our understanding of brain vulnerability to disruption of maturational processes that occur around mid-gestation.
Our investigation entailed two major objectives. First, we wished to test the hypothesis that neuropsychological outcome differences exist between two groups of EP preschoolers: those born between 23 and 24 weeks’ gestation, at the viability limit, and those born between 25 and 26 weeks’ gestation, just above the viability limit. Second, we sought to examine the hypothesis that outcome differences, if found, are attributable, in part, to the unique contribution of gestational immaturity, rather than the effects of associated ante-, peri-, and neonatal risk factors or resultant physical handicaps. We hoped that recruiting children from relatively advantaged socioeconomic strata would help in controlling confounding class effects, thus permitting better isolation of the biological influence of gestational maturity on outcome. Outcome domains of interest included neuropsychological functions previously found to be vulnerable in EP children born at the threshold of viability in comparison to their more mature EP counterparts. Thus, we predicted that findings of impaired global cognitive and gross motor performance (Ayoubi et al., Reference Ayoubi, Audibert, Boithias, Zupan, Taylor, Bosson and Frydman2002) would extend to preschool age children in this extremely high-risk population. Because visuospatial skills are a particular area of deficit in preterm children compared to term controls, while basic language functions typically remain relatively intact (Aylward, Reference Aylward2002), we hypothesized that a similar deficit profile may be found in EP children born at the viability limit compared to EP children born above this threshold.
METHODS
Participants
The 41 participants, born in William Beaumont Hospital (WBH) Royal Oak, Michigan, between 23 0/7 and 27 0/7 weeks’ gestation, were graduates of the Neonatal Intensive Care Unit (NICU). At WBH, resuscitation is attempted for all infants with an estimated gestational age ≥ 23 0/7 weeks. The mean (SD) gestational age was 25.18 (1.11) weeks, while the mean (SD) birthweight was 745 (174) g. Gestational age was estimated by early prenatal ultrasound in > 95% of cases. The birthweight ranged from 365 to 1155g (2 cases with birthweight < 500g, 23 between 501–800g, 12 between 801–1,000g, 4 > 1,000 g). The children were born between 1996 and 2001 and evaluated between 2002 and 2007.
A participant with gestational age of 25 4/7 weeks and symptoms consistent with autism could not cooperate with testing. The remaining 40 participants were classified into two groups based on estimated length of gestation. Group 1 (n = 20) included children with gestational age between 23 0/7– and 25 0/7 weeks and Group 2 (n = 20) included children with gestational age between 25 1/7– and 27 0/7 weeks. Twenty nine of the 40 participants (15 in Group 1 and 14 in Group 2) were recruited through an ongoing study on outcome correlates of antenatal steroids and perinatal complications in preschoolers born prematurely, while 11 of the children (5 in Group 1, 6 in Group 2) were recruited through a study on the outcome of ICH in the same population. Age range at recruitment and participation rates differed somewhat between the studies (4–6 years for the prematurity follow-up and 3–5 years for the ICH study, participation rates of 64% and 56% of contactable families, respectively). Nonetheless, there were no differences in the distribution of subjects by study recruitment mechanism between the two EP groups, χ2 (1) = 0, ns).
The catchment area of WBH NICU included primarily middle class strata residing in suburban Detroit. About 85% of admissions were covered by private medical insurance whereas 15% were insured through Medicaid. These data are consistent with our sample’s composition, where the median Hollingshead (1975) socioeconomic status (SES) score was 53 on a scale with an upper limit of 66. Our recruitment rate was about 25% of live born children. The racial distribution for the 23–26 weeks’ gestation NICU cohort for the years 1996–2001 was 81% Caucasian and 19% other races, while the racial distribution in our sample was 80% Caucasian and 20% “Other” (χ2 = .01, ns). The sex distribution for the same cohort was 54% male to 46% female, while the sample’s ratio was 70 % male to 30% female (χ2 = 2.53, ns). Finally, 40% of the cohort, compared to 35% of the infants in our sample, were multiples (χ2 = 0.02, ns).
One child with congenital anomalies and one discharged on the ventilator were excluded. Although no child had a severe sensory, perceptual, or motor handicap that precluded testing, three children with cerebral palsy (CP) whose language skills were amenable to evaluation were recruited for partial testing, one in Group 1 (5%]) two in Group 2 (10%). None of the remaining children had perceptual or motor impairments.
According to maternal report, none of the children had sustained a head injury associated with loss of consciousness. Four children had history of seizures (two per group; three with febrile seizures and one with possible petit mal), but no child was receiving anti-seizure medications at the time of the evaluation. Additionally, none of the mothers reported prenatal alcohol exposure, although three (two in Group 1, one in Group 2) reported limited nicotine use (1–12 cigarettes per day).
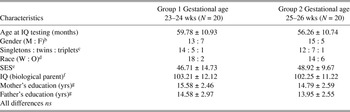
Information about each child’s pre-, peri-, and neonatal backgrounds was obtained from hospital charts and electronic databases and later compared against the extensive NICU research database. Inconsistencies were resolved through further chart review. The data are presented in Tables 1 through 4. As Table 1 reveals, there were no significant group differences in socio-familial characteristics.
Group comparisons of demographic and sociofamilial characteristicsFootnote a

Note
a Frequencies are reported for discrete data, means, and standard deviations for continuous data. Group differences examined via t test (continuous data), 2 × 2 χ2 with Yates correction (discrete data), or Fisher Exact Probability Test (less than five cases per cell).
b M = male, F = female.
c The co-siblings of 3 twins and the triplet in Group 1 and the co-siblings of 1 twin and the triplet in Group 2 were not tested because the family opted not to return for the testing of the co-siblings.
d W = White, O = Other (Group 1: 1 Asian, 1 African American; Group 2: 4 African Americans, 1 Asian, 1 Hispanic).
e Hollingshead’s (1975) Four Factor Index of Social Status. Means based on 19 subjects per group due to missing data).
f Prorated parental IQ based on three subtests (Vocabulary, Similarities, and Information) of the Wechsler Adult Intelligence Scale–III (Wechsler, Reference Wechsler1997); means based on 19 and 12 parents for Group 1 and Group 2, respectively, due to missing data. Testing was completed on the biological mothers in all cases except for 2 cases in Group 2 where the mother was unavailable and the father was tested instead.
g Means and SDs are based on 19 subjects per group due to missing data.
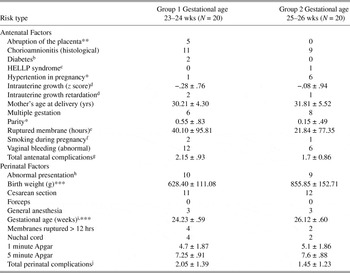
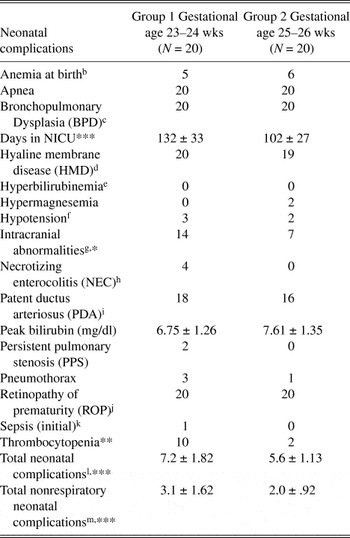
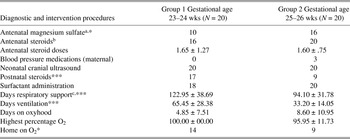
Table 2 summarizes group differences in antenatal and perinatal risk. The table reveals differences in the causes of preterm birth between the two EP groups. Whereas there was an increased frequency of placental abruption in Group 1, there was a nonsignificant trend for increased frequency of maternal hypertension in Group 2. Table 2 displays the expected group difference in gestational age and birthweight, yet no other differences in the distribution of perinatal factors are evident. Table 3 provides a summary of neonatal risk factors for the groups. The table shows the expected increase in hospitalization days in Group 1, as well as an accompanying increase in the overall frequency of neonatal complications. Table 3 displays separately the frequency of nonrespiratory neonatal complications, revealing significant group differences on this variable. Table 4 depicts antenatal and neonatal diagnostic and intervention procedures by group. The table shows the expected increase in need for oxygen supplementation and neonatal corticosteroid therapy in Group 1.
Antenatal and perinatal factors by groupFootnote a

Note
*p < .10; **p < .05; ***p < .01.
a Frequencies are reported for discrete data, means and standard deviations for continuous data. Group differences were examined by t test (continuous data), 2 × 2 χ2 with Yates correction (discrete data), or Fisher Exact Probability Test (less than five cases per cell).
b Includes both gestational diabetes and diabetes mellitus.
c HELLP = Hemolysis, elevated liver enzymes, and low platelets.
d A z score expressing the deviation of an infant’s birth weight from the mean weight of his/her gestational age group, at delivery, according to norms published by Kramer et al. (Reference Kramer, Platt, Wen, Joseph, Allen and Abrahamowicz2001). Intrauterine growth retardation was defined as a z score associated with birth weight at the 10th percentile when stratified by gestational age.
e Time from spontaneous or artificial rupture of membranes to delivery.
f Smoking behavior details in three smoking mothers. Group 1: one mother reported smoking 10, the other 12, cigarettes a day. Group 2: one mother reported smoking 1 cigarette a day.
g Total ante partum complications include maternal hypertension, chorioamnionitis, maternal diabetes, HELLP syndrome, intrauterine growth retardation, multiple gestation, smoking during pregnancy, abnormal vaginal bleeding, and placental abruption.
h Includes various atypical presentations such as breech or transverse lie.
i As determined by obstetrician.
j Total perinatal complications include abnormal presentation, C section, forceps, general anesthesia, membranes ruptured > 12 hours, nuchal cord, fetal tachycardia.
Neonatal data by groupFootnote a

Note
*p < .10; **p < .05; ***p < .01.
a Frequencies are reported for discrete data, means and standard deviations for continuous data. t tests were used to test continuous data; 2 × 2 chi-square with Yates correction were used for discrete data, and Fisher Exact Probability Test was used for discrete data with less than five cases per cell.
b Hematocrit < 40%.
c Criteria according to concensus diagnosis (see Jobe & Bancalari, Reference Jobe and Bancalari2001). The two groups had identical distributions, with 2 mild, 2 moderate, and 16 severe BPD in each.
d Based on a chest roentgenogram and clinical evaluation.
e Requiring exchange transfusion.
f Requiring treatment with volume or pressors.
g Documented with serial neonatal cranial ultrasound. Hemorrhages: Group 1, 1 case with unilateral Grade I, 9 cases with bilateral Grade I, 2 cases with unilateral Grade II, 1 case with bilateral Grade II, and 1 case with unilateral Grade III. Group 2, 2 cases with unilateral Grade I, 1 case with bilateral Grade I, 2 cases with unilateral Grade II, 2 cases with Grade IV. Ventricular Dilatation: Group 1, Mild ventricular dilatation in 2 cases with ICH. Group 2, 2 cases with Grade IV hemorrhage had very significant dilatation.
h Diagnosed clinically and confirmed by radiographic examination: Bell’s Stage 2 or greater.
i Diagnosed by clinical and confirmed by echcocardiographic criteria.
j Group 1: 1 case with Grade I, 4 cases with Grade II, 13 cases with Grade III+, and 2 cases with Grade IV. Group 2: 3 cases with Grade I, 12 cases with Grade II, 2 cases with Grade III, and 3 cases with Grade III+.
k Diagnosed by positive blood culture.
l Total neonatal complications include anemia, apnea, HMD, BPD, hyperbilirubinemia, hypermagnesemia, hypotension, ICH, NEC, PDA, PPS, pneumothorax, ROP, sepsis, and thrombocytopenia.
m Total nonrespiratory neonatal complications include anemia, hypermagnesemia, hypotension, NEC, ROP, ICH, sepsis, and thrombocytopenia.
Antenatal and neonatal diagnostic and intervention procedures by groupFootnote a

Note
*p < .10; ***p < .01.
a Magnesium sulfate, administered to inhibit preterm labor and/or control seizures in preeclampsia.
b Betamethasone, to promote fetal lung maturation.
c Hours of respiratory support, including mechanical ventilation continuous positive airway pressure, oxyhood, and nasal cannulae oxygen.
Neuropsychological Assessment
Children were evaluated in one or two sessions, depending on the examiner’s evaluation of the child’s attention. The examiners were graduate students trained extensively in developmental neuropsychological assessment. To prevent bias in administration and scoring, they were kept unaware of the child’s perinatal status. All testing and perinatal background data were obtained in compliance with the regulations of the Human Investigation Committee of Wayne State University and of WBH.
Intellectual functioning was assessed using the Wechsler Preschool and Primary Scale of Intelligence–Revised (WPPSI-R; Wechsler, Reference Wechsler1989). Because of time constraints, four of the five subtests from the Verbal IQ (VIQ) subscale (Information, Similarities, Vocabulary, and Comprehension) and four of the five subtests from the Performance IQ (PIQ) subscale (Geometric Design, Mazes, Block Design, and Picture Completion) were administered to each child to obtain estimates of verbal and visual-spatial abilities.
Motor skills were assessed using the Peabody Developmental Motor Scales (PDMS-2; Folio & Fewell, Reference Folio and Fewell2000), based on its widespread use, precise scoring criteria, and large normative, stratified sample (Maring & Elbaum, Reference Maring and Elbaum2007). The PDMS-2 is a comprehensive, standardized measure of gross and fine motor skills that yields quotients for Total, Gross, and Fine Motor (TM, GM, and FM, respectively) scales. GM subtests appropriate for preschoolers include Stationary (equilibrium and balance), Locomotion (crawling, walking, running, hopping, and jumping), and Object Manipulation (catching, throwing, and kicking). FM subtests include Grasping (from one hand grasp to bilateral manipulation) and Visual-Motor Integration (reaching and grasping, building with blocks and copying designs). We used the Preschool Language Scale (PLS-3; Zimmerman, Steiner, & Pond, Reference Zimmerman, Steiner and Pond1992) to assess language skills. The PLS-3, an extensively standardized instrument, includes tasks assessing linguistic skills in the areas of semantics, morphology, syntax, integrative language skills, and preliteracy skills. The test provides scores for Total Language (TL) and subscales assessing receptive and expressive language: Auditory Comprehension (AC) and Expressive Communication (EC).
General Statistical Considerations
In a mixed linear model fitted to the data, gestational maturity (group affiliation) served as the main predictor of interest. The data-analytic procedure may be conceptualized as analysis of covariance (ANCOVA) with a single predictor – the grouping factor – and one or more covariates, as dictated by the relevant objective. The WPPSI-R Full Scale IQ (FSIQ), PIQ, and VIQ were dependent variables in analyses of cognitive outcome. The PDMS-2 TM, FM, and GM quotients were dependent variables in analyses of motor outcome, and the PLS-3 TL, AC, and EC scales were dependent variables in analyses of language outcome. Age was corrected for extent of prematurity in computing test scores.
In analyses of group differences, SES was used as a covariate; correlation between SES and the FSIQ, r(37) = .43, p < .01. In regression analyses examining the contribution of gestational maturity to outcome, both SES and the intrauterine growth z score, defined as the deviation of an infant’s birth weight from the mean weight of his/her gestational age group, according to norms published by Kramer et al. (Reference Kramer, Platt, Wen, Joseph, Allen and Abrahamowicz2001), were included as covariates; correlation of growth z score with the FSIQ, r(37) = .41, p < .01. Perinatal variables on which the groups differed (supplemental oxygen days and number of nonrespiratory neonatal complications excluding ICH) were also included as covariates. Birth weight was not included as a covariate because of its close association with gestational age, r(38) = .75, p < .001. We opted to use supplemental oxygen days rather than ventilation days as a predictor, because the former variable incorporates the latter and is employed in the diagnosis and evaluation of the severity of bronchopulmonary dysplasia (Jobe & Bancalari, Reference Jobe and Bancalari2001, Short et al., Reference Short, Klein, Lewis, Fulton, Eisengart and Kercsmar2003), a chronic lung disease afflicting all our participants (see Table 3). Additional covariates were grade of ICH, ranging from 0 for no hemorrhage to 4 for bilateral Grade IV hemorrhage (Volpe, Reference Volpe2001), and need for postnatal corticosteroid therapy. The grouping variable and six covariates (SES, intrauterine growth, supplemental oxygen requirement, nonrespiratory neonatal complications, ICH grade, and postnatal steroids) were entered simultaneously into the model.
In all analyses, we examined the interactions between group affiliation and the covariates. As none of these interactions were significant (p > .25), we fitted the reduced model without the interactions to the data. To reduce the total number of analyses, group effects on each global outcome index were examined. Significant group differences on the global indices (FSIQ, TM, or TL) were followed by analyses conducted to evaluate group differences on subscales, using the Bonferroni correction (p < .025 per comparison). Group means were substituted for two missing SES values (SES variances did not differ significantly before and after the substitution).
RESULTS
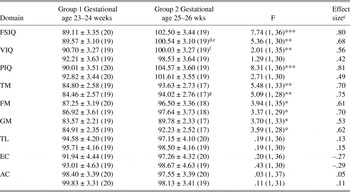
The association between group affiliation and neuropsychological outcome was analyzed using SES as a covariate and included the three cases with CP. Table 5 reveals significant group differences in the FSIQ and PIQ, but not VIQ. Follow-up analyses of PIQ subtests revealed significant group differences on Mazes and Picture Completion (with Bonferroni correction), but not Geometric Design or Block Design, Fs (1, 35) = 14.91, 7.05, 1.27, and 3.73; p < .001, < .012, ns, and ns, respectively. A significant group difference was also found for the TM quotient. No differences were observed on the TL scale. To determine if group differences in means indicated higher rates of poor performance in Group 1, low scores were defined as those >1 SD below normative standards (i.e., scores <85). Using Fisher’s Exact test, Group 1 had higher rates of low scores than Group 2 in FIQ (9 vs. 2 cases, p = .03), TM (10 vs. 2 cases, p = .014), FM (8 vs. 1 cases, p = .02), and GM (9 vs. 1 cases, p = .008).
Adjusted group means (± SE)Footnote a, Footnote b by outcome domain

Note
*p < .10; **p < .05; ***p < .01; **p < .05 (subscale score ns after significance level was set to p < .025 with Bonferroni correction). FSIQ = WPPSI-R Full Scale IQ, VIQ = Verbal IQ, PIQ = Performance IQ, TM = Peabody Developmental Motor Scales (PDMS-2) Total Motor, FM = Fine Motor, GM = Gross Motor, TL = Preschool Language Scale (PLS-3) Total Language, EC = Expressive Communication, AC = Auditory Comprehension, SES = socioeconomic status. Parentheses: number of subjects per group.
a Top rows: group means, for total sample, adjusted for one covariate (SES).
b Bottom rows: group means for sample adjusted for six covariates (SES, intrauterine growth index, supplemental oxygen days, number of nonrespiratory neonatal complications, postnatal corticosteroid therapy, and grade of ICH (intracranial hemorrhage). Ranking system for hemorrhage was based on grade and bilaterality. 0 = no hemorrhage; 0.5 = unilateral Grade I; 1 = bilateral Grade I; 1.5 = unilateral Grade II; 2 = bilateral Grade II; 2.5 = unilateral Grade III; 3 = bilateral Grade III; 3.5 = unilateral Grade IV; 4 = bilateral Grade IV).
c Hedges’ unbiased estimate g (based on adjusted group means and pooled standard deviations).
d A single multivariate outlier identified by SYSTAT with Studentized residual = 3.09 was removed.
e Group comparisons of the FSIQ with all six covariates remain significant when the five abruption cases are excluded from the sample, F(1, 25) = 4.83, p < .04.
f A single multivariate outlier identified by SYSTAT, with a Sudentized residual of –3.04, was removed from analysis.
g Group comparisons of the Total Motor quotient with all six covariates remain significant when the five abruption cases are excluded from the sample, F(1, 23) = 4.31, p < .05).
Responses from the 37 parents who provided relevant data in background information surveys revealed that more children in Group 1 used special education services [12 out of 19 vs. 3 out of 17, for Group 1 vs. Group 2, respectively; Yates corrected χ2 (1) = 5.88, p < .02]. The group difference in the use of speech therapy was not significant [8 out of 19 vs. 3 out of 17, for Group 1 vs. Group 2, respectively; Yates corrected χ2 (1) = 1.80, p < .18].
To evaluate the unique contribution of gestational age at the threshold of viability to outcome variance, the associations between group affiliation and intellectual, motor, and language outcomes were examined using five covariates in addition to SES: supplemental oxygen days, ICH grade, postnatal steroid therapy, number of nonrespiratory complications, and the intrauterine growth z score. Furthermore, one of three CP cases with a VIQ within the range of moderate mental retardation was excluded from intellectual and language outcome analyses. Similarly, a low FM score for one child with CP who was able to complete partial motor testing was excluded from analyses of motor outcome. As Table 5 reveals, after accounting for the six covariates, the relationship between group affiliation and FSIQ remained significant (distribution and adjusted means are depicted in Figure 1). Neither PIQ nor VIQ was significantly related to group affiliation. There was a significant relationship between group affiliation and TM (see Figure 2), but not TL, with nonsignificant trends for relationships with GM and FM. Examination of covariates’ contribution revealed that SES was a significant predictor (p < .05) of FIQ, PIQ, TM, and GM; whereas nonrespiratory complications predicted PIQ, GM, and TL; intrauterine growth z score predicted FIQ and PIQ; and postnatal steroids predicted TM and GM.
The unadjusted FSIQ (WPPSI-R Full Scale IQ), scores for the groups with shorter (1) and longer (2) gestation. The SES (socioeconomic status) adjusted means (± SE) for the shorter and longer gestation groups were 89.11 ± 3.35 versus 102.50 ± 3.44 points, respectively (thick lines). The means adjusted for SES (± SE), supplemental oxygen days, number of (nonrespiratory) neonatal complications, intrauterine growth, ICH (intracranial hemorrhage) grade, and neonatal corticosteroid therapy were 89.57 ± 3.10 versus 100.54 ± 3.10, respectively (thin lines).

The unadjusted Total Motor Quotient scores for the groups with shorter (1) and longer (2) gestation. The SES adjusted means (± SE) were 84.80 ± 2.58 versus 93.63 ± 2.73 points, respectively (thick lines). The means (± SE) adjusted for SES, supplemental oxygen days, number of (nonrespiratory) neonatal complications, intrauterine growth, ICH grade, and neonatal corticosteroid therapy were 84.46 ± 2.57 versus 94.02 ± 2.76, respectively (thin lines). The outlier in Group 2 did not retain this status once the scores were adjusted for SES and was thus retained in the analyses.

DISCUSSION
Our first objective was to establish neuropsychological outcome differences between groups of preschoolers with a history of extreme prematurity born at versus just above the viability limit. We found that the addition of two weeks’ gestation was accompanied by a significant advantage in neuropsychological functioning, as well as lower rates of low scores in global intelligence and motor skills and lower rates of placements in special education programs. Gestational maturity accounted for differences in global intelligence, visuospatial skills, and global motor skills within our EP sample. For these domains, group differences ranged from .70 to .81 standard deviations, despite the restriction on the gestational age range that resulted from our exclusive focus on extreme prematurity. Notwithstanding these group differences, the range and dispersion of scores on outcome measures (see figures) underscore the considerable variability in outcomes for EP infants. Examination of the nonsignificant trends displayed in Table 5 suggests that a larger sample may have been needed to establish differences in group means on verbal intelligence and fine motor and gross motor skills. Interestingly, differences in language skills and in use of speech and language therapy services were small. Perhaps disparities in language performance are more difficult to demonstrate in middle class strata, where mild impairments are addressed at an early age. In our sample, about 30% of the children had been receiving speech therapy prior to school age. Another possibility is that the subtle language deficits typically found in very preterm children (Aylward, Reference Aylward2002) are more easily demonstrated at school age, when complex language functions are required for academic success.
Our findings may be viewed as only partly consistent with those of Anderson and Doyle (Reference Anderson and Doyle2004, Reference Anderson and Doyle2008) who, though unable to detect significant group differences in IQ within their EP sample, reported that children with lower gestation age (23–25 weeks group) tended to have lower scores on all cognitive parameters compared to those with higher gestation age (26–27 weeks group). Almost half of the EP sample studied by Anderson and Doyle included children from low SES strata, and only 48% of the mothers completed 12 years of education or more. In contrast, our sample, though smaller, was more homogeneous and comprised of children from middle class strata, with the median maternal education being 16 years. The low level of environmental risk and homogeneity of the sample may have facilitated detection of group differences.
Despite the high risk associated with extreme prematurity, mean global intellectual abilities (corrected for prematurity) for this middle-class sample of preschoolers fell within the average range for Group 2, and within the upper end of the low average range for Group 1, whose estimated gestational age was at the very threshold of viability. These findings cannot be easily explained by rising IQ scores since the standardization of the WPPSI-R (Flynn, Reference Flynn1987), as the differences between mean composite scores on the WPPSI-III and WPPSI-R are small (0.4 points for the VIQ, 3.1 points for the PIQ, and 1.2 points for the FSIQ), and only the difference between the PIQ’s is significant (Coalson & Spruill, Reference Coalson, Spruill, Bracken and Nagle2007).
The second goal of the current study entailed exploration of the unique contribution of gestational age to explaining outcome variance among EP children. Even after statistical adjustment for variance associated with ante-, peri-, and post-natal risk, significant group differences were found in global intelligence and motor skills. A mean discrepancy of only two weeks’ gestation at the threshold of viability accounted for a unique portion of the outcome variance and was associated with group differences of .68 and .75 of a standard deviation on the FSIQ and TM, respectively, in favor of the EP group with longer gestation. The group with shorter gestation also obtained nonsignificantly lower scores on all other measures.
Little is known about the biological mechanisms underlying the association between compromised neurodevelopmental outcome and disruption of maturation during a developmental period labeled the “gray zone” of viability (Singh et al., Reference Singh, Fanaroff, Andrews, Caldarelli, Lagatta and Plesha-Troyke2007). Subramanian (Reference Subramanian, Kurjak and Chervenak2006) characterized this period as a natural barrier determined by “physiological and anatomical limits of lung development and extrauterine survival” (p. 214). Recent efforts to identify the neural substrates of impairments associated with disrupted maturation have focused on high resolution brain imaging acquired at term-equivalent age in very preterm-birth cohorts (e.g., Horsch et al., Reference Horsch, Hallberg, Leifsdottir, Skiold, Nagy and Mosskin2007; Inder et al., Reference Inder, Wells, Mogridge, Spencer and Volpe2003; Maalouf et al., Reference Maalouf, Duggan, Rutherford, Counsell, Fletcher and Battin1999; Woodward et al., Reference Woodward, Anderson, Austin, Howard and Inder2006); these follow-up investigations revealed predominance of white matter damage in this high-risk population.
Inder et al. (Reference Inder, Wells, Mogridge, Spencer and Volpe2003) reported that noncystic injury to the white matter was common in 100 very low birth weight infants (23–32 weeks’ gestation). Interestingly, a distinct pattern of correlated white matter–gray matter abnormalities was demonstrated in a subgroup of EP infants < 26 weeks’ gestation. The former abnormality was characterized by ventriculomegaly and white-matter loss without cystic white-matter injury, whereas the latter was characterized by marked enlargement of the subarachnoid space and immature gyral development. Woodward et al. (Reference Woodward, Anderson, Austin, Howard and Inder2006) also reported that white and gray matter abnormalities were highly correlated in a sample of 167 very preterm infants (<30 weeks’ gestation), yet white matter abnormalities were more strongly associated with cognitive and motor delay (and CP) at the age of two years. Such associations may be interpreted in light of recent findings that implicate myelin in cognitive function and illuminate its underappreciated role in information processing and learning (Fields, Reference Fields2008).
Ajayi-Obe, Saeed, Cowan, Rutherford, & Edwards (Reference Ajayi-Obe, Saeed, Cowan, Rutherford and Edwards2000) found that in comparison to term-birth controls, their 14 very preterm cases (<30 weeks’ gestation) had reduced cortical surface area and a simplified cortical convolutional pattern, without major white matter damage. They proposed that the reduced cortical development in this high-risk group could occur secondary to subtle damage to white matter, thalami, or germinal zones. Indeed, the findings that periventricular leukomalacia in the preterm infant is followed by reduction in cortical gray matter at term-equivalent raises the possibility that white matter damage has a deleterious effect on subsequent cerebral cortical development (Inder et al., Reference Inder, Huppi, Warfield, Kikinis, Zientara and Barnes1999). Furthermore, it is likely that these correlated abnormalities tend to become more prominent with decrease in gestational age, even within the restricted gestational age range of the EP population. Ajayi-Obe et al. (Reference Ajayi-Obe, Saeed, Cowan, Rutherford and Edwards2000) further speculated that the neurodevelopmental deficits, often observed in the very premature infant, are the result of the permanent effects on the brain of chronic hypoxia, reduced level of nutrients, or infections that occur during a critical maturational period and disrupt developmental processes that continue after the completion of neuronal migration. Such processes include glial migration, growth in cortical connections, and increase in cortical surface area. Indeed, recently it has been argued that the mechanism accounting for white matter damage in infants delivered during the second trimester involves the innate and adaptive immune systems reinforcing each other, thereby providing enhanced and sustained inflammatory response, perhaps persisting postnatally (Dammann, Leviton, Gappa, & Dammann, Reference Dammann, Leviton, Gappa and Dammann2005; Leviton, Dammann, & Durum, Reference Leviton, Dammann and Durum2005b). This inflammatory response involves activation of T lymphocytes, which, in turn, produce Interleukin-2 (IL-2), a cytokine that is toxic to oligodendrocytes and myelin (Leviton et al., Reference Leviton, Dammann and Durum2005b).
Leviton and colleagues (Reference Leviton, Blair, Dammann and Allred2005a) examined the significance of gestational age as a multifaceted construct. They proposed that this developmental index incorporates information about mediators of preterm birth, availability of protective substances to preserve “well-being,” structural vulnerability to disruption of developmentally regulated processes, and postnatal physiologic instability. Teasing apart the multiple sources of variance tapped by the variable “gestational age” remains a difficult goal, particularly in view of the association of more extreme prematurity with a high prevalence of neonatal complications. In this investigation, we were able to show that gestational age accounted for a unique portion of the variance in global intelligence and motor skills in preschoolers born EP, after statistical adjustment for multiple ante-, peri-, and neonatal sources of variance.
Dammann et al. (Reference Dammann, Leviton, Gappa and Dammann2005) argued that the causes of preterm labor (prelabor rupture of membranes, pregnancy induced hypertension, placental abruption) may be associated with differential exposure to perinatal infection/inflammation and thereby to differential vulnerability of the brain to white-matter damage. Consequently, various EP subgroups may be differentially vulnerable to neurodevelopmental deficits. A larger sample may permit further identification and partitioning of the separate sources of variance associated with the multiple etiologies of premature birth and with perinatal complications other than those examined in the current study. Furthermore, a large sample will be required to ensure that the results generalize to EP populations not represented in this study, whereas a term-birth control group would permit comparison with normative expectations. Nonetheless, our study constitutes an attempt to examine neuropsychological outcome correlates of extreme gestational immaturity at birth as an expression of central nervous system vulnerability to disruption of developmentally regulated processes.
ACKNOWLEDGMENTS
The authors would like to thank Tammy Swails, Amanda Schumaker, Jacquie Perry, and Sarah Meachen for their help in data collection. The testing of the subjects was funded in part by the Merrill Palmer Skillman Institute.