1. Introduction
In conjoint survey experiments, respondents are asked to evaluate hypothetical profiles comprised of multiple attributes. Such designs allow researchers to evaluate trade-offs, and so have been used to understand decision-making in fields including marketing (Green and Rao Reference Green and Rao1971), economics (Adamowicz et al. Reference Adamowicz, Boxall, Williams and Louviere1998), and sociology (Jasso and Rossi Reference Jasso and Rossi1977). In recent years, the increasing use of computers to administer surveys has helped fuel an increase in conjoint experiments, especially in political science (Hainmueller et al. Reference Hainmueller, Hopkins and Yamamoto2014).Footnote 1
Despite this newfound interest, researchers have paid little attention to questions about how to optimally design conjoint surveys given well-known challenges in survey research. According to studies on survey-taking, tasks that involve high levels of cognitive effort are more likely to induce respondents to satisfice, meaning that they adapt by using cognitive shortcuts (Krosnick Reference Krosnick1999). Survey satisficing manifests itself in various behaviors that diminish response quality: satisficing respondents are more likely to rush through surveys, ignore or skip instructions, choose response options based on their placement, and use other effort-saving heuristics (Berinsky et al. Reference Berinsky, Margolis and Sances2014). Conjoint experiments often present respondents with extensive information, making concerns about satisficing particularly acute.
Here, we draw on research on survey methodology to investigate a key question in designing conjoint experiments: how many attributes can researchers include in a given profile before survey satisficing degrades response quality? Specifically, we conduct a series of survey experiments to investigate the degree of satisficing when respondents are faced with varying numbers of attributes. Due to what we term the masking-satisficing trade-off , researchers cannot always minimize satisficing without potential side-effects. In typical applications of conjoint analysis, researchers are interested in estimands that represent effects of attributes on conjoint responses, such as the Average Marginal Component Effect (AMCE) (Hainmueller et al. Reference Hainmueller, Hopkins and Yamamoto2014). Interpreting such estimands requires care because of their dependence on the entire set of attributes included in the experiment. For respondents, perceptions of one attribute are often linked to perceptions of others. Without information on the full set of relevant attributes, estimates of an AMCE of interest may be masking the effects of other, correlated attributes (see also Dafoe et al. Reference Dafoe, Zhang and Caughey2018).
Because of concerns about masking and satisficing, researchers often face a binding trade-off when designing conjoint experiments. If they include too few attributes, their quantities of interest could mask the effects of other, omitted attributes. In that case, there is a likely gap between the quantity of theoretical interest and the quantity researchers can estimate. But if researchers include too many attributes, they may encourage survey respondents to develop time-saving shortcuts that reduce the thoughtfulness of their responses. That, too, may lead the empirically observable quantities to diverge from those of theoretical interest.
The relationship between masking and satisficing poses an empirical challenge as well. How can we identify the change in satisficing across the varying number of attributes while holding the degree of masking—and thus the underlying causal quantities estimated from the experiments—constant? If we were to randomly assign respondents to different numbers of meaningful attributes, we would risk conflating the effects of masking and satisficing, as any change in response patterns could be a product of the number of attributes or the changed information provided by the additional attributes. To overcome this challenge, we develop a novel, two-stage research design which enables us to isolate the effect of survey satisficing empirically, and we deploy our pre-registered design in two substantive domains. Specifically, we consider how American survey respondents—recruited via Amazon's Mechanical Turk (MT) or Survey Sampling International (SSI)—choose between hypothetical candidates for the US Senate (Study 1) and hotel stay packages (Study 2).
In the studies' first stages, we identify attributes which are unassociated with the core attributes of interest by asking respondents to guess those attributes' values conditional on the core attribute values. For example, partisan affiliation is a core attribute of interest in study 1. Accordingly, we first provide respondents with basic information about hypothetical candidates' party affiliation and other attributes of interest and then ask them to guess about several additional attributes, such as the name of the candidate's elementary school. By doing so, we can identify “filler attributes” about which the core attributes provide no information—either for the full sample or for various subsamples—and thus whose effects are unlikely to be masked by the effects of the core attributes. In the second stage, we then randomly assign survey respondents to varying numbers of filler attributes. By design, the core attributes of interest are not predictive of these filler attributes, meaning that changes in the core attributes' effects are primarily due to the increased cognitive burden from the filler attributes.
Overall, our results demonstrate the robustness of conjoint experiments even for a large number of attributes, and so prove encouraging for their future use. There is a detectable but modest decline in overall predictive power as the number of filler attributes increases, one that is slightly more pronounced for SSI respondents. Even with as many as 35 filler attributes, respondents recruited through MT and SSI provide meaningful responses, making steady use of core attributes such as the candidate's policy positions and views from the hotel room.
With these populations at least, conjoint designs are surprisingly robust to the inclusion of many filler attributes. With respect to the number of attributes, the “breaking points” of conjoint survey experiments appear to be outside the range of current practice. Beyond conjoint designs specifically, these results also speak to questions about the use of opt-in samples in survey research as well as effort and attention in survey-taking generally (Yeager et al. Reference Yeager, Krosnick, Chang, Javitz, Levendusky, Simpser and Wang2011; Berinsky et al. Reference Berinsky, Huber and Lenz2012; Mullinix et al. Reference Mullinix, Leeper, Druckman and Freese2016), points to which we return in the conclusion.
2. Task difficulty and the masking-satisficing trade-off
Although conjoint experiments are a variant of survey research, researchers have yet to incorporate insights from research on survey methodology (e.g. Sudman et al. Reference Sudman, Bradburn and Schwarz1996; Krosnick Reference Krosnick1999; Groves et al. Reference Groves, Fowler, Couper, Lepkowski, Singer and Tourangeau2011) when considering optimal conjoint designs. In this section, we explain the masking-satisficing trade-off before developing expectations about how respondents are likely to approach conjoint experiments given prior research on survey design.
The trade-off between masking and task difficulty presents a key challenge. An important strength of conjoint designs is their capacity to include a variety of attributes simultaneously so as to examine their relative importance. Including many attributes can also help to limit the potential problem of masking (Hainmueller et al. Reference Hainmueller, Hopkins and Yamamoto2014). The more attributes one includes within a conjoint task, the less likely it is that responses to the attribute(s) of interest will be partially driven by their perceived correlation with other, excluded attributes. Yet by including large numbers of attributes, researchers also increase the difficulty of the task, and thus risk inducing survey satisficing (Krosnick Reference Krosnick1999). Our discussion below highlights this important but under-scrutinized dilemma.
2.1. Masking
Masking can occur if people's perceptions of an attribute of interest are correlated with their perceptions about other attributes that are not included in the conjoint. For example, imagine that a researcher is interested in the role of partisanship in explaining vote choice, and she/he employs a fully randomized conjoint design that includes the party of the candidate as one attribute in the conjoint table. Given the assumptions detailed in Hainmueller et al. (Reference Hainmueller, Hopkins and Yamamoto2014), she/he can recover a valid causal estimate for the AMCE of party. Yet this AMCE is defined with respect to the other attributes that appeared alongside partisanship, and so can change as those attributes do (Hainmueller et al. Reference Hainmueller, Hopkins and Yamamoto2014). For example, if voters use partisanship partly as a proxy for issue positions, the AMCE for partisanship is likely to be smaller when the conjoint tables include extensive information about candidates' issue positions.
More generally, masking occurs when respondents perceive a correlation between an included attribute A and an excluded but influential attribute B. When B is excluded respondents may use A as a proxy for B, but if B is included they might instead decide using B and render A irrelevant. As a result, the AMCEs of A differ between designs where B is excluded or included.Footnote 2 It is important to recognize that masking is distinct from omitted variable bias in that an estimate of an effect might be masking another while remaining a valid causal estimate. In the presence of masking, it is not that the researcher is getting an incorrect answer so much as she/he is asking a different question. If B is omitted, researchers get a valid estimate of the AMCE of A defined as the causal effect of A conditional on the design excluding B. If B is included, researchers still recover a valid estimate of A's AMCE, but that AMCE has a different meaning because it is now defined as the causal effect of A conditional on the design including B. This variability in the AMCEs stems from the conditional nature of these causal effects: the AMCEs are, by definition, functions of the whole set of attributes included in the design as well as their joint assignment distribution (Hainmueller et al. Reference Hainmueller, Hopkins and Yamamoto2014). In online Supplementary Appendix A.1 we provide a formal definition of masking.
2.2. The masking-satisficing trade-off
Researchers using conjoints therefore have to decide which AMCEs they are interested in and choose the other included attributes accordingly. Now assume a set-up where a researcher has one or multiple core attributes that they care about and the goal is to isolate the effects of these core attributes from effects of other attributes that are potentially perceived to be associated with the core attributes. In this set-up the researcher has an incentive to include a large number of potentially associated attributes in the conjoint table to limit the possibility of masking.
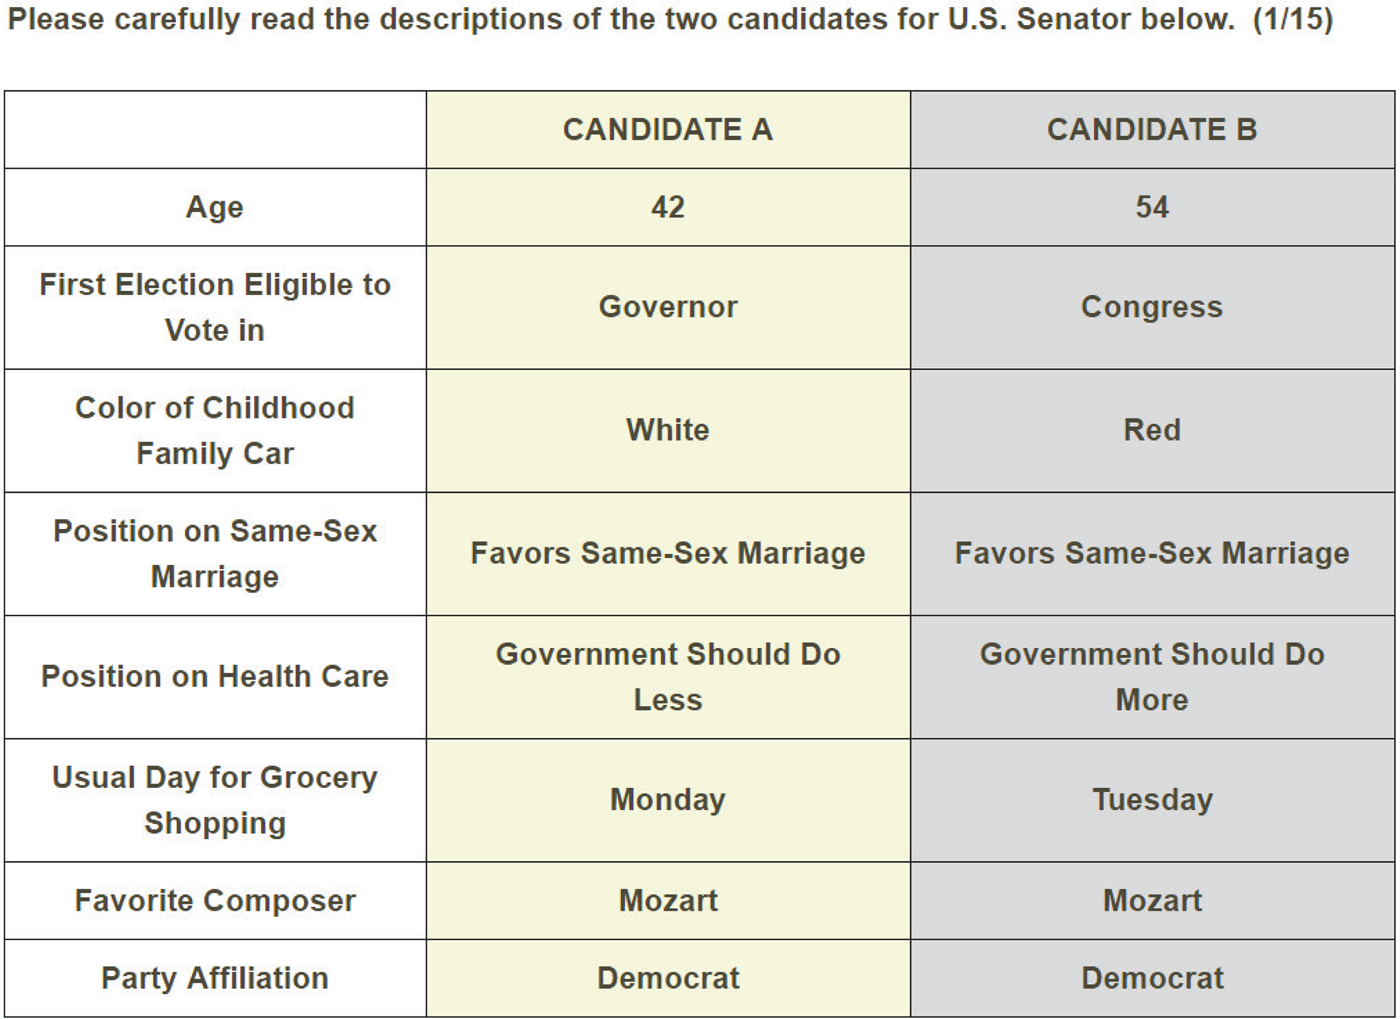
To fix ideas, Figure 1 illustrates a sample conjoint task from Study 1. In it, respondents choose between two hypothetical Senate candidates. Imagine the researcher is interested in isolating the effect of party from other attributes that are perceived to be correlated with party. If voters place considerable weight on candidates' gay marriage stances, they may use partisanship to approximate those stances when they are absent. Accordingly, researchers can reduce masking by providing information about candidates' issue positions. More generally, if the researcher's goal were simply to reduce masking without other constraints, she/he would provide full information to respondents, and so recover the precise effect of interest. In general, we should expect masking to decline as the number of attributes rises, with the extent of the decline depending on the perceived correlations among attributes.
An example table from a typical conjoint experiment.

However, as more attributes are added to the conjoint table, the task becomes more difficult for respondents. People can only hold so much information in working memory, and the upper bound is thought to be around nine pieces of information (Miller Reference Miller1994). To ask respondents to process 20 pieces of information per candidate is likely to encourage them to adopt effort-saving cognitive strategies that ignore some of the information and so degrade response quality (Krosnick Reference Krosnick1991; Mutz Reference Mutz2011). In other words, including too many attributes may induce excessive survey satisficing, and so compromise the quality of survey responses. Note that excessive survey satisficing can also change the estimated AMCEs. For example, we would expect the AMCE estimates to be biased towards zero if survey satisficing means that some respondents no longer pay attention to the attribute values. For a more formal discussion, see online Supplementary Appendix A.1.
This fundamental tension is what we term the masking-satisficing trade-off: The goal to reduce masking pulls researchers to include many attributes in the conjoint, while the goal to reduce survey satisficing pulls researchers to include only a minimal number of attributes in the conjoint. But despite the importance of the masking-satisficing trade-off for the design of conjoint experiments, we know very little about just how severe this tradeoff is empirically. In particular, we do not know whether this trade-off is binding given the number of attributes researchers commonly employ. One reason for this is that it is difficult to examine the tradeoff empirically because we need to have a design that allows us to distinguish changes in the AMCEs that result from satisficing rather than masking. Below, we present a research design which enables us to assess these trade-offs empirically.
3. Study design
Here, we use a novel, two-stage study design to investigate how many attributes one can include in conjoint profiles without making respondents' evaluations overly prone to satisficing. A major challenge in doing so is the difficulty of distinguishing satisficing from other changes due to the increased number of attributes. Indeed, the same problem that motivates our question—the potential trade-off between masking and satisficing—also presents a problem to straightforward research designs which might address it. Imagine that we are interested in the effect of candidates' party alignments on support for those candidates. We might develop a list of attributes that are likely to influence candidate choice and then randomly assign respondents to conjoint tasks with varying numbers of attributes. Yet in such a design, respondents in different experimental conditions will differ in multiple ways: they see different numbers of attributes and have different types of information. As a result, if the attribute of interest has a perceived correlation with the marginal attribute, the AMCE could change due to masking rather than satisficing.
To isolate the effect of satisficing, we employ a two-stage research design. The goal of the first stage is to identify attributes whose effects are known to not be masked by those of the attributes of interest. Those “filler attributes” are then used in our second stage to identify the change in the explanatory power of the main attributes as the overall number of attributes increases.
3.1. The first stage: validating filler attributes
The study design begins by choosing a set of “core” attributes of interest whose effects on respondent preferences will be measured. In both studies, we designate four core attributes. As described above, we investigate the extent to which adding “filler” attributes to the conjoint design leads to satisficing and so changes the effects of the core attributes. To ensure that such a change is the result of satisficing rather than masking, the study's first stage identifies filler attributes that have no perceived correlation with the core attributes.
Specifically, the first stage entails a survey experiment in which we ask respondents to guess about prospective filler attributes based on the core attributes' levels. If respondents are unable to guess the values of a filler attribute based on the core attribute values, that indicates that they do not perceive a meaningful association between the attributes. Since masking occurs because of the perceived association between the attribute of interest and the omitted attribute, the filler attributes that respondents do not perceive to be associated with any of the core attributes are unlikely to cause masking and are therefore suitable for use in our second stage, in which we vary the number of filler attributes. In Online Appendix A.1, we formalize the conditions under which no masking would occur and discuss how our study design relates to those conditions.Footnote 3 Importantly, under our assumptions, filler attributes can have independent effects on the outcome so long as they are not perceived to be associated with the core attributes of interest.
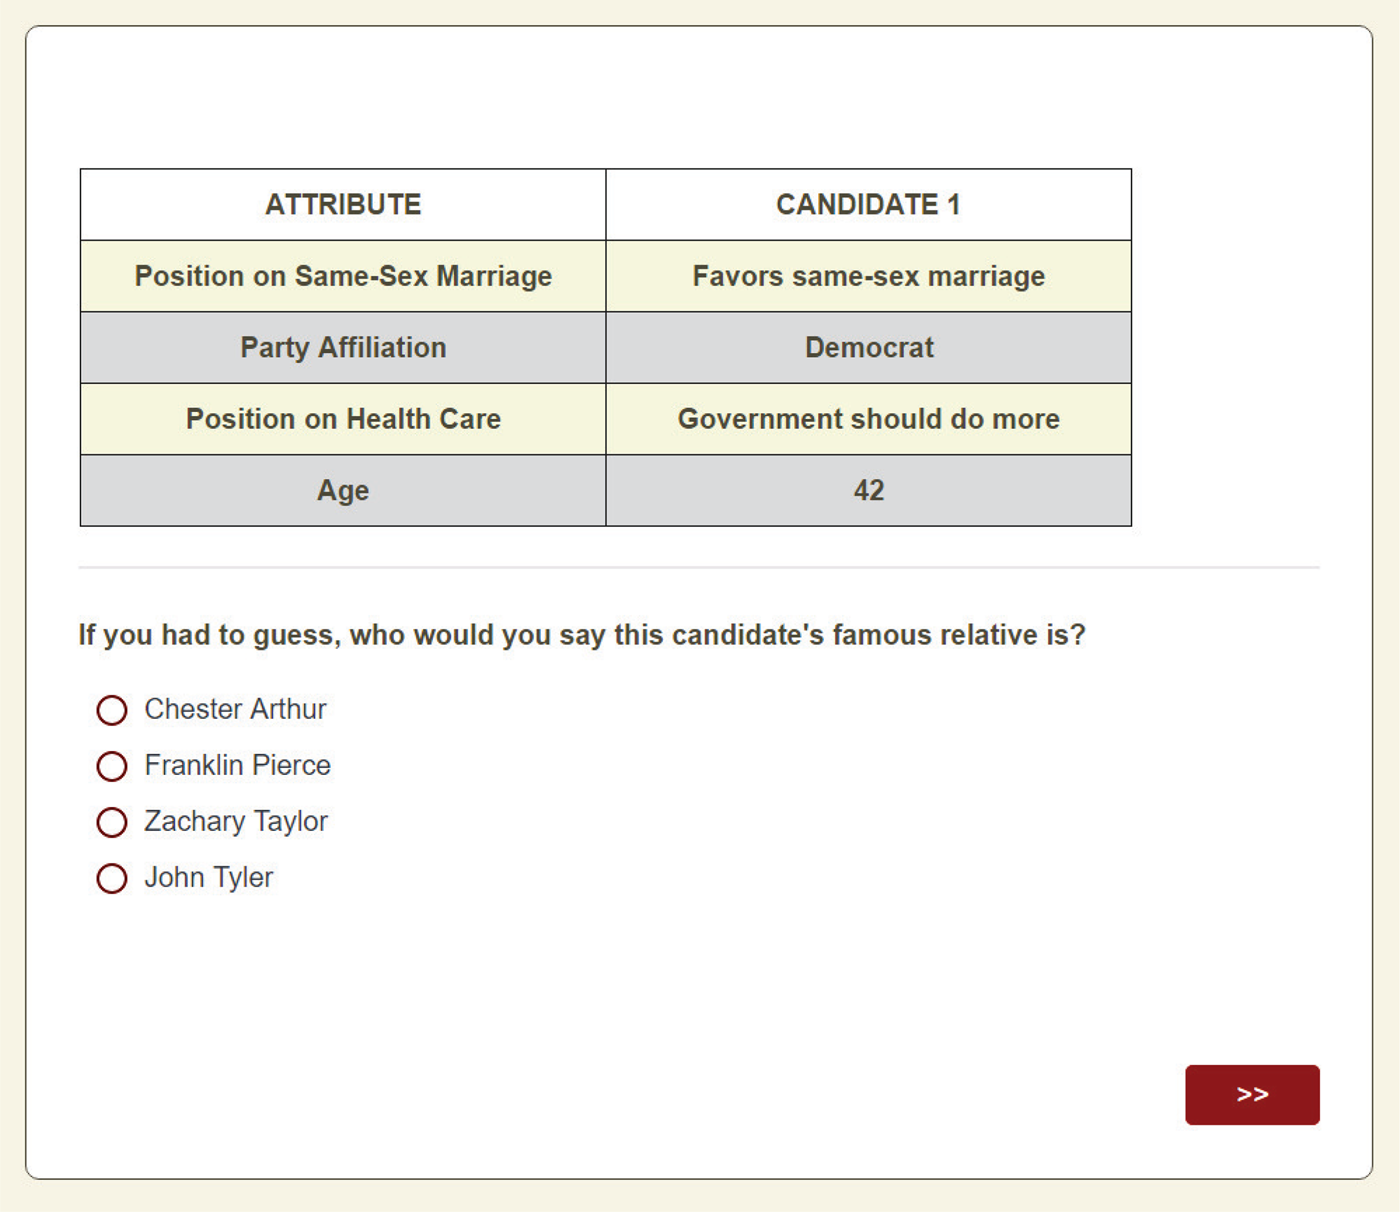
The first-stage experiment proceeds as follows. We first present respondents with tasks like that pictured in Figure 2. In each task, we present respondents with a profile comprised of randomly selected values for the four core attributes. The order of the attributes is also randomized and then fixed for each respondent. Given the attribute values in the profile, respondents are asked to guess the values of other, unobserved attributes. In some cases, respondents might perceive the unobserved attributes as correlated with the observed attributes: respondents who saw a Democratic candidate might be more likely to guess that the candidate was a high school teacher than a business owner. But in other cases, there is little reason to expect a correlation, and the guesses should be unrelated to the profile attributes. For instance, whether a hypothetical candidate supports or opposes same-sex marriage tells respondents nothing about which 19th-century president is her/his relative. If there is no perceived association, the potentially irrelevant attribute cannot be masked by the attribute of interest. For a given, randomly generated profile, each respondent goes through all of the filler attributes in this manner in a randomized order. The task is repeated several times for each respondent, with a new set of core attribute levels in each task.
An example task from Study 1, first stage. Respondents are asked to guess at the value of a potential filler attribute given the values of four attributes of interest.

To evaluate the perceived association between each filler attribute and the core attributes—that is, to assess whether the core attributes were predictive of respondents' expectations regarding the filler attributes—we employed a set of linear regressions. Specifically, each filler attribute was subjected to all possible dichotomizations given its number of levels. For a two-level attribute, only one dichotomization is possible, while for three- and four-level attributes, three and seven dichotomizations are possible, respectively. For each dichotomization, the dichotomized filler attribute was regressed on indicators for all four core attributes, resulting in a set of difference-in-means estimates.Footnote 4 Given the binary dependent variable specification, each difference-in-means estimate corresponds to a change in probability. For each filler attribute, we then evaluated the full set of difference-in-means estimates for all filler attribute dichotomizations and all core attribute indicator variables. Finally, we classified the attribute as “uncorrelated” if none of the difference-in-means estimates for that attribute exceeded the threshold of 7 percentage points.Footnote 5 Although this threshold is somewhat arbitrary, it does not undermine the statistical validity of second-stage results since no data from the second stage was available when making those decisions.Footnote 6
We note that these tests focus on whether the core attributes are correlated with the expected filler attributes on average. In Online Appendix A.6, we also conduct further (non-prespecified) tests to examine the potential for heterogeneity across respondents in the perceived associations that could give rise to more complex forms of masking. For example, we examine whether there is heterogeneity in the predictive power of the core attributes regarding the expected filler attributes across different types of respondents as stratified by party, income, gender, or age. The results from these additional tests support the notion that the uncorrelated filler attributes fail to meet the conditions required for their effects being masked by the effects of the core attributes.Footnote 7
3.2. The second stage: identifying satisficing due to task difficulty
In the second stage, respondents are presented with pairs of conjoint profiles—of hypothetical political candidates in Study 1 and hypothetical hotel room packages in Study 2—and asked to evaluate them. For instance, in Study 1, respondents are shown pairs of candidates for US Senate and asked to choose their preferred candidate as well as rate each individual candidate. In this second stage, our goal is to assess how respondents' evaluations of the profiles change as the profiles contain increasing numbers of attributes.
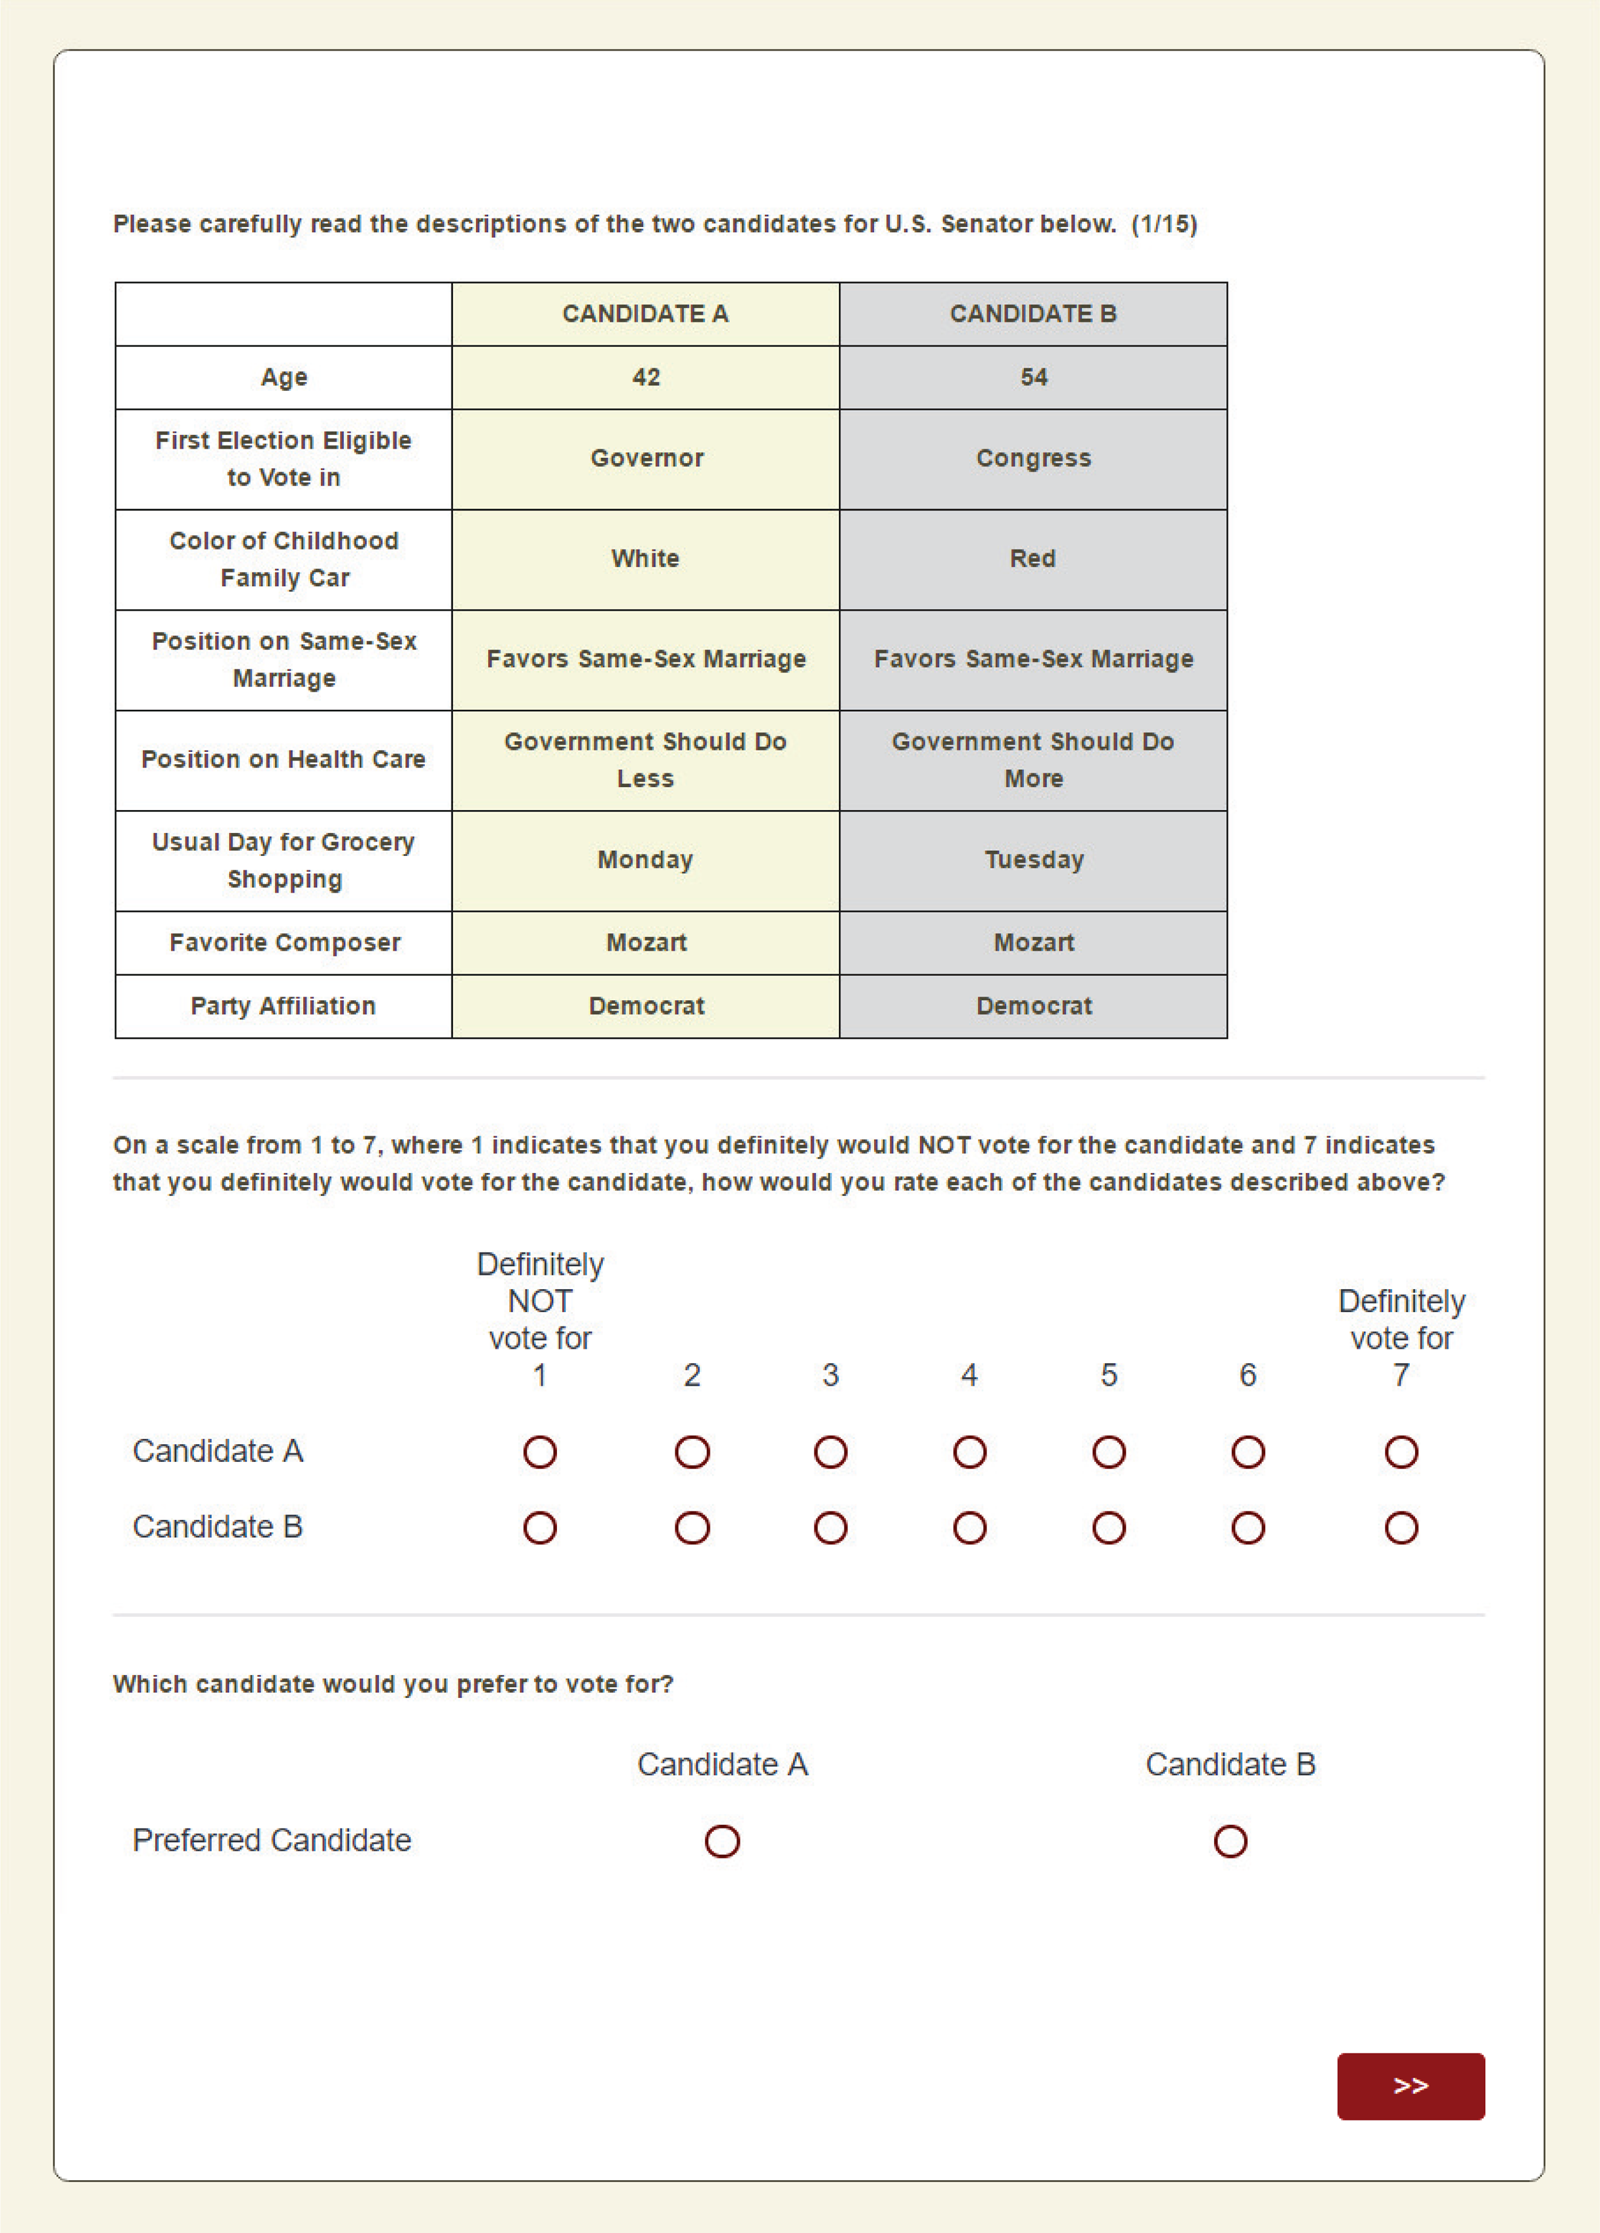
The results of the first stage allow us to identify uncorrelated filler attributes for use in the second stage. With that identified pool of uncorrelated filler attributes, we randomly assign respondents to different numbers of filler attributes so as to vary task difficulty. The four core attributes are always included in the profiles and randomly interspersed with any filler attributes. The example in Figure 3 illustrates the case where four fillers are included in Study 1.
An example task from Study 1, second stage. Respondents are asked to assess two hypothetical candidates for US Senate.

As the number of filler attributes increases and the conjoint task becomes more demanding, do respondents adapt by providing less thoughtful responses? Our expectation is that any increased survey satisficing will induce respondents to pay less attention to the task, and so will attenuate the predictive power of the core attributes. We employ two measures of attributes' predictive power. First, we estimate the AMCEs of the core attributes and compare the estimates across the different numbers of filler attributes. Since our filler attributes are unassociated with the core attributes by design, adding any of those filler attributes should not change the AMCEs of the core attributes due to masking. Instead, changes in the effects of the core attributes should be the result of increased survey satisficing due to the increased number of attributes.
Second, we calculate the coefficient of determination (i.e. R 2) from regressions of the conjoint responses on the four core attributes,Footnote 8 and compare those R 2s across the experimental conditions. Again, because the omission of unassociated filler attributes should not change the core attributes' AMCEs due to masking, and because R 2 is a function of the regression-based estimates of the AMCEs, changes in the R 2 across the experimental conditions can be attributed to changes in satisficing. Note that the population value of this R 2 is equivalent to the partial coefficient of determination (i.e. partial R 2) for the core attributes from the “global” population regression of conjoint responses on the full set of attributes when the core and filler attributes are independently randomized. This implies that the R 2 can be interpreted as a summary measure of the explanatory power of all the four core attributes combined, and its change as the overall variation in satisficing due to the addition of filler attributes.
4. Results
We implement our two-stage design in studies of two separate domains. The first considers choices among political candidates, as respondents are asked to choose between pairs of hypothetical candidates and to rate each candidate. In political science, analyzing candidate choice has been one of the most common uses of conjoint experiments (e.g. Loewen et al. Reference Loewen, Rubenson and Spirling2012; Franchino and Zucchini Reference Franchino and Zucchini2014; Hainmueller et al. Reference Hainmueller, Hopkins and Yamamoto2014; Abrajano et al. Reference Abrajano, Elmendorf and Quinn2015; Carlson Reference Carlson2015; Carnes and Lupu Reference Carnes and Lupu2015; Crowder-Meyer et al. Reference Crowder-Meyer, Gadarian, Trounstine and Vue2015). The second study asks respondents to choose between and rate hotel room packages. We choose this topic partly because it was used in a celebrated, early application of conjoint analysis (Goldberg et al. Reference Goldberg, Green and Wind1984).
Another key difference between Study 1 and 2 concerns the nature of the filler attributes. In Study 1, we use filler attributes that are unlikely to have independent effects on respondents' evaluations of political candidates (e.g. name of famous relative), meaning that they will not have any informational value for respondents. In contrast, Study 2 uses filler attributes that are more clearly meaningful and can plausibly drive responses in either a positive or negative direction (e.g. material in bed pillows). While the Study 1 fillers merely introduce irrelevant information that respondents must sift through, the Study 2 fillers add potentially meaningful information that respondents must weigh. Our expectation is that the latter set of filler attributes will induce more cognitive burden and lead to heightened satisficing. Specific procedures for both stages of both studies, as well as plans for our statistical analysis, were pre-registered at the Political Science Registered Studies Dataverse prior to launching the study.Footnote 9
4.1. Study 1: political candidates
In Study 1, we investigate how the proliferation of irrelevant attributes affects the predictive power of candidates' core attributes. The core attributes for this study are candidates' party affiliation (Republican or Democratic), position on same-sex marriage (favor or oppose), position on health care (government should do more or less), and age (42, 54 or 72). To assess prospective filler attributes, we start with a list of candidate attributes that we expect to have no perceived correlation with the core attributes and often no effect on overall evaluations. We also include a number of attributes that we do expect to have varying degrees of perceived association with the core attributes to enable validity checks (e.g. ideology). The complete list of filler attributes is in Table A.1 in Online Appendix A.2.
The first-stage survey experiment was administered to 2,489 respondents recruited through MT on September 20, 2016. We chose MT because of its increasing popularity as a platform for conjoint experiments in the social sciences as well as its fast turnaround. While MT respondents are known to differ from population-based samples in important respects, they are an accessible, attentive population that is frequently employed in experimental research (Berinsky et al. Reference Berinsky, Huber and Lenz2012; Huff and Tingley Reference Huff and Tingley2014; Hauser and Schwarz Reference Hauser and Schwarz2015; Mullinix et al. Reference Mullinix, Leeper, Druckman and Freese2016). For improved external validity, we also replicate the second stage of the study with SSI, another popular population for survey experiments. As detailed in Online Appendix A.2, our first-stage experiment identified five of the 16 tested attributes as filler attributes that are perceived to be uncorrelated with any of the core attributes.
In the second-stage experiments, respondents were shown pairs of candidates for US Senate and asked to choose their preferred candidate as well as rate each individual candidate. We randomly assign respondents to different numbers of filler attributes so as to vary task difficulty; the four core attributes of interest are always included in the profiles and are randomly ordered. The example in Figure 3 illustrates the case where four fillers are included.
We implemented this design using three MT surveys. The first took place on September 26, 2016, with 1,199 respondents; the second took place November 3 and 4 with 2,476 respondents; and the third took place on November 21 with 422 respondents.Footnote 10 In all three, after the respondents answered several socio-demographic questions, they were asked to complete 15 conjoint tasks. Critically, the waves differed in the number of filler attributes employed. The first stage-two survey was conducted exactly as specified in our pre-analysis study plan: we randomly assigned respondents to 0, 1, 2, 3, 4, or 5 previously validated filler attributes. After completing the first wave and observing the results, which indicated surprising robustness even for 5 filler attributes, we decided to administer additional waves with even larger numbers of fillers. The second MT wave thus included treatment arms with 0, 1, 2, 3, 4, 5, 6, 8, 10, 12, and 15 filler attributes. The third wave included only three conditions: 5, 25, and 35 filler attributes. For these additional waves, we also employed untested filler attributes which we had good reason to believe would be perceived as unrelated to the core attributes. Online Supplementary Appendix A.3 presents the full list of filler attributes. In the results below, we show estimates using all responses pooled from the three waves. The results that only use responses from the first, pre-registered wave are in Online Appendix A.3.
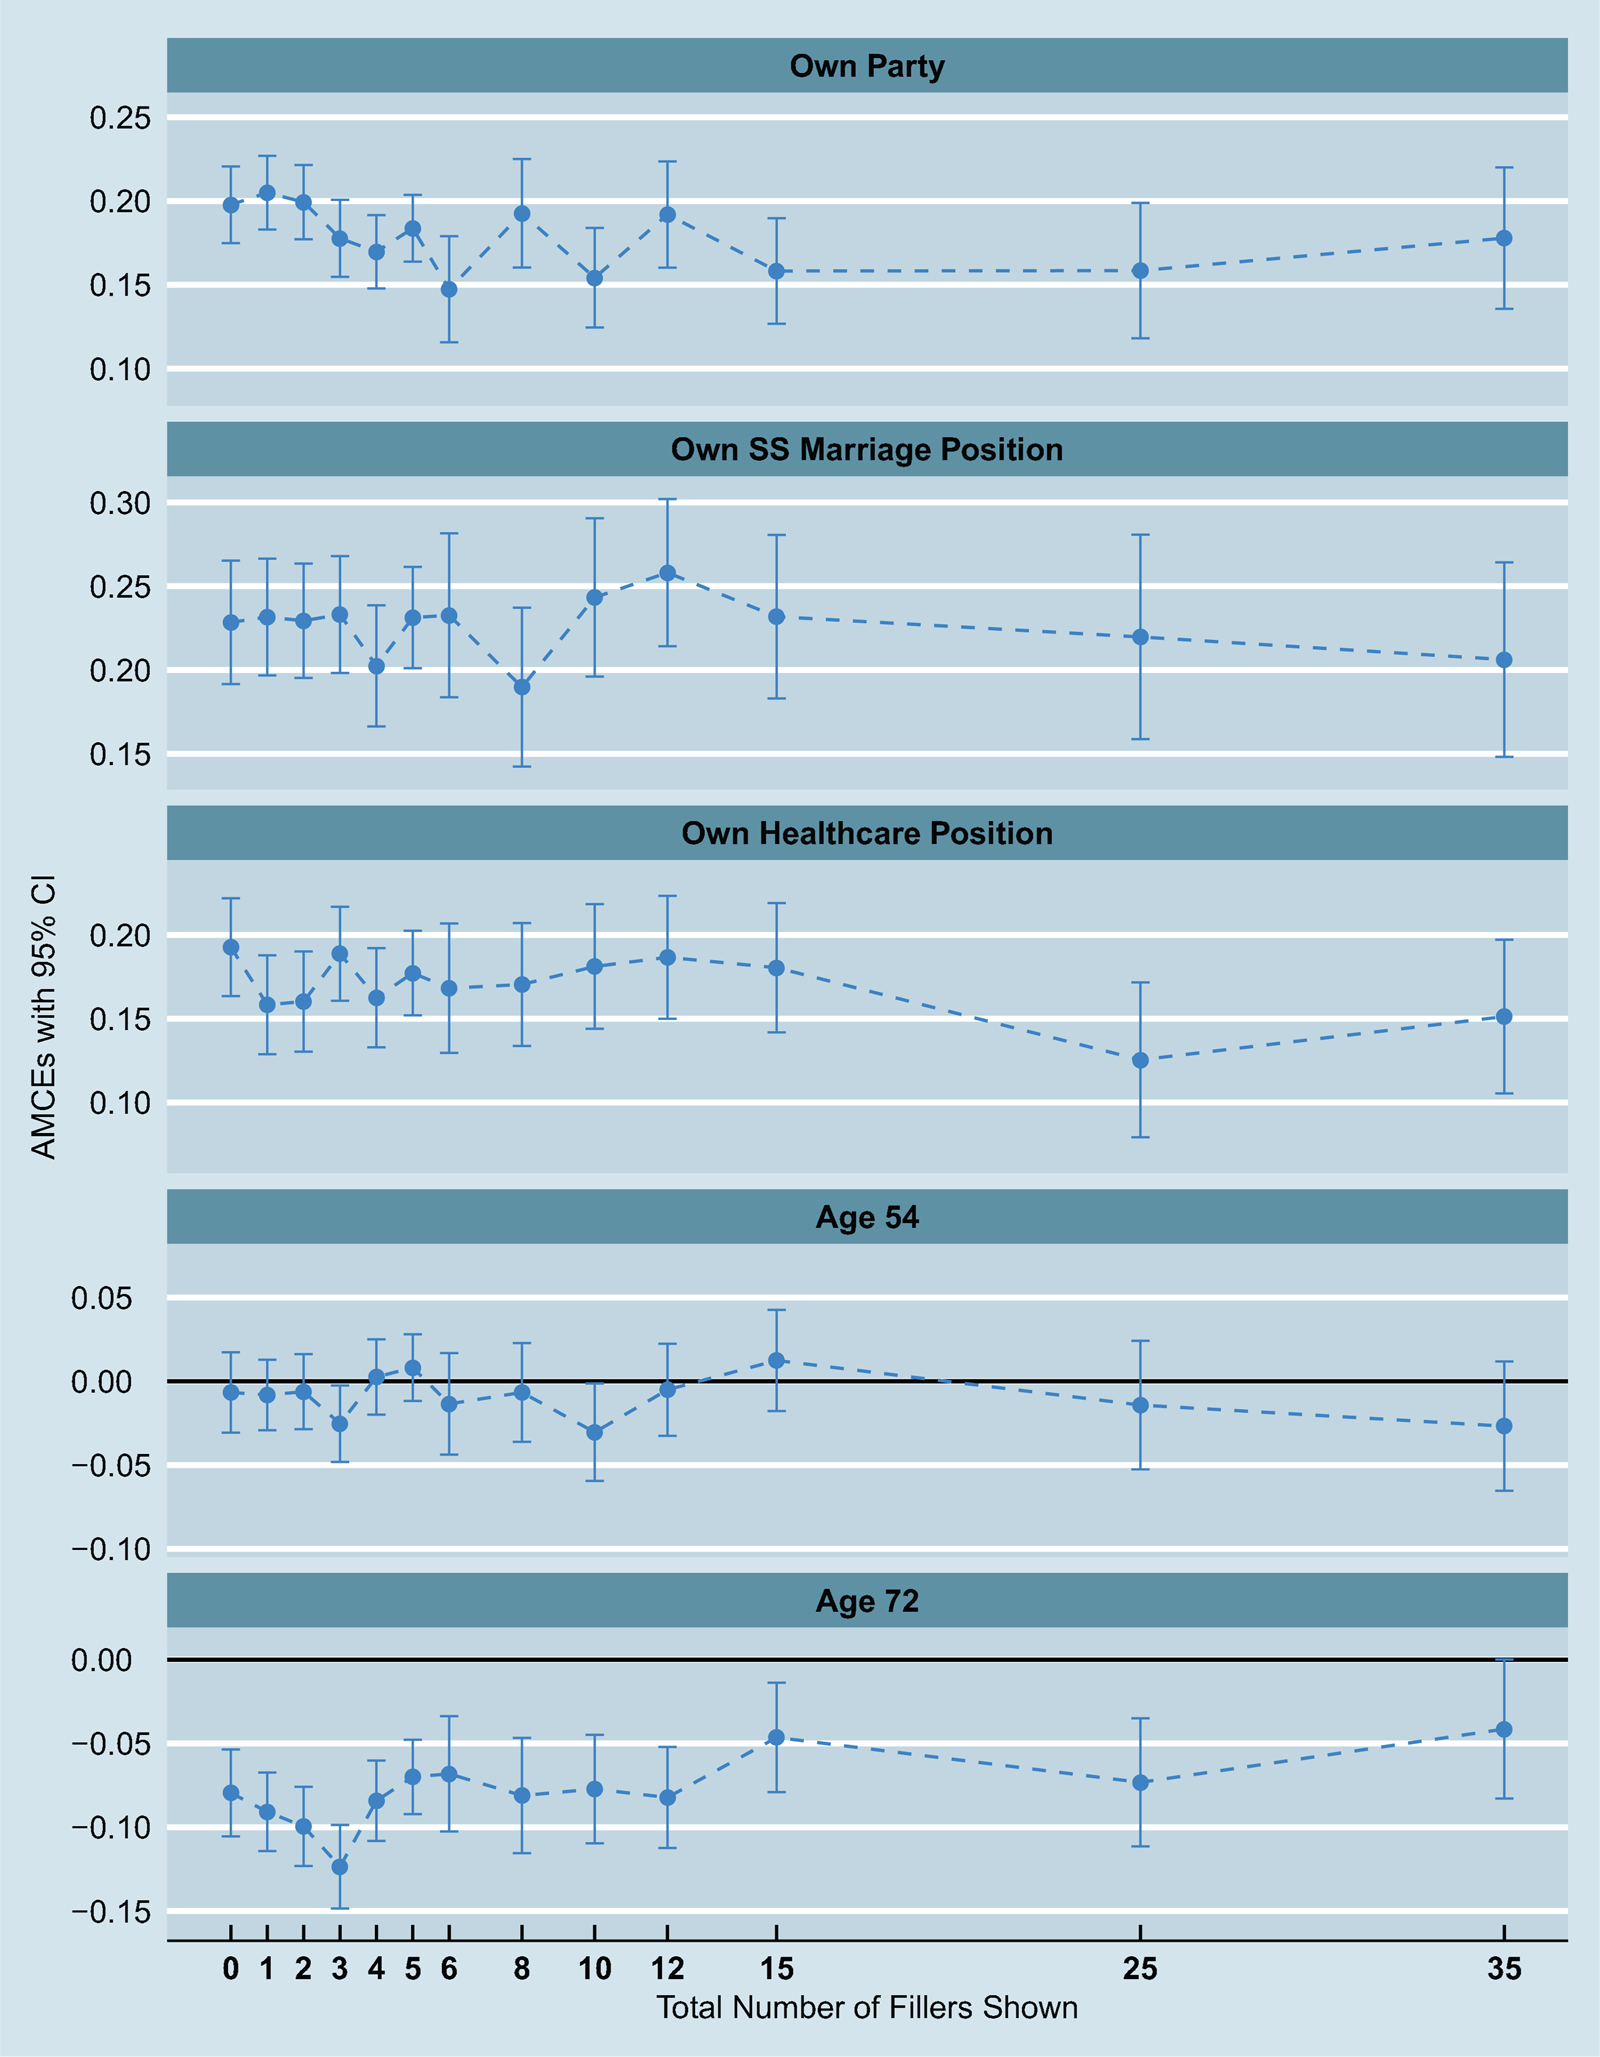
To quantify the extent of satisficing, we estimate the AMCEs corresponding to our four core attributes for each treatment condition for the pooled MT experiments, as illustrated in Figure 4 and Table A.3 in the Online Appendix. We limit the sample to those respondents who expressed an identification with or leaning toward the major parties, and we transform the party and issue-position measures such that they are indicators for concordance with the respondent's partisan affiliation. We focus here on the forced choice outcomes, although the results for the candidate ratings are very similar (see Online Appendix A.3). Candidates' partisanship proves to be a strong correlate of their choices: the AMCE associated with own-party candidates is 0.198 (SE = 0.012) for those who saw no filler attributes, and it drops no lower than 0.147 (SE = 0.016). In substantive terms, respondents are almost 20 percentage points more likely to opt for a candidate who shares their partisanship, an estimate which declines only slightly as the number of filler attributes grows.
The AMCEs for our core attributes of interest from the three MT survey waves as the number of filler attributes increases.

The drops in the AMCE for sharing the candidate's same-sex marriage position or health care position are similar: they are discernible but modest, and never obscure the relationships of interest. For instance, with zero filler attributes, the effect of a candidate's position on same-sex marriage is 0.228 (SE = 0.019), an estimate that declines to no lower than 0.190 (SE = 0.24). Candidates who are 72 years old are penalized, but this penalty is substantively smaller than the effects of the other core attributes (−0.080, SE = 0.013 with no filler attributes), and it declines to insignificance alongside 35 filler attributes.
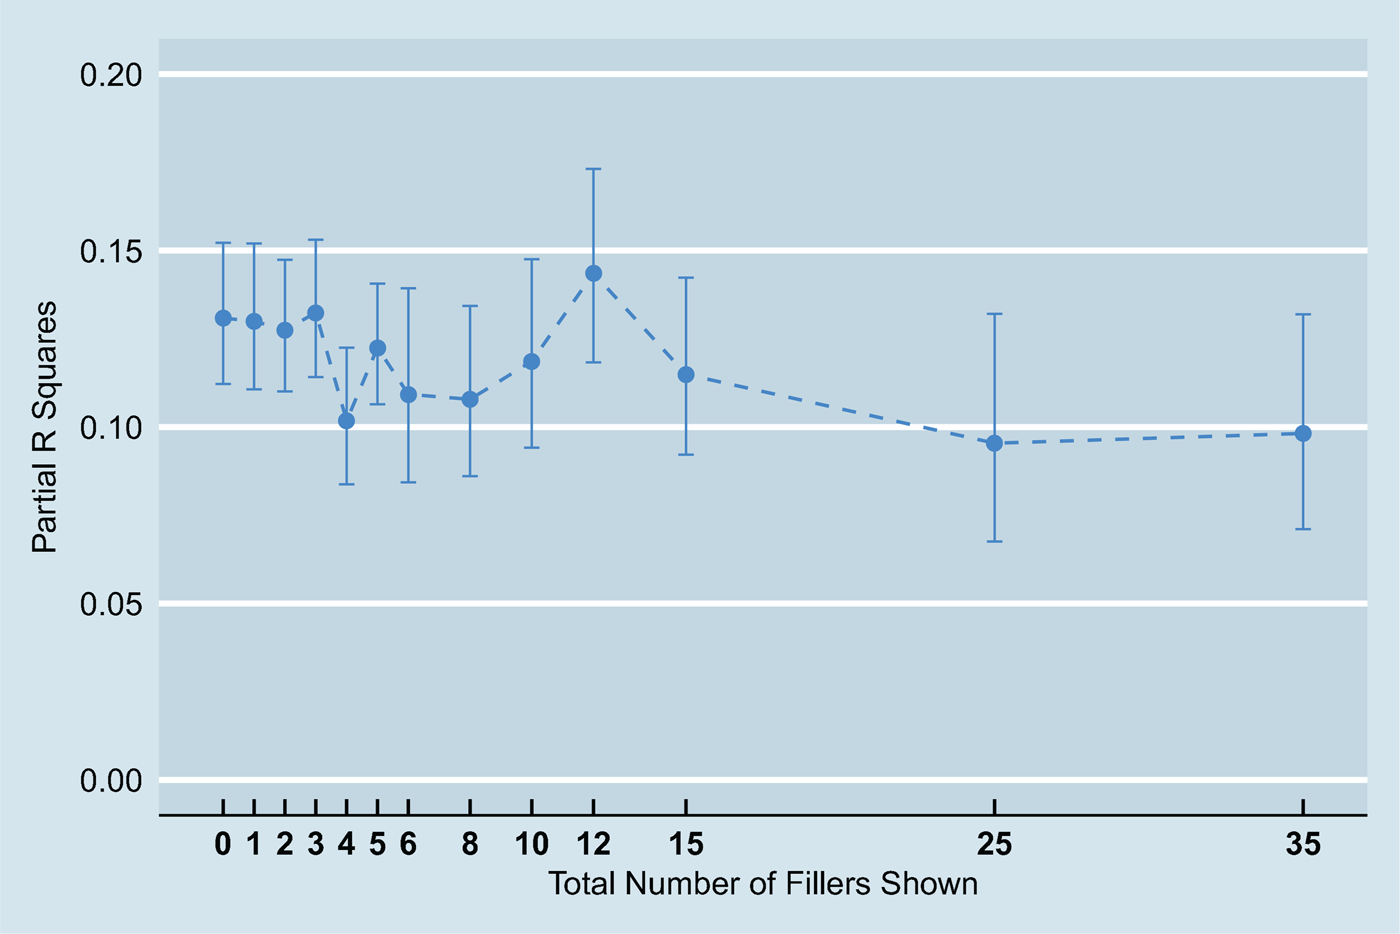
To consider the joint predictive power of the core attributes as the number of filler attributes rises, we calculate the partial R 2 values from models in which we predict each of the forced choices as a function of the core attribute levels associated with each candidate. Figure 5 illustrates the results. Here, too, the results are consistent with a detectable but limited decrease in the core attributes' predictive power as they are scattered among increasing numbers of filler attributes.
The partial R 2 values for our core attributes with the forced-choice outcomes as function of the filler attributes, fit to the MT data.

Next, given concerns about the extensive experience MT respondents are likely to have with surveys, we replicated our results with a survey of respondents available through SSI. These respondents are also self-selected, but the volume of surveys in which they participate is markedly lower on average. Our SSI survey included 2,786 respondents, and was administered between November 30 and December 8, 2016. We randomized the respondents to 0, 2, 4, 6, 8, 10, 15, 25, or 35 filler attributes. All respondents were randomly assigned to a number of attributes which then remained fixed throughout the survey. We pre-registered this portion of the study as an addendum to the original pre-analysis plan before conducting any analyses.Footnote 11
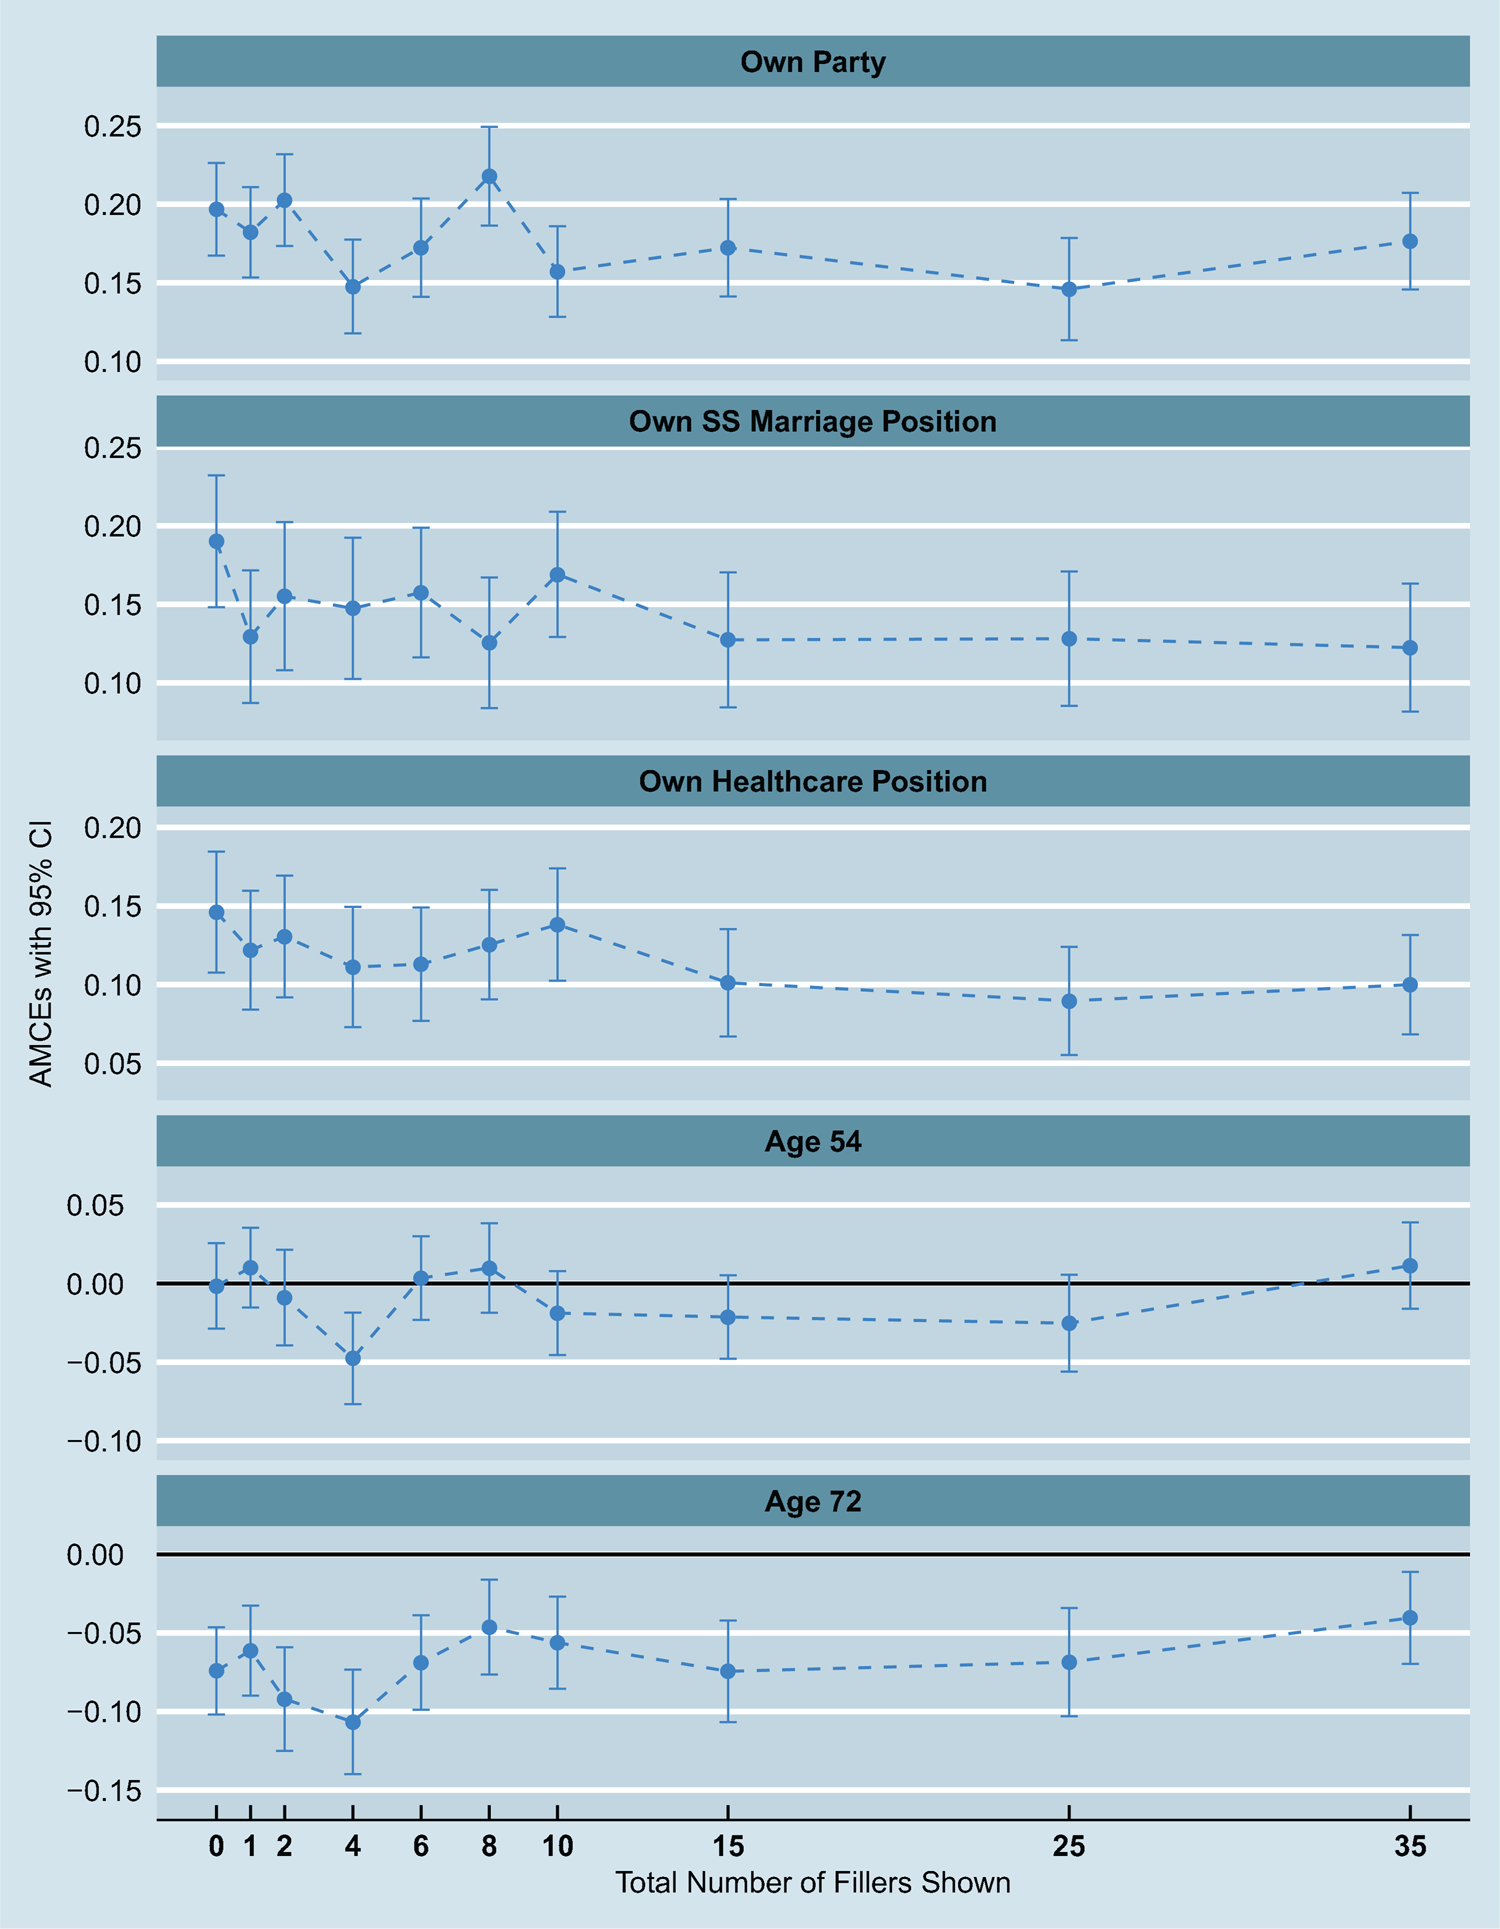
Figure 6 and Table A.4 in Online Appendix A.3 present the AMCEs for our core attributes. The results are generally quite similar. We see detectable but typically modest declines for core attributes. The effect of sharing the candidate's party is 0.197 (SE = 0.015), a figure which drops to a low of 0.146 (SE = 0.017) with 25 filler attributes. Sharing the candidate's position on same-sex marriage has an AMCE of 0.190 (SE = 0.021) when no filler attributes are present and 0.122 (SE = 0.021) when there are 35. Similarly, sharing the candidate's health care position drops from 0.146 (SE = 0.020) to 0.090 (SE = 0.018) in the presence of 25 filler attributes.
The AMCEs for our core attributes of interest from the SSI survey as the number of filler attributes increases.

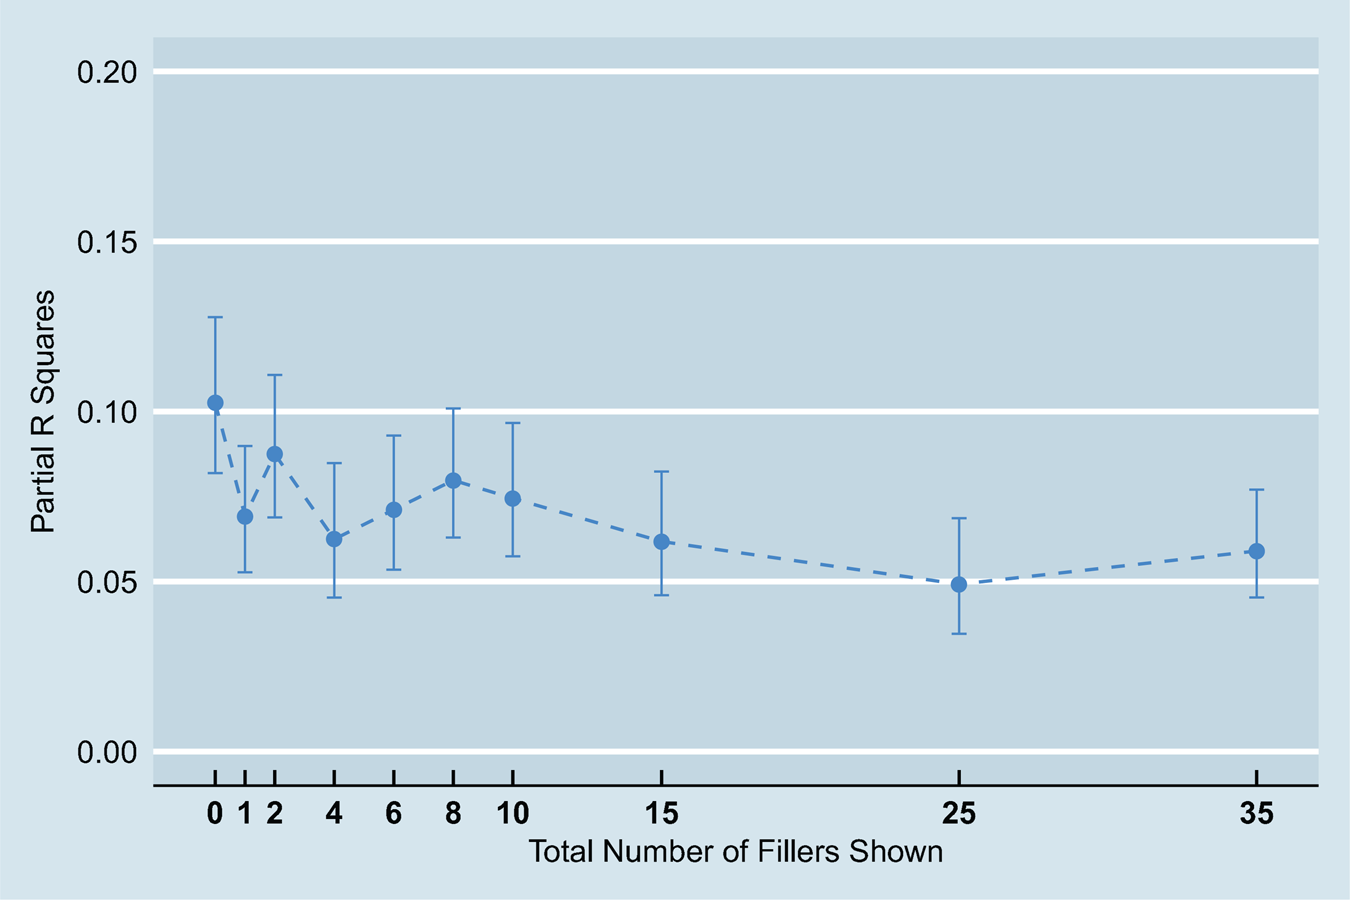
Replicating the procedure above, we also estimated partial R 2 values associated with models including our core attributes but no filler attributes. Figure 7 illustrates the results. First, it demonstrates that the partial R 2 values using the SSI data are consistently lower than those recovered from the MT data. This pattern is consistent with MT respondents on average paying more attention to the task, though it could also come from any difference in preferences between the two groups of respondents. Despite this lower baseline, the trend is similar, with a detectable decline in overall predictive power that is slightly more pronounced for cases where there are large numbers of filler attributes. Overall, however, respondents provide meaningful responses even with as many as 35 filler attributes, a number much larger than what is employed in virtually all recent studies.
The partial R 2 values for our core attributes with the forced-choice outcomes as function of the number of filler attributes, fit to the SSI data.

4.2. Study 2: hotel rooms
In Study 2, we employ a design similar to Study 1 but investigate respondents' choice of hypothetical hotel rooms. The core attributes are the view from the room (ocean or mountain view), floor (top, club lounge, or gym and spa floor), bedroom furniture (1 king bed and 1 small couch or 1 queen bed and 1 large couch), and type of in-room wireless internet (free standard or paid high-bandwidth wireless).
Like in Study 1, we begin with a list of additional attributes that should have no perceived correlation with the core attributes, so they can be used as second-stage fillers. Unlike in Study 1, however, we choose attributes that are uncorrelated with the core attributes but likely to have their own effects on respondents' preferences. The goal behind this modification is to investigate the impact of the increased cognitive burden due to the addition of meaningful information. Studying preferences about hotel rooms facilities the identification of such meaningful but uncorrelated attributes; in the candidate choice example, most relevant attributes are likely to be perceived as interrelated. As validity checks, we include two attributes that are likely to be associated with some of the core attributes (sailboats or trees viewable from the hotel window, bedroom pillow size). Table A.8 in Online Appendix A.4 lists the full set of filler attributes.
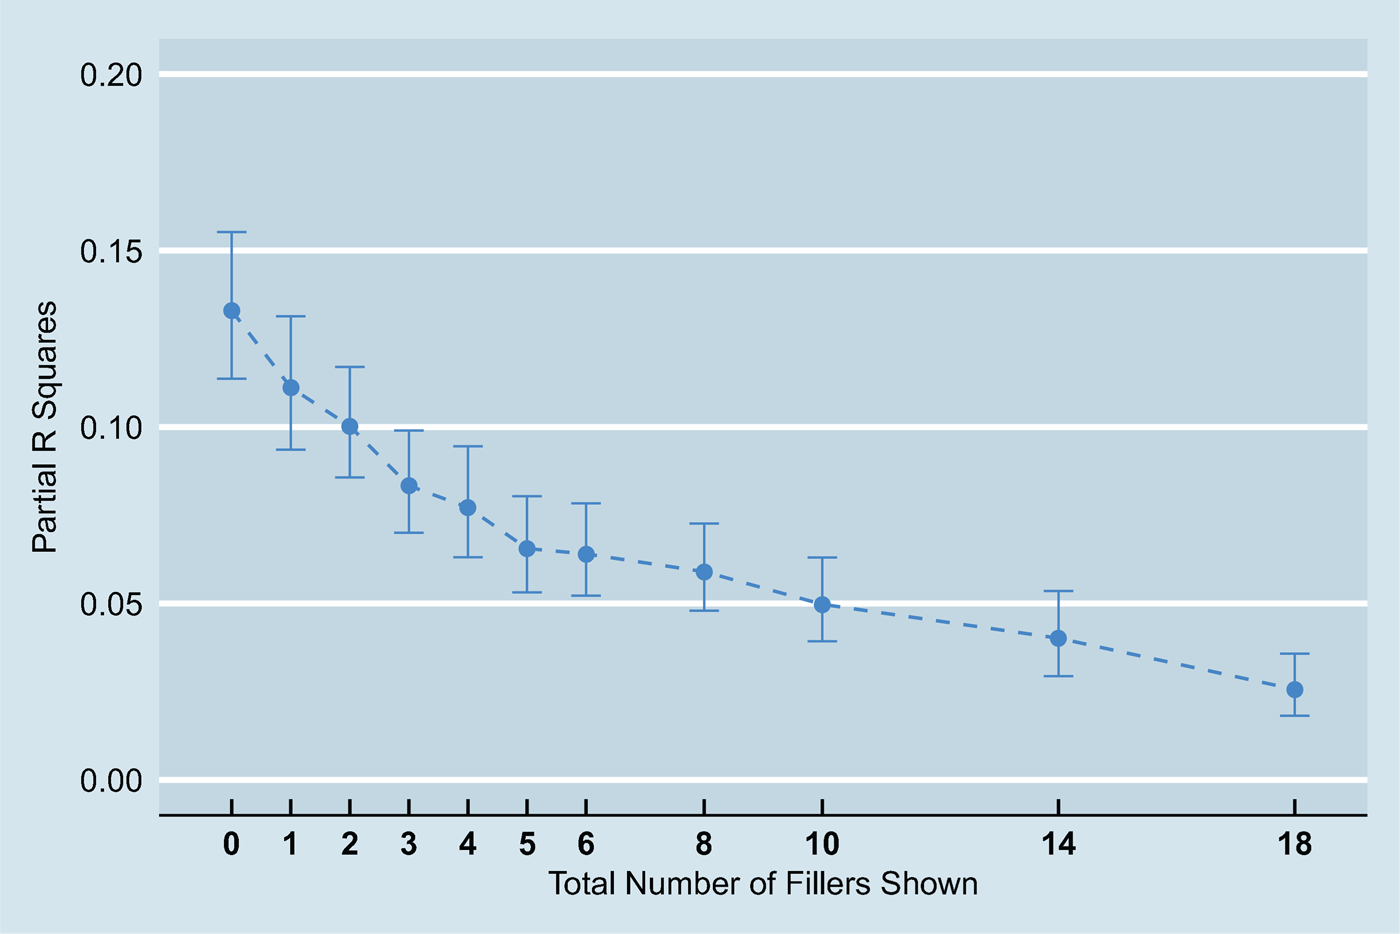
We administered the first stage to 3,291 respondents recruited through MT on February 28–March 2, 2017 (see Online Appendix A.4 for details). Using the same procedure as in Study 1, we identified 18 of the 38 potential filler attributes as perceived to be uncorrelated with the core attributes. In addition, we detected strong correlations between our validity-check fillers and the core attributes, confirming that our respondents were paying attention. We then proceeded to our second-stage experiment on March 6-7, 2017, again using MT respondents (N = 3,307). The experiment followed the same format as the corresponding experiment from Study 1. We randomly assigned respondents to 0, 1, 2, 3, 4, 5, 6, 8, 10, 14, or all of the 18 filler attributes. We then asked the respondents to complete choice and rating tasks on 15 pairs of hotel room profiles, each consisting of the four core attributes as well as a randomly chosen set of filler attributes.
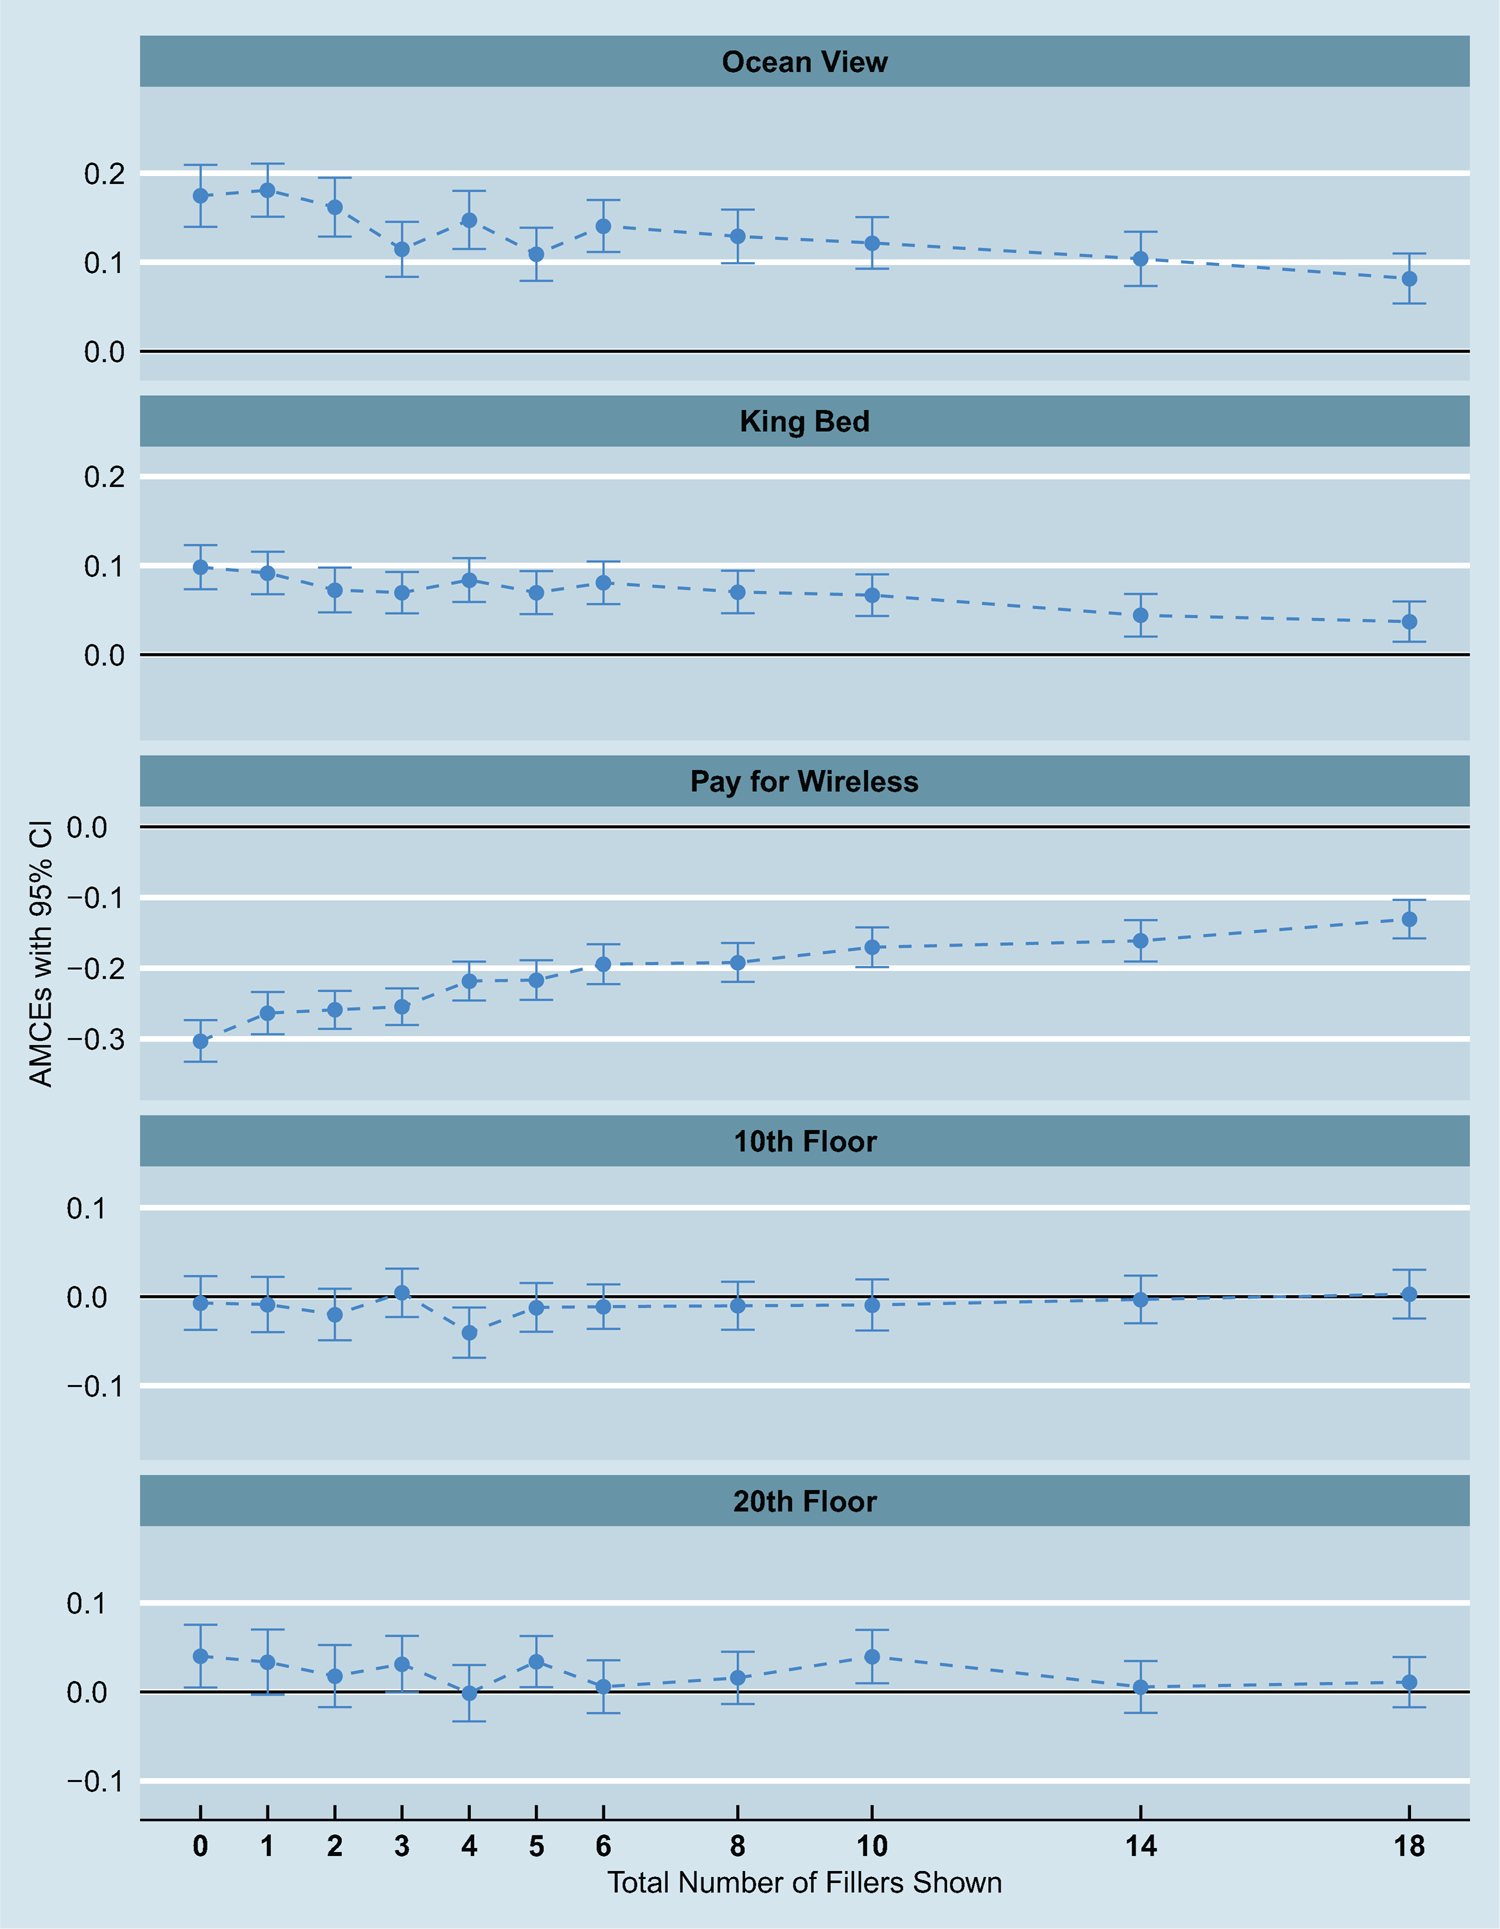
Figure 8 shows the estimated AMCEs of our core attributes across the treatment conditions. Again, we focus on the forced choice outcomes. The results for the rating outcomes are very similar and presented in Figure A.13 in Online Appendix A.5.Footnote 12 When the design includes no filler attributes, almost all of our core attributes have a strong impact on respondents' preferences. The AMCE for an ocean view room is estimated at 0.175 (SE = 0.018), meaning that respondents are more than 17 percentage points more likely to choose a room with an ocean view compared to a mountain view room. Respondents also prefer rooms with a king bed and a small couch to rooms with a queen bed and a large couch (AMCE = 0.098, SE = 0.03). The type of in-room internet is also important in respondents' choices (AMCE = −0.303, SE = 0.015), implying that respondents are on average 30 percentage points less likely to choose a room with paid high-bandwidth internet compared to an otherwise identical room with free standard wireless. In contrast, the floor of the room turns out to be almost irrelevant.
The AMCEs for our core attributes of interest from the hotel survey as the number of filler attributes increases.

The core, impactful attributes remain substantively significant when we add filler attributes. However, in contrast to Study 1 where we found a largely flat line across many filler conditions, the results indicate noticeable declines in the effects of each of these attributes as the number of fillers increases. For example, the estimated AMCE for an ocean view room drops to 0.141 (SE = 0.015) when 6 randomly chosen fillers are included, and it further declines to 0.082 (SE = 0.014) when the profile includes 18 fillers. It is nonetheless remarkable that the attribute retains nearly half of its original effect; the estimate still implies an 8.2 percentage point increase for ocean-view rooms. Likewise, the estimated AMCE of a king bed and a small couch decreases to 0.037 (SE = 0.012) when the number of fillers is 18. For the wireless internet attribute, the AMCE is also estimated to be slightly less than half of its original value (−0.131, SE = 0.014) with 18 fillers. Changes in the partial R 2 values for these core attributes, reported in Figure 9, confirm that the attributes retain significant (but decreased) predictive power even after the inclusion of 18 fillers.
The partial R 2 values for our core attributes with the forced-choice outcomes from the hotel study, as a function of the number of filler attributes.

Conjoint tables that include as many as 22 attributes are rarely used in practice, and thus the 18-filler condition may not be a practical benchmark. Instead, conjoint studies, at least in the fields of political science and public policy, rarely use more than ten attributes. Thus, it is useful to focus on the comparison between the experimental conditions in which 0 and 6 fillers are included. Moving from the former to the latter condition, the AMCEs each retain at least two-thirds of their initial magnitude, a demonstration of substantial robustness given that this comparison involves more than doubling the amount of meaningful information on the conjoint table.
Perhaps more importantly, the rate of attenuation of the AMCEs as additional fillers are added is virtually uniform across all of the attributes, meaning that the relative magnitudes of the estimated AMCEs remains unchanged across conditions. Accordingly, the qualitative conclusions one would draw about the relative effect sizes are invariant to the number of fillers included in the design. This finding is particularly notable given that a major contribution of conjoint designs is in allowing researchers to compare the relative magnitudes of effects across attributes.
5. Conclusion
There is an extensive body of research on how best to conduct phone surveys. It covers many issues researchers are likely to face in implementing telephone surveys, from survey length to question order. In recent years, the rapid growth of survey research conducted via computers has enabled researchers to employ increasingly complex research designs at little added cost. Yet, research on survey methods has to date been focused on the change in sampling frames that has accompanied the shift toward online survey administration (e.g. Chang and Krosnick Reference Chang and Krosnick2009; Yeager et al. Reference Yeager, Krosnick, Chang, Javitz, Levendusky, Simpser and Wang2011). For those administering surveys via computer, there is surprisingly little guidance about the extent to which insights developed for phone and in-person surveys hold up (but see Gooch and Vavreck Reference Gooch and Vavreck2015).
Conjoint experiments are one such design: they are easily implemented by computer, and so have seen a renaissance within political science in the past few years. In this paper, we sought to advance our understanding of response behavior in surveys administered by computer by probing one breaking point of conjoint designs. Specifically, we considered how many attributes researchers can include per profile. To include too few attributes may risk masking, while including too many may instead produce excessive satisficing.
Those who would assess this trade-off empirically face an empirical challenge. When changing the number of attributes, we also change the information that respondents have, and so shift the causal estimand. To isolate the effects of increased satisficing, this paper employs a set of pre-registered experiments using a novel, two-stage design in which we first isolated several “filler attributes” unrelated to the core attributes of interest. We then randomly assigned respondents to conjoint profiles with varying numbers of filler attributes.
Our first study used this design to estimate the effects of irrelevant filler attributes on response quality when respondents chose between hypothetical Senate candidates. Using such attributes, we found a detectable but substantively limited decline in the predictive power of our core attributes as the number of such filler attributes increased. Extraneous information does not on its own induce excessive satisficing, even when the number of such irrelevant attributes grows larger than the total number of attributes in most conjoint designs published recently.
Still, when researchers seek to include additional attributes, it is typically because those attributes are likely to be meaningful for the choice at hand. In our first study, the attributes did not have independent impacts on the outcome, making them atypical and limiting our capacity to generalize. To address that concern, our second study turned to a domain in which it was possible to identify attributes which had meaningful, independent effects on respondent choice without being correlated with the core attributes of interest: hotel rooms. In that case, respondents saw profiles which had many potentially meaningful attributes. Our second study thus allowed us to examine satisficing in cases where respondents are potentially overwhelmed with meaningful information. Yet here, too, our central finding was the robustness of conjoint designs, as even 18 meaningful attributes did not erase the effects of our core attributes.
Our results have important implications for researchers designing conjoint studies. First, our results suggest that satisficing does not impose a serious binding constraint on the number of attributes included in a conjoint design.Footnote 13 Certainly, there is no single magic number of attributes which promises to guard against excessive satisficing. However, the limits on the upper number of attributes that we considered in our studies were purposefully set at levels above conventional practice. Even given this high number of filler attributes, the core attributes retained most of their effect magnitudes. More importantly, the addition of filler attributes did not affect the relative sizes of the core attribute effects. In other words, while satisficing appears to result in some attenuation, we do not find it to systematically alter the pattern of results, thereby ensuring that the broad interpretation of the results would remain unchanged. This points to the robustness of the conjoint design for investigating multidimensional preferences by comparing the relative importance of many different attributes.
Second, these results also yield concrete recommendations for researchers. Specifically, researchers should not allow concerns about satisficing to dictate their conjoint design decisions in terms of the number of attributes, assuming that the number is kept within the limits investigated in the studies presented here. Instead, researchers should prioritize other criteria in making their design choices. In particular, attribute selection and profile design choices should focus on accounting for masking in a way that fits the theoretical questions of interest, and on achieving the desired level of realism in the conjoint profiles.
We recognize that our studies were implemented using opt-in internet samples, which are likely to be different from other samples of respondents who have less experience taking surveys or face reduced incentives to pay attention. Yet the most commonly used samples for conjoint surveys today are opt-in internet samples, making our results relevant for a broad set of researchers. In addition, we recognize that the difficulty of a conjoint survey also depends on its subject matter. For example, evaluating two candidates for Senate is a familiar task, and is likely to be easier than evaluating multidimensional choices in less common domains. Future work that extends this research to less attentive populations and/or different subject matter domains would be valuable.
Supplementary Materials
The supplementary material for this article can be found at https://doi.org/10.1017/psrm.2019.13
Acknowledgments
We are grateful to seminar participants at Yale University, University of Oxford, University of Pennsylvania, Northwestern University, the 2015 American Political Science Association annual meeting, and PolMeth XXXIV for helpful discussion and comments. All errors are our own.