Implications
Fish oil ingested in an affordable daily dose (2.5% of the feed ration) enriched pig muscle, liver and fat with nutritionally valuable long-chain polyunsaturated fatty acids (PUFA) n-3. Moreover, pigs were used as a model for testing fish oil functionality: fish oil was not able to affect plasma level of an important anti-inflammatory marker adiponectin, increased not only plasma concentration of some anti-inflammatory, but also some pro-inflammatory cytokines, and increased gene expression of inflammatory markers intercellular adhesion molecule 1 (ICAM1) and lipopolysaccharide-binding protein (LBP) in the liver.
Introduction
In general, pig diets can be supplemented with fish oil mainly for reproductive purposes and for increasing the nutritive value of meat and meat products. Feeding functional components of fish oil, PUFA n-3 eicosapentaenoic acid (EPA) and docosahexaenoic acid (DHA) to gilts tended to improve litter growth, but did not have an effect on overall subsequent reproductive performance (Smit et al., Reference Smits, Luxford, Mitchell and Nottle2013). Smits et al. (Reference Sundaram, Bukowski, Lie, Picklo and Yan2011) demonstrated that feeding sows a diet containing PUFA n-3 from fish oil before farrowing and during lactation increased litter size in the subsequent parity independent of energy intake. Fish oil in a diet of female pigs had no significant effect on growth performance, carcass characteristics and meat quality, but increased EPA and DHA levels in the subcutaneous fat (Morel et al., Reference Morel, Leong, Nuijten, Purchas and Wilkinson2013). Khiaosa-ard et al. (Reference Khiaosa-ard, Chungsiriwat, Chommanart, Kreuzer and Jaturasitha2011) reported an efficient enrichment of bacon and different sausages by PUFA n-3 when pigs were fed a diet with tuna oil; however, the authors mention that care should be taken in producing dry sausages due to their susceptibility to rancidity during storage time.
Anti-inflammatory effects of EPA and DHA are based, among others, on competition with PUFA n-6 arachidonic acid (AA) in eicosanoid synthesis (Schmitz and Ecker, Reference Schmitz and Ecker2008), and on modulation of signaling pathways (reviewed, e.g., by Komprda, Reference Komprda2012) mediated by transcription factors peroxisome proliferator-activated receptors (PPARα; PPARγ) and nuclear factor κ B (NF-κB). Moreover, EPA and DHA signaling relates to their enrichment in cell membrane phospholipids, which affect membrane fluidity, bilayer width and cholesterol domain formation due to the distinct phospholipid/sterol interactions (Mason et al., Reference Mason, Jacob, Shrivastava, Sherratt and Chattopadhyay2016). Enrichment of the B-cell phospholipids by DHA decreased clustering of membrane microdomains, contrary to EPA that increased clustering (Gurzell et al., Reference Gurzell, Teague, Duriancik, Clinthorne, Harris, Shaikh and Fenton2015). Regarding eicosanoid synthesis via cyclooxygenase-2 pathway (production of prostaglandins and thromboxanes) and 5-lipoxygenase pathway (production of leukotrienes), EPA-derived eicosanoids have less pronounced and in many instances opposite (i.e. anti-inflammatory) effects in comparison with the AA-derived counterparts (Das, Reference Das2006). Eicosapentaenoic acid and DHA are endogenous ligands of PPARγ, whose activation increases an amount of adiponectin, an adipose tissue-derived anti-inflammatory hormone (Siriwardhana et al., Reference Smit, Patterson, Webel, Spencer, Cameron, Dyck, Dixon and Foxcroft2013). Anti-inflammatory effect of EPA/DHA is further mediated by GPR120, a G-protein coupled receptor, activated especially by PUFA but also other long-chain fatty acids; GPR120 activation leads to a repression of the macrophage-induced inflammation (Flock et al., Reference Flock, Rogers, Sandeep Prabhu and Kris-Etherton2013). Eicosapentaenoic acid/DHA presence decreases plasma levels of pro-inflammatory markers interleukin 6 (IL-6), tumor necrosis factor α (TNF-α) or interferon γ, and increases concentration of anti-inflammatory markers IL-10 and transforming growth factor β (TGF-β; Oliver et al., Reference Oliver, McGillicudy, Phillips, Toomey and Roche2010). Eicosapentaenoic acid/DHA anti-inflammatory effects are mostly unambiguous when evaluated in vitro: EPA and DHA decreased lipopolysaccharide (LPS)-induced pro-inflammatory interleukin (IL)-1β expression in 3T3-L1 adipocytes (Cranmer-Byng et al., Reference Cranmer-Byng, Liddle, De Boer, Monk and Robinson2015); Romacho et al. (Reference Romacho, Glosse, Richter, Elsen, Schoemaker, van Tol and Eckel2015) reported prevention of TNF-α induced NF-κB activation in human primary adipocytes; DHA decreased the degree of monocyte chemoattractant protein-1 and IL-6 secreted from murine adipocytes (DeBoer et al., Reference De Boer, Monk and Robinson2014).
As far as in vivo experiments are concerned, Liu et al. (Reference Liu, Gong, Li, Feng, Zhao and Dong2003) reported a tendency of fish oil to reduce IL-1β and IL-2 production in the LPS-challenged weanling pigs. Similarly, n-3 PUFA intervention on LPS-challenged mice decreased levels of inflammatory cytokines, including TNF-α, in an experiment of Liu et al. (Reference Liu, Li, Chen, Zhang and Kang2015). On the other hand, Hall et al. (Reference Hall, Priestley, Perry and Michael-Titus2012) found out no substantial effect of fish oil (EPA and DHA) on pro-inflammatory cytokines in model organisms (rodents). Using a mouse model with a persistent systemic TNF-α activation (transgenic mice expressing human TNF-α), Vigerust et al. (Reference Yates, Calder and Rainger2013) found out no significant differences between fish oil-fed and control animals in the hepatic concentrations of IFN-γ, IL-1β, IL-2 or IL-6; content of pro-inflammatory IL-17 was even higher in the fish oil group. Therefore, at least three reasons for a caution can be stated regarding an effect of EPA/DHA on inflammation modulation. First, unequivocally positive effects of EPA/DHA were mostly obtained by in vitro studies using higher-than-physiological EPA/DHA concentrations (Yates et al., Reference Zhu, Liu, Chen, Wang, Pi, Leng, Chen, Zhang and Kang2014). Second, the most common in vivo model of inflammation, rodents, belongs (regarding the signaling pathway including PPARγ ligation by EPA/DHA, which leads inter alia to proliferation of peroxisomes) to the proliferative species, contrary to the non-proliferative species pigs and humans (Luci et al., Reference Luci, König, Giemsa, Huber, Hause, Kluge, Stangl and Eder2007). Finally, EPA/DHA action can lead to a decreased resistance against infections possibly due to a modulation of a Th1 cytokine IL-12 production (Sierra et al., Reference Schmittgen and Livak2006); a highly complex interaction between a neutrophil depletion and EPA/DHA intake has been reported (Fritsche et al., Reference Fritsche, Irons, Pompos, Janes, Zheng and Brown2005). Therefore, the objective of the present study was to evaluate the LPS-induced markers of inflammation in pigs fed a diet with a commonly achievable EPA+DHA content. The hypothesis that fish oil at an amount of 2.5% of a feeding ration ameliorates selected markers of the LPS-induced inflammation in pigs was tested. The liver and visceral adipose tissue (VAT) was used, because VAT is a metabolically active endocrine organ (Tewari et al., Reference Upadhaya, Kim, Mullan, Pluske and Kim2015), it is more strongly correlated to pathologies related to inflammation than subcutaneous adipose tissue and drains its venous effluent directly to the liver via the portal venous system, exerting a disproportionate effect on hepatic and systemic metabolism (Frikke-Schmidt et al., Reference Frikke-Schmidt, OʼRourke, Lumeng, Sandoval and Seelej2016).
Material and methods
Animals, dietary interventions
In total, 32 pigs of both sexes (16 males, 16 females; Large White×Landrace; Bioprodukt Knapovec a.s., Ústí nad Orlicí, Czech Republic) at the age of 8 weeks with the mean live weight (W) of 25.5±1.15 kg were used. The pigs were housed in an experimental stable in floored indoor pens (10 m2) of four animals each. The experiment was performed in compliance with the Czech National Council Act No. 246/1992 Coll. to protect animals against cruelty, the Amended Act No. 162/1993 Coll., and was approved by the ‘Commission to protect animals against cruelty’ of the Mendel University in Brno and of the Ministry of Agriculture of the Czech Republic. The pigs were divided into two groups with 16 animals each and blood samples were drawn from vena cava cranialis of each pig for the hematological analysis. Blood was collected into tubes with heparinum natricum (25 IU/ml of blood; Zentiva, Prague, Czech Republic) to prevent blood clotting. The same number of males and females was included in each group. The experimental and control group was fed the basic feed mixture with 2.5% of fish oil (F; oleum jecoris aselli, Fagron, Olomouc, Czech Republic) and 2.5% of palm oil (P; Master Martini CE, Prague, Czech Republic), respectively. The P diet was used as a control in order to keep the diet not only isocaloric but also isolipidic. Composition of the diets including fatty acid content, and fatty acid composition of fish oil and palm oil is presented in Supplementary Table S1. The animals had free access to the drinking water and were fed daily ad libitum; the daily ration was divided into two parts and fed twice daily (0700 and 1400 h). By subtracting leftovers, the net feed consumption was measured twice daily; feed intake was measured per pen (not individually). The animals were weighed in weekly intervals. The fattening lasted for 70 days.
Lipopolysaccharide challenge, sample collection, determination of hematological markers
Last (i.e. 70th) day of fattening, the F and P group, respectively, was randomly divided into two subgroups of eight animals each and blood samples were drawn from vena cava cranialis of eight F and eight P pigs for the hematological analysis as mentioned above. Lipopolysaccharide (E. coli O111:B4, product number L2630; Sigma-Aldrich, Prague, Czech Republic) at an amount of 25 μg/kg W was applied i.v. (vena auricularis) to the above-mentioned eight F and eight P pigs; the rectal temperature was measured and the behavior of the pigs was observed. Three hours after the LPS application, blood samples were repeatedly taken (vena cava cranialis) from the same pigs for hematological analysis. Consequently, all 32 pigs were anesthetized by the intramuscular application of the tiletamine/ketamine/xylazine (TKX) mixture (12.5 mg/ml of tiletamine (Virbac, Carros, France)+12.5 mg/ml of ketamine (Vetoquinol, Lure, France)+12.5 mg/ml of xylazine (Bioveta, Ivanovice na Hane, Czech Republic)+12.5 mg/ml of zolazepam (Virbac)) in the total volume of 0.2 ml/kg W, and then sacrificed by bleeding. Another blood samples (for the flow cytometry measurements) were collected (from the aorta) to the heparin-coated test tubes, and the liver (200 g), muscle (m. quadriceps femoris; 200 g) and VAT (pelvic; 200 g) samples were taken. Blood samples were centrifuged at 2000×g for 10 min at 4°C to obtain plasma. Aliquots (100 g) of the muscle, liver and VAT samples were freeze-dried (ALPHA 1-2 LO plus; Christ GmbH, Osterode am Harz, Germany) and stored at −20°C for subsequent fatty acid analyses. Liver and VAT aliquots, 50 and 50 mg, respectively, were taken for the gene expression assessment. Hematological analysis (counts of leukocytes, lymphocytes, monocytes and neutrophil, eosinophil and basophil granulocytes) was performed on automatic hematological analyser Mindray BC-2800 Vet (Mindray, Bio-Medical Electronics, Shenzhen, China) according to the manufacturer’s instructions.
Quantification of the gene expressions
Sampled liver and VAT aliquots cooled on ice were directly subjected to homogenization (MagNA Lyser, Roche, Switzerland) in stabilization solution TRI Reagent RT (Molecular Research Center, Cincinnati, OH, USA). Afterwards, RNA phase was obtained from the homogenate mixed with bromoanisole by separation in refrigerated centrifuge (Hermle Z 326 K, Wehingen, Germany). A column-based isolation (RNeasy Mini Kit; Qiagen, Hilden, Germany) was applied to the RNA phase, and purified total RNA was eluted in 17 µl of RNase free water. Consequently, the quality and quantity of purified RNA was tested spectrophotometrically on a NanoDrop 2000 UV-Vis spectrophotometer (Thermo Fisher Scientific, Waltham, MA, USA). The average concentration of RNA isolated from the liver and VAT samples was 2 and 0.13 µg/µl, respectively. Purity of RNA from liver and VAT samples expressed as the ratio of absorbances at 260 and 280 nm varied from 1.99 to 2.05 and from 1.80 to 1.94, respectively. Ribonucleic acid was stored at −80°C and RNA integrity was checked elecrophoretically. To obtain cDNA, the same amount of RNA (0.24 µg) was subsequently reversely transcribed using M-MLV reverse transcriptase (200 U) (Invitrogen, Paisley, UK) and oligo-dT primers in 20 µl reactions at 37°C for 1.5 h, and stored at −20°C until used. A non-template control containing elution water was included.
The determination of gene expression was carried out by quantitative PCR in triplicate reactions in 384 well plates using QuantiTect SYBR Green PCR Master Mix (Qiagen) on a LightCycler 480 (Roche Applied Science; https://www.roche.com) after automatically performed filling of plates using the Nanodrop II liquid dispenser (Innovadyne Technologies, Rohnert Park, CA, USA) following the manufacturer’s recommendations under the following conditions: denaturation at 95°C for 15 min and 45 amplification cycles at 95°C for 15 s, 58°C for 30 s and 72°C for 30 s. The PCR reaction mixture in the final volume of 3 µl consisted of 0.5 μl of cDNA, 1.5 μl of master mix and 1 μl of primer pairs with concentration of 10 pmol each (Generi Biotech, Hradec Kralove, Czech Republic; Supplementary Table S2). Primer design was performed using NCBI primer designing tool Primer BLAST (https://www.ncbi.nlm.nih.gov/tools/primer-blast/index.cgi?LINK_LOC=BlastHome). In order to prevent the detection of potentially present genomic DNA (despite targeted RNA isolation) primers were designed so that at least one primer within a given primer pair spanned an exon junction on the mRNA template. The Excel Add-in NormFinder algorithm (2004, Molecular Diagnostic Laboratory, Aarhus University Hospital, Denmark) was used for identifying the optimal normalization gene among a set of candidates (TBP1, HPRT1, HMBS2). TBP1 presented the lowest variability among samples of both organs tested and was chosen as a reference gene, with stability values 0.018 and 0.020 set up for liver and VAT, respectively, and was used as a positive internal control. Each run included a non-template control to test the assay reagents for contamination. The resulting melting curves were analyzed to test the product specificity using LightCycler 480 Software 1.5.0.39. Primer product size was checked by gel electrophoresis. Serial 10-fold dilutions of DNA template was used to create a standard curve using LightCycler 480 software, version 1.5.0.39, and primer efficiency of amplification (E) for each primer pair was set up: E-values were within the range of 1.942 to 2.095. As the efficiencies of all primer pairs including internal control TBP1 primer pair were very close to optimal efficiency of 2, this optimal value was used in the gene expression calculation. The differences between expression of the gene of interest (GOI) in the sample (fish oil, F) and in the control (palm oil, P) were calculated using the ΔC T method according to Schmittgen and Livak (Reference Siriwardhana, Kalupahana, Cekanova, LeMieux, Greer and Moustaid-Moussa2008) based on the efficiency E=2 and the quantification cycle value C T for the GOI and the reference gene (REF) as 2−{[CT GOI(sample) −CT REF(sample)] − [CT GOI(control) − CT REF(control)]}.
Determination of plasma cytokines and plasma adiponectin
Interleukin-1β, IL-4, IL-6, IL-10, IL-12 and TNFα concentration in the pig plasma was measured in triplicates by MilliplexR MAP Porcine Cytokine/Chemokine Magnetic Bead Panel (catalog number PCYTMAG-23K 3-plex; Millipore Corporation, Billerica, MA, USA) on a MAGPIX instrument (Linco Research, St. Charles, MO, USA) according to the producer’s recommendation. Regarding assay sensitivities and accuracy, minimum detectable concentrations (in ng/ml) and spike recoveries (%) were as follows: for IL-1β 0.016 and 100%, IL-4 0.035 and 95%, IL-6 0.006 and 92%, IL-10 0.010 and 99%, IL-12 0.004 and 100%, and TNF-α 0.005 and 99%, respectively. Precission (% of CV) was below 8% (intra-assay; n=5) and below 15% (inter-assay; n=3) for all tested parameters. Plasma adiponectin was determined in duplicates (as ‘total’ adiponectin) by Porcine Adiponectin ELISA (catalog number RD59102320R; BioVendor, Brno, Czech Republic) according to the producer’s recommendation. Declared coefficients of variability ranged between 3.73 to 4.23 and 5.84 to 8.37 for intra-assay and inter-assay, respectively. Every plate of the kit contained standards in the range between 2.5 and 100 ng of adiponectin/ml.
Flow cytometry
Subpopulations of myeloid cells in peripheral blood (PB) and VAT, and intensity of expression of selected surface molecules were evaluated. Regarding PB, red blood cells were lysed with ammonium chloride solution (154.4 mM NH4Cl, 10 mM KHCO3, 0.1 mM EDTA, all from Sigma-Aldrich), leukocyte suspension was then washed with cell washing solution (phosphate buffered saline containing 1.84 g/l EDTA, 1 g/l sodium azide and 4 ml/l gelatin, all from Sigma-Aldrich) and the final PB leukocyte (PBL) count was enumerated using hematology analyser BC-2800 Vet (Mindray, Bio-Medical Electronics, Shenzhen, China). The VAT cells were obtained by collagenase digestion as described by Orr et al. (Reference Orr, Kennedy and Hasty2013). In brief, 1 g of the pelvic VAT was cut into small pieces and digested by 6 ml of DPBS/0.5% BSA/10 mM CaCl2 containing 2 mg/ml of collagenase II (Sigma-Aldrich, St. Louis, MO, USA). The incubation was performed at 37°C on a rocker (100 r.p.m.).
Cell (1×10⁶ of PB and VAT cells, respectively) surface molecules for discrimination of myeloid cell subpopulations were stained according to Ondrackova et al. (Reference Ondrackova, Leva, Kucerova, Vicenova, Mensikova and Faldyna2013). Antibody cocktail (10 μl) containing anti-CD14 (clone MIL-2, IgG2b subclass, Serotec, Raleigh, NC, USA), anti-SWC8 (clone MIL-3, IgM class; a generous gift from Dr J.K. Lunney, Animal Parasitology Institute, Beltsville, MO, USA), anti-CD163 (clone 2A10/11, IgG1 subclass, Serotec) and anti-SLA-DR (clone MSA3, IgG2a subclass, VMRD, Pullman, WA, USA) antibodies and 10 μl of heat-inactivated goat serum to block non-specific binding of secondary antibodies were added and the cells were incubated for 20 min at 4°C. The cells were then rinsed, 25 μl of secondary antibody cocktail (goat anti-mouse IgG2b, AlexaFluor647; IgG1, AlexaFluor488; IgG2a, R-PE; all from Invitrogen; and IgM, DyLight405, Jackson Immunoresearch, West Grove, PA, USA) was added and cells were incubated for another 20 min at 4°C. The cells were then rinsed and immediately measured on a BD LSR Fortessa flow cytometer (Becton Dickinson, Franklin Lakes, NJ, USA). At least 200 000 events were acquired. Post-acquisition analysis was performed using FACS Diva Software (Becton Dickinson). Neutrophils, monocytes and macrophages were identified based on their light scatter properties and cell surface expression. Neutrophils, monocytes and macrophages were identified as CD14+/SWC8bright cells, CD14+/SWC8− cells and CD14+/SWC8dim cells, respectively. Percentage of monocyte/macrophage subpopulations were evaluated using CD163 and SLA-DR molecules expression. The intensity of cell surface molecules expression was evaluated as median of fluorescence intensity of CD14, CD163 and SLA-DR molecules.
Fatty acid analysis
The analysis was performed based on the procedure according to Komprda et al. (Reference Komprda, Zorníková, Rozíková, Borkovcová and Przywarová2013) with the following exceptions: Fatty acid methyl esters (FAMEs) were separated using an Fisons GC 8000 Series chromatograph (Fisons Instruments, Milano, Italy) on an DB-23 capillary column (60 m×0.25 mm×0.25 μm; Agilent Technologies, J&W Scientific, Santa Clara, CA, USA). Injector and detector (flame ionization detector) temperature was 250°C and 260°C, respectively. The temperature program was as follows: 140°C/1 min, gradient of 5°C/min to 200°C, held for 1 min, gradient of 3°C/min to 240°C, held for 15 min. The flow rate of the carrier gas (N2) was 1.5 ml/min, pressure 200 kPa, and split ratio 20 : 1. The GLC-455 (Nu-Chek-Prep, Elysian, MN, USA) was used as external standards for FAMEs identification.
Statistical evaluation
For all evaluations, the STATISTICA 12 package (StatSoft, Tulsa, OK, USA) was used. Differences between sets of pigs in live weight, daily weight gain and tissue fatty acid deposition was tested by one-way ANOVA (type of dietary oil was the only factor of variability). Effect of dietary oils on subpopulations of leukocytes (including expression of surface molecules) was measured only in a set of the LPS-challenged pigs (intact pigs were not used) and again one-way ANOVA was used. As far as expression of the receptor genes, cytokine genes, and plasma cytokine and adiponectin level is concerned, an effect of the LPS challenge (in addition to an effect of dietary oils) was supposed, and two-way ANOVA with interaction was used for evaluation, including post hoc Bonferroniʼs test. Homogeneity of variances was confirmed by Bartlettʼs test and least squares means, including pooled standard errors of the mean were calculated. Differences were considered significant at P<0.05.
Results
Behavior, feed intake, live weight, fatty acid deposition
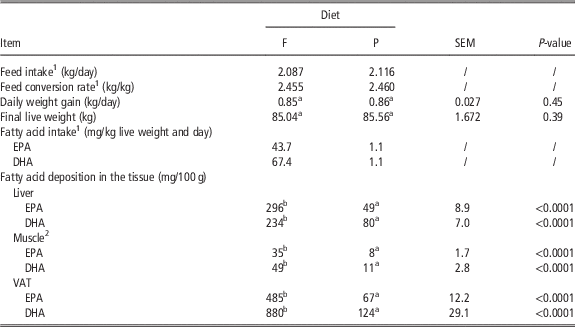
No pig showed any clinical sign of disease during 70 days of fattening (feed intake, behavior, rectal temperature was stable all the time). After the LPS application, all challenged pigs showed signs of septic shock, lying prostrate and trembling, but there were no fatalities. Feed intake, including EPA+DHA intake, feed conversion rate, daily weight gain, final live weight, and EPA and DHA deposition in the tissues, respectively, is shown in Table 1.
Feed intake, live weight, daily weight gain, eicosapentaenoic acid (EPA) and docosahexaenoic acid (DHA) intake, and EPA and DHA deposition in the tissues of pigs fed a diet with 2.5% of fish oil (F) and 2.5% of palm oil (P), respectively

VAT=visceral (pelvic) adipose tissue.
1 Not statistically evaluated; feed intake was measured per pen and only recalculated per individual pigs.
2 Musculus quadriceps femoris.
a,bValues in rows with different superscript letters differ significantly (one-way ANOVA with post hoc Bonferroniʼs test; n=16).
Blood cell numbers, subpopulations of leukocytes and expression of selected surface molecules
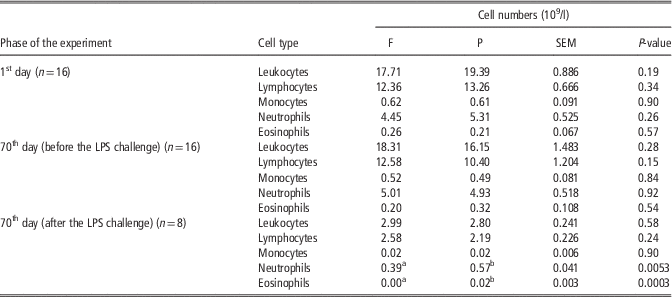
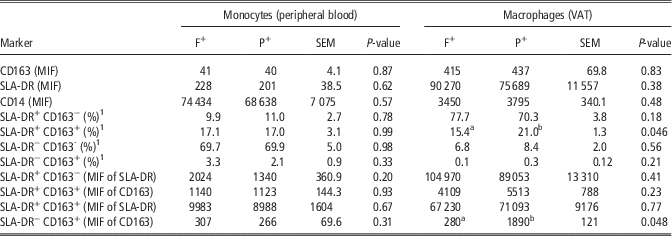
No significant differences (P>0.05) between F and P pigs were established in numbers of any blood cells either 1st day of the experiment or 70th day before the LPS challenge (Table 2). After the LPS challenge, numbers of neutrophils and eosinophils, respectively, were lower (P<0.05) in blood of the F pigs. When expressed as a percentage of the PBL, the LPS-challenged F pigs had lower (P<0.05) ratio of neutrophils (16.8%) in comparison with the challenged P pigs (28.8%); percentage of F- and P-monocytes in the PBL did not differ (0.9% v. 0.7%; P>0.05). Similarly, percentage of macrophages in the VAT leukocytes did not differ between challenged F and P pigs (21.5% v. 19.4%; P>0.05). From all markers tested by flow cytometry in the samples of the peripheral blood and VAT after the LPS stimulation (Table 3), dietary fish oil in comparison with control palm oil decreased (P<0.05) only percentage of the SLA-DR+CD163+ macrophages in the VAT and expression of the SLA-DR−CD163+ surface molecules of the VAT macrophages (quantified as a median of CD163 fluorescence intensity), respectively.
Blood cell numbers in pigs fed a diet enriched with either 2.5% of fish oil (F) or 2.5% of palm oil (P), measured at the beginning and at the end of the experiment (1st day, and 70th day before and after the lipopolysaccharide (LPS) challenge, respectively)

a,bMeans with different superscript letters in lines significantly differ (one-way ANOVA with post hoc Bonferroni’s test).
Subpopulations of monocytes/macrophages and intensity of expression of selected surface molecules after the lipopolysaccharide stimulation in samples of peripheral blood and visceral adipose tissue (VAT) of pigs fed a diet with fish oil and palm oil, respectively

F+=set of pigs fed 70 days a diet with 2.5% of fish oil and subsequently challenged with lipopolysaccharide (LPS; n=8); P+=set of pigs fed 70 days a diet with 2.5% of palm oil and subsequently challenged with LPS (n=8); MIF=median of fluorescence intensity; SLA-DR=swine leukocyte antigen–antigen D related.
1 Percentage of monocytes/macrophages.
a,bValues in rows within a given set (monocytes and macrophages, respectively) with different superscript letters differ significantly at P<0.05 (one-way ANOVA with post hoc Bonferroniʼs test).
Expression of the selected receptor genes
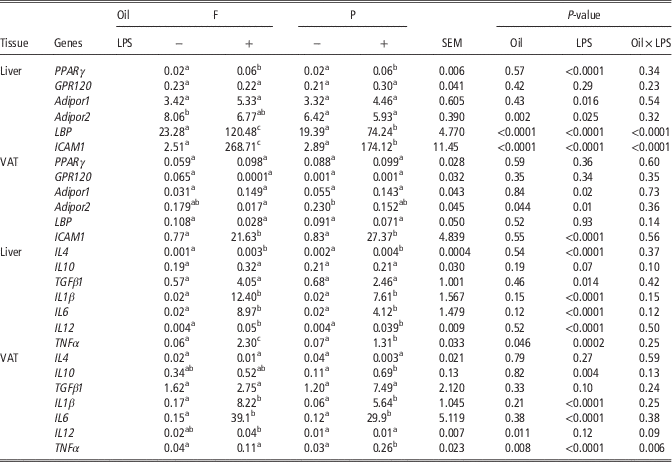
Lipopolysaccharide challenge increased (P<0.05) PPARγ gene expression in the liver of both F and P pigs, but not in the VAT (Table 4). However, no difference between the F+ and P+ pigs were found in either tested tissue (P>0.05). No effect (P>0.05) of dietary oil or LPS on the expression of the GPR120 gene was found either in the liver or in the VAT (Table 4). With an exception of higher (P<0.05) expression of the Adipor2 gene in the liver of the unchallenged F pigs in comparison with the unchallenged P counterparts, neither dietary oil, nor the LPS challenge proved substantial effect (P>0.05) on the expression of the adiponectin receptor genes. In the LPS-challenged pigs, dietary fish oil in comparison with palm oil increased (P<0.05) expression of both the LBP gene and the ICAM1 gene in the liver, but not in the VAT. An effect of LPS on expression of ICAM1 was significant (P<0.0001) in both tissues, but only in the liver as far as LBP is concerned. Similarly, significant interaction oil v. LPS (P<0.0001) was found out in the case of LBP and ICAM1 only in the liver.
Expression of the genes coding for selected cytokines, adiponectin receptor molecules (Adipor1, Adipor2), polyunsaturated fatty acid receptor GPR120, peroxisome proliferator-activated receptor γ (PPARγ), lipopolysaccharide-binding protein (LBP) and intercellular adhesion molecule 1 (ICAM1) in the liver and visceral adipose tissue (VAT) of lipopolysaccharide (LPS)-challenged (+) and unchallenged (−) pigs fed 70 days a diet with fish oil (F) and palm oil (P), respectively

a,b,cValues in rows with different superscript letters differ significantly at P<0.05 (two-way ANOVA with interaction, including post hoc Bonferroniʼs test; n=8).
Cytokines, plasma adiponectin
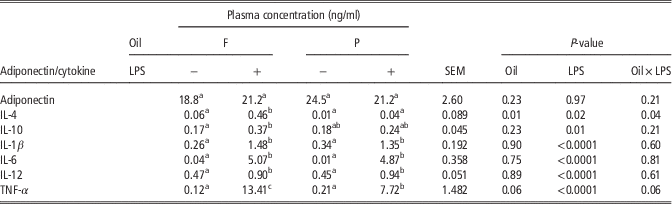
Similarly to the above-mentioned receptor genes, the LPS challenge had a greater effect than the dietary oil also on the expression of the genes coding for selected cytokines (Table 4). In comparison with the unchallenged pigs (F−; P−), LPS increased (P<0.05) expression of most cytokine genes in the liver (except IL10 and TGFβ1) and expression of IL1β and IL6 in the VAT. In the LPS-challenged pigs, fish oil in comparison with control palm oil increased (P<0.05) expression of the gene coding for the pro-inflammatory cytokine TNF-α in the liver, but decreased (P<0.01) expression of this gene in the VAT. On the other hand, expression of the gene coding for another pro-inflammatory cytokine, IL-12, was increased in the VAT of the LPS-stimulated F pigs in comparison with the P counterparts (P<0.05). The above-mentioned ambiguous effect of dietary fish oil on inflammatory markers is also apparent from Table 5: plasma concentration of both anti-inflammatory cytokine IL-4 and pro-inflammatory TNFα was significantly higher (P<0.05) in the F+ pigs in comparison with their P+ counterparts. As far as adiponectin is concerned, neither dietary oil, nor the LPS challenge had significant effect on the plasma level of this hormone (P>0.05; Table 5).
Concentration of adiponectin and selected cytokines in plasma of intact (−) and lipopolysaccharide (LPS) challenged (+) pigs fed 70 days a diet with 2.5% of palm oil (P) and 2.5% of fish oil (F), respectively

IL=interleukin; TNF-α=tumor necrosis factor α.
a,b,cValues in rows with different superscript letters differ significantly at P<0.05 (two-way ANOVA with interaction, including post hoc Bonferroniʼs test; n=8).
Discussion
Body weight, blood cell numbers, monocyte/macrophage phenotypic characterization
Studies in animal models of obesity and limited human trials suggest that consumption of EPA/DHA may contribute to weight loss (Howe et al., Reference Howe, Buckley, Murphy, Pettman, Milte and Coates2014). However, no difference (P>0.05) in the daily weight gain of the F and P pigs established in the present experiment agrees with the results of Chen et al. (Reference Chen, Chen, Li, Wang, Liu, Chang, Wang, Yu, Lin, Mersmann and Ding2012), who reported that DHA oil did not significantly affect the BW gain of weaned pigs as compared with supplementation with beef tallow. In agreement with our results (lower neutrophil and eosinophil numbers in the blood of the LPS-challenged F pigs; Table 2), Upadhaya et al. (Reference Vaisman, Zaruk, Shirazi, Kaysar and Barak2015) reported fewer white blood cells after LPS challenge in pigs fed a diet supplemented with PUFA n-3 in comparison with control.
Proportion of the CD163+SLA-DR monocytes is very low under the physiological conditions, but increases sharply during an inflammatory process (Ondrackova et al., Reference Ondrackova, Leva, Kucerova, Vicenova, Mensikova and Faldyna2013). Therefore, lower (P<0.05) percentage of the CD163+SLA-DR macrophages in the VAT of the F+ pigs in the present experiment (Table 3) indicates a potential of fish oil to ameliorate inflammation. Moreover, decreased (P<0.05) neutrophil ratio in the peripheral blood leukocytes of the F+ pigs found out in the present experiment corresponds to the results of Zhu et al. (Reference Sierra, Lara-Villoslada, Comalada, Olivares and Xaus2016) who reported that fish oil supplementation prevented elevations in intestinal neutrophil numbers induced by the LPS challenge in weaned pigs.
Genes coding for selected receptors, lipopolysaccharide-binding protein and intercellular adhesion molecule 1; plasma adiponectin
Lipopolysaccharide can cause acute inflammation in the VAT of growing pigs (Guo et al., Reference Guo, Liu, Sun, Huang, Albrecht, Zhao and Yang2015); adiponectin, adipocyte-derived hormone, apart from being involved in the regulation of energy homeostasis, cardiovascular diseases and diabetes, is considered an important anti-inflammatory agent (Puglisi et al., Reference Puglisi, Hasty and Saraswathi2011). Within adipocytes, adiponectin is retained in the lumen of the endoplasmic reticulum by binding to ERp44 protein; PPARγ is an essential regulatory factor for the transcriptional activity of ERp44, which in turn controls the secretion of adiponectin (Long et al., Reference Long, Lei, Feng, Yin, Jin, Wu, Zhu, Chen, Gan and Yang2010). Eicosapentaenoic acid/DHA, for their parts, are PPARγ natural ligands, as follows from both human and rodent (mice, rats) studies (Siriwardhana et al., Reference Smit, Patterson, Webel, Spencer, Cameron, Dyck, Dixon and Foxcroft2013). However, a direct effect of PPARγ activation by EPA/DHA to inflammation modulation in pigs has not been described in available literature (according to Lai et al. (Reference Lai, Yin, Li, Zhao, Qiao and Xing2005) the anti-inflammatory properties of dietary conjugated linoleic acid in LPS-challenged weaned pigs are mediated through a PPARγ-dependent mechanism). Similarly, GPR120 was rarely studied in pigs. Feng et al. (Reference Feng, Guo, Kong, Wang, Li, Nyachoti and Yin2012) reported a ubiquitous expression of the GPR120 gene in tissues of different pig breeds, and 96%, 96% and 95% of sequence identity with GPR120 of mouse, rat and human, respectively; however, a direct connection between dietary EPA/DHA, GPR120 gene and inflammation in pigs cannot be found out in available literature. In the present experiment, no significant differences were indicated between the F+ and P+ pigs either in PPARγ, GPR120, Adipor1 and Adipor2 gene expression in the liver and VAT (Table 4) or in plasma adiponectin level (Table 5), respectively. Similarly, Sundaram et al. (Reference Tewari, Awad, Macdonald and Lobo2016) concluded that PUFA n-3 do not play a role in the production of adiponectin at the dietary levels tested in their experiment in mice. Duan et al. (Reference Duan, Li, Li, Fan, Sun and Yin2014) even reported markedly decreased adiponectin concentrations in growing-finishing pigs fed diets with a different PUFA n-6 : n-3 ratio, when a diet with the most optimal ratio (1 : 1) was used. Our findings regarding similar (P>0.05) expression of the LBP and ICAM1 gene, respectively, in both the liver and the VAT of the intact F and P pigs (Table 4) differ from the results of Gessner et al. (Reference Gessner, Gröne, Couturier, Rosenbaum, Hillen, Becker, Erhardt, Reiner, Ringseis and Eder2015), who reported significantly lower mRNA concentration of LBP (0.21-fold of the control) and ICAM1 (0.69-fold of the control) in the liver of the fish oil-fed lactating sows in comparison with the control (palm oil) group.
Expression of the cytokine genes in the liver/visceral adipose tissue; plasma cytokines
Regarding cytokine genes, Cormier et al. (Reference Cormier, Rudkowska, Lemieux, Couture and Vohl2016) reported slightly over-expressed TNFα gene in human subjects supplemented for 6 weeks with 5 g/day of fish oil, which agrees with our findings in the liver of the LPS-challenged (F+ v. P+) pigs, but not of the intact animals (F− v. P−; Table 4). Helmer et al. (Reference Helmer, Cui, Chang, Dewan and Mercer2003) reported an attenuation of gastric mucosal TNF-α protein expression in rats by an intraperitoneal ketamine/xylazine pretreatment. However, we do not suppose this was the case in the present experiment, because to our knowledge, any effect of ketamine/xylazine on TNFα gene expression in pig liver or VAT after the intravenous application was not reported in available literature.
As far as plasma cytokines are concerned, according to Oliver et al. (Reference Oliver, McGillicudy, Phillips, Toomey and Roche2010), EPA/DHA ingestion decreases concentration of pro-inflammatory cytokines (IL-6, TNF-α) and increases concentration of anti-inflammatory cytokines (IL-10, TGF-β1). Similarly, supplementation with PUFA n-3 reduced serum TNF-α in LPS-challenged pigs in an experiment of Upadhaya et al. (Reference Vaisman, Zaruk, Shirazi, Kaysar and Barak2015), which is contrary to our results: higher TNF-α concentration in plasma of the F+ pigs in comparison with the P+ pigs (Table 5). On the other hand, our results (higher concentration of both anti-inflammatory IL-4 and pro-inflammatory TNF-α in plasma of the F+ pigs than in the P+ counterparts; Table 5) agree with the data of Vaisman et al. (Reference Vigerust, Bjørndal, Bohov, Brattelid, Svardal and Berge2005), who reported increased levels of both anti-inflammatory (IL-1β, IL-10) and pro-inflammatory (TNF-α, IL-6) cytokines in LPS-stimulated (and also in not-stimulated) peripheral blood mononuclear cells from PUFA n-3 treated subjects as compared with controls. Petursdottir and Hardardottir (Reference Petursdottir and Hardardottir2007) similarly found out that dietary fish oil increased LPS-induced TNF-α (pro-inflammatory) and IL-10 (anti-inflammatory) secretion by murine splenocytes. Both EPA and DHA increased the release of TNF-α in rat neutrophils in vitro in non-stimulated cells; DHA alone increased IL-1β in the presence of LPS (Paschoal et al., Reference Paschoal, Vinolo, Crisma, Magdalon and Curi2013). These findings are in agreement with the data of Liu et al. (Reference Liu, Shi, Lu, Meng, Zhu, Hou, Yin, Zhao and Ding2009) that ligand induced activation of PPARγ does not ameliorate, but enhances pro-inflammatory cytokine production in weaned pigs subjected to LPS challenge.
It can be concluded that in the present experiment, an amount of EPA+DHA ingested daily by pigs fed a diet containing 2.5% of fish oil (111 mg EPA+DHA/kg W) was able (in comparison with control palm oil) to affect expression of the Adipor2 gene in the liver of the intact animals, but not expression of any other gene coding for receptors involved in EPA/DHA signaling, including plasma adiponectin level. Moreover, effect of fish oil on the tested markers of inflammation was ambiguous regarding both cytokine genes expression and plasma cytokines level. In many cases, effect of dietary oil on the above-mentioned markers was overlaid by an effect of the LPS challenge. Results of the present experiment indicate (in agreement with other animal or human studies) legitimacy of further continuation of the in vivo experiments focusing on relations between bioactive substances in fish oil and acute or chronic inflammation, because their results, contrary to mostly unequivocal in vitro data, are often contradictory or ambiguous.
Acknowledgment
The experiment was supported by the Internal Grant Agency of the Mendel University in Brno, project no. TP5/2015. The authors wish to thank Mrs. Renáta Pavlovičová (Institute of Medical Biochemistry and Laboratory Diagnostics, Prague) for technical assistance.
Declaration of interest
The authors declare no conflict of interest.
Ethics Statement
The experiment was performed in compliance with the Czech National Council Act. No. 246/1992 Coll, the Ammended Act No. 162/1993 Coll, and was approved by the “Commission to protect animals against cruelty” of the Mendel University in Brno and of the Ministry of Agriculture of the Czech Republic.
Software and data repository resources
The data/models regarding the published article are not deposited in any official repository.
Supplementary material
To view supplementary material for this article, please visit https://doi.org/10.1017/S1751731117003767