

INTRODUCTION
On 18 February 2011, Ugandan President Yoweri Museveni won a resounding re-election victory, extending his tenure until 2016, some thirty years after he first seized power. The length of Museveni's reign is striking even by African standards, particularly in light of his 1986 inaugural promise: ‘We [his National Resistance Army (NRA)] shall be here for only four years, after which we shall hand over power to a free and fairly elected civilian government’ (Christopher Reference Christopher2003). Museveni is in many ways a study in contradictions. He has been lauded for his path-breaking policies on universal education, anti-HIV/AIDS, and decentralisation, yet criticised for his record of anti-party sentiments, corruption and, most recently, harsh crackdowns on public demonstrations. This mix of carrot and stick has made Museveni one of the most durable rulers in post-independence Africa.
In the run-up to the 2011 election, however, many of Museveni's opponents sensed that his days might be numbered. Steadily growing support for opposition candidates over the last several elections, well-publicised corruption scandals, deepening rifts within the ruling National Resistance Movement (NRM), and increasing anti-regime disquiet amongst key ethnic groups, seemed to augur poorly for the incumbent. Thus, when Afrobarometer released data from a pre-election survey in December 2010 revealing that nearly two thirds of Ugandans intended to vote for Museveni, the news was met in some quarters with anger or outright disbelief. Subsequent surveys, however, produced similar findings, and their results were eventually confirmed by the outcome of the election: Museveni secured 68·4% of the vote, while his main challenger, Kizza Besigye, garnered 26·0%.
Rather than emerging from this victory with renewed confidence and a strengthened hand, Museveni's hold on power soon seemed more challenged than ever. In the year since the election, Kampala and other urban centres have been roiled by demonstrations. Opposition supporters have taken to the streets, joined by lawyers, women's groups and – perhaps most worrisome for Museveni – the merchant class, primarily (though not exclusively) to protest against skyrocketing prices for fuel and basic commodities.
Ironically, the roots of these troubles, as well as the constraints on the state's capacity to mitigate them, may lie in the president's successful – but very expensive – re-election campaign. By all accounts, Museveni, his government and the NRM spent lavishly during the campaign. State resources purchased everything from extensive advertising to public goods, with reported attempts to buy the political support of powerful local brokers and individual voters through cash disbursements (Izama & Wilkerson Reference Izama and Wilkerson2011: 67–8). In the aftermath, many attributed Museveni's comfortable win to this spending, which, they contended, severely tilted the playing field. Only this spending, many seemed to argue, could explain Museveni's unexpectedly robust performance.
However, while this ‘monetisation’ of Ugandan politics amounted to an undemocratic use of state resources, we find little evidence in public opinion data from before and after the election to substantiate claims that Museveni essentially ‘bought’ re-election. Rather, the 2011 outcome can best be attributed to widespread public satisfaction with sustained economic growth, and especially with the peace dividend enjoyed in the North, alongside discontent with a fractionalised and uninspiring slate of opposition candidates. Self-reported beneficiaries of vote-buying attempts and recently distributed public goods were not significantly more likely to have supported Museveni than their counterparts who reported no such largesse. In other words, the unprecedented level of campaign spending may not have yielded significant electoral gains for the incumbent. But its massive and sudden infusion into the Ugandan economy probably exacerbated the inflationary pressures that became the source of many of the president's woes, and at the same time depleted state coffers constrained the government's capacity to respond. The paradox, and tragedy, is that in the wake of harsh crackdowns on protests and increasing discomfort with dissent, Uganda now appears to be backsliding democratically just a year after an election that was perhaps the most peaceful and representative of the popular will in several decades.
THE RUN-UP: OPPOSITION OPTIMISM
In spite of the generally poor track record for African oppositions, going into the 2011 elections, many opponents of Museveni were convinced that the indicators of an impending electoral turnover in Uganda were positive. This optimism stemmed from three factors. First, Museveni's support had tracked downward over three previous elections. When the first presidential election was held in 1996 under the Movement system, which did not allow parties to compete, Museveni won 75·5% of the vote. His share dropped to 69·3% in 2001 and 59·3% in 2006, in the first election following the 2005 referendum that restored multiparty competition (in a deal that also eliminated presidential term limits). Although the opposition in Uganda has remained divided, the fact that the country uses a two-round system meant that holding the incumbent's share below 50% would provide an opportunity to unite in a second round and achieve victory. Many believed that this downward trajectory indicated that the public was tiring of Museveni.
Second, the opposition saw an opportunity in an apparent rift between Museveni and the Baganda, the country's largest ethnic group. Museveni had won the allegiance of many Baganda when, as commander of the NRA, he fought President Milton Obote, who had sponsored anti-Baganda violence in the Luweero Triangle during the 1980s. His status among Baganda was cemented when he restored traditional kingdoms in 1993; invited the Kabaka (Buganda king), whose late father had been exiled by Obote in 1966, to return to the country; and permitted the restoration of the Lukiiko (Buganda parliament) and other traditional institutions. As a result, the Baganda, who live primarily in the Central Region around Kampala, have thrown the bulk of their votes behind Museveni.Footnote 1
However, two developments may have opened a schism between Museveni and the Baganda. First, in September 2009, the government blocked the Kabaka from attending a ceremony in Kayunga, arguing that since parts of that district had recently announced, unilaterally, secession from Buganda, his presence might spark violence. The perceived insult to the Kabaka was met with outrage, resulting in days of violence in Kampala and Kayunga, and several dozen deaths. Tensions were exacerbated when the government closed the kingdom's radio station, CBS FM, which consistently ranks as the most popular in Central Region, arguing that it had encouraged the violence. The station was only allowed to reopen in October 2010, shortly before the official opening of the election campaign. Tensions subsided following a meeting between the Kabaka and Museveni at State House in late September 2009, but many Baganda, particularly monarchists who have never fully accepted the Ugandan state's authority over Buganda, continued to resent perceived meddling in Buganda affairs.
Potentially even more damaging was the burning of the Kasubi Tombs in March 2010. As the burial place of four Kabakas (and a UNESCO World Heritage Site), the tombs are revered by Baganda. Their loss was seen as a terrible, and suspicious, blow to the kingdom. When Museveni tried to visit the site the next day, protesters initially blocked him, and two people were killed in subsequent violence. An investigation attributed the burning to a deranged individual, and Museveni promised support for rebuilding, but the event was a serious blow to relations between the government and Buganda.
Citing long-term deterioration in the relationship even prior to these events, Uganda expert Aili Mari Tripp (Reference Tripp2010: 120–1) wrote that ‘by 2009, relations between Mengo [the seat of Buganda government] and Museveni's government had reached an all-time low’, and that ‘the handling of the [September 2009] riots by government forces has seriously undermined Museveni's electoral base among the Baganda, a base that he needs to win presidential elections’. Soon after the Kasubi stand-off, Andrew Mwenda (Reference Mwenda2010), editor of the Independent magazine and an influential Ugandan commentator, blogged that ‘in locking horns with Mengo, Museveni may finally be laying down the foundation of his eventual downfall’.
A parliamentary by-election in Mukono North, near Kampala, in May 2010, just weeks after the Kasubi fires, was seen as a bellwether for how Museveni might fare in Buganda in 2011. The Democratic Party (DP), the most pro-Mengo opposition group, ran Betty Nambooze, a former CBS FM host and fervent critic of Museveni, who referred to herself as Omukungu wa Kabaka (the ‘Kabaka's loyal envoy’). Her NRM opponent, Rev. Peter Bakaluba Mukasa, warned voters: ‘If you vote for Nambooze, it will be a vote of no confidence in President Museveni’, and Museveni made several campaign visits in an attempt to save the seat (Kiggundu Reference Kiggundu2010). Nambooze claimed victory with nearly 53% of the vote, leaving many in the opposition increasingly bullish about 2011.
Finally, opposition hopes were boosted further by the perceived high calibre of several candidates. First among them was Besigye, who was making his third attempt at the presidency. A former NRM stalwart and physician to Museveni, Besigye split with the Movement in the 1990s, and thereafter became Museveni's most prominent opponent. He had gained over the two previous elections, increasing his share of the vote from 27·8% in 2001 to 37·4% in 2006.
Others were excited about the candidacies of Olara Otunnu, Uganda's former ambassador to the United Nations and a noted human rights advocate, who ran under the banner of the Uganda People's Congress (UPC), and Norbert Mao, a smooth-talking lawyer, who tried – with some success (Nalugo Reference Nalugo2010) – to present himself as Uganda's Obama. Mao, a northerner who won the nomination of the Buganda-centred DP, had the perceived advantage of being from mixed parentage, with an Acholi father and Munyankole mother, a potentially significant asset in an environment where ethnicity is perceived to play an important role in vote choice.
The opposition attempted to field a single candidate under the banner of the Inter-Party Coalition (IPC), which signed an alliance protocol in 2009. This brought together several parties, including Besigye's Forum for Democratic Change (FDC), the UPC, the Justice Forum (JEEMA) and the Conservative Party (CP). The effort collapsed, however, over the selection of a presidential flag bearer, as well as questions over whether to participate in elections without first winning changes in the composition of the Electoral Commission, which was filled with Museveni appointees (Independent 15.9.2010). Otunnu, whose successful return from a 23-year exile might not have been possible without the support of the IPC, eventually pulled out because of these issues (Mubangizi Reference Mubangizi2010), while the DP never signed on. Nonetheless, many in the opposition calculated that the two-round system reduced the need for a pre-election pact.
THE RESULT: A RESOUNDING OPPOSITION DEFEAT
The opposition's confidence waned during the campaign, and was apparently seriously shaken by the release of the December Afrobarometer survey. Besigye lagged with just 12% of intended votes, Mao and Otunnu languished in low single digits, and other candidates barely registered any support (with undecideds, or those unwilling to say, making up 14%) (Afrobarometer 2010).Footnote 2 Although the opposition and some commentators dismissed the findings and questioned the methodologies and the loyalties of the Afrobarometer (Among Reference Among2010; Kalyegira Reference Kalyegira2010, 2011; Mugerwa Reference Mugerwa2011; Mulondo Reference Mulondo2010),Footnote 3 a second survey conducted in January 2011 (Afrobarometer 2011), as well as surveys commissioned by the state-run New Vision newspaper (Olupot Reference Olupot2011) and by the opposition itself (Olupot Reference Olupot2010), all put Museveni ahead with 65–70%.
These results were borne out with a remarkable degree of accuracy when Museveni took 68·4% of the vote, an increase of over nine points from 2006. Besigye captured just 26·0%, a decline of ten points, while Mao and Otunnu took 1·9% and 1·6%, respectively. None of the other four candidates claimed over 1%. Even in Kampala, long an opposition stronghold, Museveni came within 4,000 votes of topping Besigye, a difference of less than one percentage point. In the meantime, Besigye claimed just four districts: Kampala and three in Teso sub-region. Mao won only his home of Gulu and two neighbouring districts. Besigye appears to have won the votes of many of those who reported themselves to be ‘undecided’ in the Afrobarometer and other surveys, but this was not enough to put him within striking distance of Museveni.Footnote 4
None of the opposition candidates accepted the results. Besigye called the election a ‘sham’, and accused the government of organising a ‘well-planned electoral rigging that we have never seen before’ (Bareebe Reference Bareebe2011). Otunnu said the results were indicative of ‘subjugation and suppression’ and called for protests (Khisa Reference Khisa2011). Mao characterised Museveni as ‘an obstacle to democracy’ under whom ‘elections have become a meaningless ritual’, and called for ‘a campaign of defiance’ (Daily Monitor 22.2.2011). Within a week, these three were calling for peaceful protests to challenge the results. They sought to take advantage of the cracks that appeared in the armour of many long-time incumbents in the wake of the prolonged protests in Cairo's Tahrir Square, which had succeeded in ousting Egyptian President Hosni Mubarak only a week before the Ugandan election.Footnote 5 But these early protests were not sustained and did little more than create some hours of inconvenience in Kampala.
In contrast to these opposition complaints, the Ugandan public was relatively sanguine about the quality of the process, at least prior to the election. In the January 2011 Afrobarometer, 61% said they expected the election to be completely free and fair, or have only minor problems. Similar majorities believed that the Electoral Commission was unbiased (57%), and that security forces were performing in an impartial and neutral manner (60%). More than two thirds (70%) reported that, on the whole, media coverage of all candidates and parties had been either ‘somewhat’ or ‘very fair’. The police got especially high marks for effectiveness in ‘maintaining a secure environment for the elections’ (85% ‘fairly well’ or ‘very well’), and acting fairly in ‘regulating public demonstrations and campaign rallies’ (81% ‘somewhat fairly’ or ‘very fairly’). Ugandans were, however, sharply divided on these issues along party lines: 75% of NRM supporters expected the election to be mostly or completely free and fair, compared with just 33% of opposition supporters.
The findings of international observer missions, and the domestic observer coalition, DEMGroup, with regard to the quality of the elections were decidedly mixed. All agreed that election day went considerably better than in 2006. The European Union Election Observation Mission (EU-EOM 2011a: 2) noted that the campaign was ‘conducted in a fairly open and free environment, in which the freedoms of expression, assembly and association were generally respected’. The Commonwealth Observer Group (COG 2011: 17) pointed to the ‘extremely active national campaigns’, which attracted large crowds and were conducted in a generally peaceful environment, in notable contrast to 2006.
Observers also consistently noted, however, that the process was marred in many locations by administrative problems, and that the large deployment of security forces on voting day had the potential to intimidate voters. None suggested, however, that these problems affected the final tally significantly. Several specifically cited the transparency of the vote-counting process (EAC-COMESA-IGAD 2011; AU Observer Mission 2011), while DEMGroup (2011b) concluded that election day was ‘mostly free and somewhat fair’.
At the same time, most observers fell far short of endorsing the election. The EU and Commonwealth observers strenuously objected to the ‘abuse of incumbency’, the ‘monetisation of the election’, and the ‘commercialisation of politics’ (COG 2011; EU-EOM 2011b). Describing the election as Uganda's ‘most expensive ever’ (EU-EOM 2011b: 19), observers saved their strongest critique for the rampant (mis)use of state resources on the part of the NRM, and the fundamental failure, as a result, to establish a level playing field. Observers described a variety of problems, ranging from blatant vote buying and distribution of ‘vast amounts’ of money and gifts, to ‘other more subtle forms of buying allegiance’ (ibid.), including the use of government projects to secure support for the NRM, and the creation of new districts – sometimes announced by Museveni during his campaign rallies – as outlets for patronage (COG 2011: 25–6).
Critics note that the NRM increased spending in the 2010–11 budget by a robust 16% (Africa Confidential 12.7.2010). On top of this, in January 2011, just halfway through the fiscal year, Parliament approved a Supplementary Budget of USh 602 billion (about US$260 million), of which 85 billion (US$37 million) was assigned to the presidency (EU-EOM 2011b: 24). All told, about US$1·3 billion of the government's budget was spent in January alone (Izama & Wilkerson Reference Izama and Wilkerson2011: 68).
There were widespread suspicions that these funds were allocated largely for campaign purposes.Footnote 6 As part of the Supplementary Budget, each member of parliament (including opposition members) received a disbursement of USh 20 million (about US$8,700). According to the EU-EOM (2011b), there were also widespread reports that ‘most NRM candidates used government projects such as the National Agricultural Advisory Services (NAADS) and the Northern Uganda Social Action Fund (NUSAF) as tools to press voters to adhere to the NRM should they wish to benefit from such projects’, amid widespread accusations that the government spent lavishly on road, school and clinic-building projects, provision of agricultural implements and supplies, and other public-works projects as well. Many also found the government's withdrawal of some US$740 million from the Bank of Uganda during the campaign highly suspicious (Izama & Wilkerson Reference Izama and Wilkerson2011: 68).
Reports cited NRM campaign spending figures as high as half a trillion Ugandan shillings, or about US$200 million, and others go even higher.Footnote 7 The EU-EOM (2011b: 5, 20–5) cited the ‘persistent fusion of the state and the ruling party during the campaign’, concluding: ‘The power of incumbency and state resources were used to such an extent as to compromise severely the level playing field between the competing candidates and political parties.’ In short, while observers generally saw little to support the opposition's claims of massive rigging, EU and Commonwealth observers in particular concluded that Museveni essentially used state resources to buy his re-election. Angelo Izama (Izama & Wilkerson Reference Izama and Wilkerson2011: 68), an experienced Ugandan journalist, concluded: ‘Clever campaign strategies notwithstanding, Museveni won mostly because he threw overwhelming state resources into his campaign.’ DEMGroup (2011a: 10) likewise concluded that ‘the pervasive use of money to decide elections has become an entrenched norm in Uganda’ (emphasis added).
DATA AND ANALYSIS
What went so wrong for the opposition, and so right for Museveni? Did the outcome of the election depend as much on money and ‘incumbent advantage’ taken to the extreme as observers and many commentators suggest? Or did other factors play an equal, or perhaps even greater, role? What of the opposition's confidence in its slate, the public's seeming weariness with Museveni, and the perception of a deep Museveni–Baganda rift? To explore these questions, we draw on data from two Afrobarometer pre-election surveys, as well as two waves of a more geographically limited panel study that focused on Ugandans’ attitudes regarding the campaign.
Afrobarometer data
The first Afrobarometer pre-election survey was conducted in late November and early December 2010, and the second in January 2011. Each nationally representative survey was based on a random sample of 2,000 adults distributed across about half of Uganda's 112 districts, yielding a margin of sampling error of +/ − 2·5% at a 95% confidence level. All interviews were conducted face-to-face by trained fieldworkers in the language of the respondent's choice. Earlier Afrobarometer surveys in Uganda were conducted in 2000, 2002, 2005 and 2008.Footnote 8
Panel study data
The panel study, independently designed by one of the authors, randomly selected approximately 120 respondents from each of nine constituencies distributed around the country.Footnote 9 All four of Uganda's regions were represented, with the constituencies chosen randomly through a stratified process to ensure that all major ethnic groups were significantly represented.Footnote 10 We draw here on preliminary results from two waves of the panel. In the first, 1,072 face-to-face interviews were conducted in November 2010, followed by successful re-interviews with 675 individuals shortly after the elections in late March and early April 2011. While these data are not nationally representative, as the Afrobarometer data are, they nonetheless provide useful perspectives on – and in some cases further confirmation of – Afrobarometer findings.
In particular, contrary to many observers’ and opposition leaders’ conclusions, the two sets of data yield little evidence that reported beneficiaries of the government's massive distribution of resources were significantly more likely to report supporting or having voted for the incumbent. Rather, the surveys provide stronger evidence that Museveni's victory derived from voter unease with the opposition candidates, the relatively robust performance of the Ugandan economy, and a very real sense amongst many northerners that, following the conclusion of the war against the Lord's Resistance Army, they were truly better off than they had been five years earlier.
BUYING THE ELECTION?
As noted, opponents and observers charge the NRM with widely distributing everything from t-shirts, sugar and salt, to motorcycle helmets and envelopes filled with cash, while making use of robocalls, hiring celebrity campaigners, and employing other expensive tactics. Largesse was allegedly distributed in the form of vote buying, a rapid infusion of funds into community development projects in the months preceding the election, and the profligate designation of new districts. We examine each of these in turn.
Vote buying
Vote buying is illegal in Uganda, but reportedly widespread. But does the evidence suggest, as DEMGroup argues, that this practice was indeed a decisive factor in Museveni's success? To begin, Ugandans believe that vote buying is rampant: in late 2010, 56% of Afrobarometer respondents thought that ‘candidates buy votes during elections in this country’, either ‘often’ or ‘always’. But when asked whether they themselves had received a vote-buying offer in the 2011 campaign, the figures are far lower, though still substantial: early in the campaign, in Nov/Dec 2010, 14% said they had received an offer, rising to 17% by late January 2011. Of course, there is likely to be some under-reporting of an activity that is considered at least somewhat illicit. Moreover, the pace of vote-buying offers probably accelerated as election day approached. Thus, these figures almost certainly under-report the actual eventual level of vote buying. As a point of comparison, Bratton (Reference Bratton2008) reports roughly similar levels of vote buying offers (12%) in Nigeria in February 2007, two months before the April 2007 election. But 28% of respondents in Nigeria thought other people in their neighbourhood or village had been offered something in return for their vote.Footnote 11 Bratton concluded that the ‘true’ level of vote buying probably lay somewhere between these two numbers. We make similar assumptions in Uganda, concluding that probably 20–30% of Ugandans received a vote-buying offer during the course of the campaign. This estimate is consistent with findings from the post-election wave of the panel study: approximately one month after the election, 25% of respondents reported that a candidate or party had offered them something during the campaign, while 43% said that they had witnessed such distributions to other people.
In addition to the prevalence of vote buying, we also examine its effectiveness as a political strategy, an issue still much debated among both politicians and political analysts. Several previous studies of vote buying in Africa have produced contradictory results. Kramon (Reference Kramon2009) finds primarily mobilisation effects – what Nichter (Reference Nichter2008) refers to as ‘turnout buying’ – arguing that vote buying boosted turnout in the 2002 elections in Kenya, and Vicente (Reference Vicente2008) reports similar findings for São Tomé e Príncipe. Bratton (Reference Bratton2008) meanwhile finds that in the 2007 Nigerian election, vote buying probably depressed turnout by at least a small amount, but concluded that the tactic was ‘effective’ in the sense of at least modestly increasing the buyers’ vote share. Vicente (Reference Vicente2008), in contrast, found that vote buying specifically favoured challengers over incumbents. The message, in short, is that even if vote buying appears to be relatively widespread, neither its purpose nor its impact can be taken for granted; rather, political and social contexts appear to shape the influence of vote-buying efforts on electoral outcomes (Kramon Reference Kramon2009).
Bratton (Reference Bratton2008) has defined voters’ options when faced with a vote-buying offer as refusal (rejecting the offer), defection (accepting the offer and voting for the candidate of one's choice), or compliance (accepting the offer and voting as instructed by the buyer). When Afrobarometer asked Ugandans how they would respond to offers of money in exchange for their vote, 76% reported that they would defect, while another 19% claimed they would refuse the offer. A mere 4% said they would comply. The figures shift slightly when respondents are asked what ‘other people in your neighbourhood or village’ would do, but the overall pattern is similar: 66% believe others would defect, compared with only 7% who believed others would comply (18% were unsure). Those who reported actually receiving an offer were less likely to say they would refuse the money (12%), compared with those who had not (21%), but no more likely to say that it would actually affect their vote. The low reported impact of vote buying could reflect some social desirability bias, but further analysis confirms the tactic's lack of significant effectiveness.
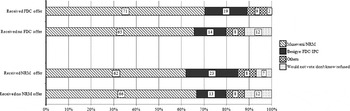
Consistent with the prevailing storyline, Afrobarometer finds that the NRM is reported to be the source of a substantial majority (67%) of vote-buying offers, and 82% of those who reported receiving any offer identified the NRM as at least one source (10% did not identify the sources; 25% reported multiple offers).Footnote 12 FDC made 20% of the offers (a total of 25% who received an offer identified FDC as at least one source), while UPC and DP trailed at just 5% each. But those who reported receiving an offer from the NRM were actually slightly less likely to say that they intended to vote for the ruling party than those who had not received any offer (Figure 1). Those who said they had received an offer from FDC, in contrast, were more likely than others to say they would vote for the FDC, but also more likely to say they would vote for the NRM (and much less likely to refuse to answer the question). Similarly, in the post-election panel, self-reported voters were not significantly more likely to say they voted for Museveni if they received an offer from the NRM (81%) than if they did not (77%), although, consistent with the turnout-buying thesis, we did find that recipients of vote-buying offers from the NRM were more likely to report having voted (92% vs 84%). The Afrobarometer data, however, reveal no significant differences in intention to vote between those receiving offers from either the NRM or the opposition, and non-recipients. Moreover, the fact that the actual election outcome closely corresponded to voting intentions as revealed in several surveys suggests that turnout effects – e.g. depressed turnout among discouraged, intimidated or unrewarded opposition supporters – were not a significant factor.
Voting intentions relative to vote buying offers.
Source: Afrobarometer, January 2011.
‘If a presidential election were held tomorrow, which party's candidate would you vote for as president?’
Weighted Ns: Received no NRM: 1,712; received NRM: 288; received no FDC: 1,916; received FDC: 84.
Unweighted Ns: Received no NRM: 1,700; received NRM: 299; received no FDC: 1,909; received FDC: 90.

The evident ineffectiveness of vote buying cannot be explained by the way in which the offers were targeted. Early in the interviews, Afrobarometer respondents were asked, ‘Do you feel close to any particular political party?’ and, if yes, ‘Which party is that?’ Sixty-two per cent reported feeling close to the NRM, 13% to the FDC, and 7% to other parties; 9% were not close to any party. Importantly, these questions were asked well before questions about vote buying, and we assume that whether or not an offer affected a vote, it is unlikely to alter an individual's reported closeness to a party.
When we compare party affiliation to the distribution and effects of vote-buying attempts, we find that only 29% of the NRM's reported offers went to opposition partisans. Of these opposition partisans who received an NRM offer, only 1% reported an intention to vote for Museveni; in the meantime, 5% of opposition partisans who did not receive an NRM offer reported an intention to vote for Museveni.Footnote 13 Opposition offers seem similarly ineffective. Of offers made by the opposition, 64% were directed at individuals affiliated with the NRM. But fewer than 3% of those NRM partisans who received an opposition offer said they would vote for an opposition candidate, compared with 2% of NRM partisans who did not receive an opposition offer. We thus find no evidence to suggest that the NRM's (or any party's) efforts to buy votes changed voter intentions or gave the party any significant advantage over its competitors, at least in the presidential race.
Public goods
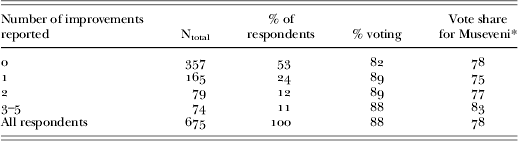
The post-election panel study also gathered data on the provision of public goods in the pre-election environment, and the results are again interesting primarily for what they do not reveal, i.e., the lack of any demonstrable impact of recent public goods provision on vote choice. Respondents were asked whether their village or neighbourhood had benefited from new or improved services in any of the following sectors in the previous six months: schools, health clinics, roads, water delivery and sanitary facilities. The accusation that these distributions were widespread appears to hold up: among the 675 respondents on this question, fully 47% reported at least one improved service (Table 1), a remarkably high rate of investment. One third (33%) reported new or improved roads in their area, 18% schools, 14% water supplies, 12% clinics, and 9% sanitary systems.
Provision of pre-election public goods and vote choice
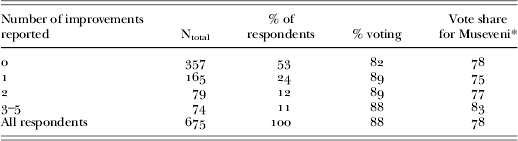
Source: Panel study, post-election wave, March/April 2011.
‘In the last six months, has your village or neighbourhood benefited from any of the following: (a) a new or renovated school; (b) a new or renovated health clinic; (c) new or improved roads; (d) new or improved water delivery; (e) new or improved sanitary facilities?
* This is the vote share only among those in this group who say they voted in the election.
But the lack of effect on vote choice is notable. Those who benefited from one improvement are actually slightly less likely to identify themselves as Museveni voters, and those who received two or more improvements are only marginally different from those who received none.Footnote 14 As shown in the fourth column of Table 1, those who did not benefit from any improvements may have been slightly less likely to vote, so receiving public goods may have had a modest mobilisation effect.Footnote 15 But this analysis offers no significant evidence that public goods outlays were an effective tool for boosting Museveni's support.Footnote 16
Districtisation
In addition to vote buying and targeted public goods provision, the NRM has also been accused of ‘purchasing’ support through an innovative strategy: the proliferation of local government districts. When Museveni took office in 1986, there were just thirty-three districts in Uganda, but in the last decade alone, his government doubled the number, from 56 in 2000 to 112 by the time of the 2011 elections. This rapid process of ‘districtisation’, as Ugandans have dubbed it (Green Reference Green2011), has made Uganda one of the most densely administered countries in Africa and indeed the world, with more first-level administrative units than any other country. While the stated impetus for district proliferation has been a need to improve governance, Green (Reference Green2010) finds little evidence to support this. Rather, he argues that districtisation has served as an effective means for expanding Museveni's patronage network (see also Tripp Reference Tripp2010).
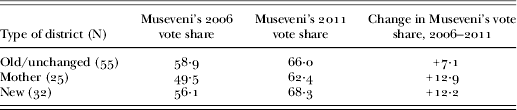
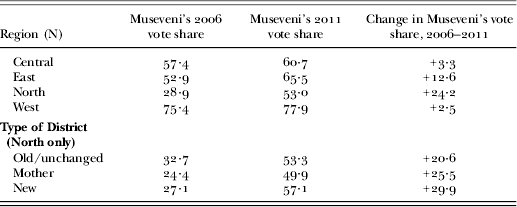
Of the eighty districts that existed at the time of the 2006 elections, twenty-five were sub-divided (some more than once) into fifty-seven districts; the other fifty-five were unaffected. But the aggressive creation of new districts had only modest impacts on electoral outcomes. Table 2 shows the change in Museveni's vote share across ‘new’, ‘mother’ and ‘old/unchanged’ districts between 2006 and 2011.Footnote 17 While there was a large increase in Museveni's vote share across all three groups, his share increased by approximately an additional five percentage points in new and mother districts relative to districts that saw no change. Since just over one third (37%) of all registered voters live in new or mother districts, this translates at the national level into a roughly two-point increase in Museveni's national vote share potentially due to districtisation, out of a total increase of 9·1 points. In short, districtisation appears to have helped Museveni, but the effects were quite modest; there is nothing to suggest that he would not have done quite well even in its absence. As with vote buying and public goods outlays, the evidence does not support the contention that these investments played anything like a decisive role in Museveni's re-election. We thus conclude that the foundations of Museveni's 2011 success lie elsewhere, and turn to an exploration of alternative explanations.
Effects of districtisation on vote share
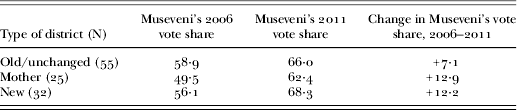
Note: ‘Mother’ indicates districts from which new districts split. For example, in 2011, Nwoya District was created by breaking Nwoya County from Amuru District. In this case, Amuru, which kept the existing district centre, is the ‘mother’ district, while Nwoya is the ‘new’ district, with a new district centre.
OPPOSITION WEAKNESS
We begin by asking whether the opposition was really fielding as strong a slate of candidates as it supposed. Our findings are not especially encouraging for the opposition. The first hurdle for any non-incumbent is name recognition. In Uganda, given the relative strength and number of independent media outlets, the deck was not stacked as decisively against the opposition as in many other countries. In the print sector, the privately owned Monitor (daily) and Observer (weekly) compete with the state-owned New Vision (daily). And dozens of private radio and TV stations fill the airwaves, offering a wide array of alternatives to the state-run Uganda Broadcasting Corporation (UBC).
Even so, survey data suggest significant gaps in candidates’ abilities to achieve basic name recognition. Fully 91% of Afrobarometer respondents could name two candidates, and 66% could name three (the maximum number allowed by that survey), suggesting that most Ugandans could name at least a couple of alternatives to Museveni. Results from the panel survey (in which there was no limit to the number of candidates respondents could list),Footnote 18 however, suggest that, apart from Museveni and Besigye (96% and 74% recognition, respectively), no other candidate was widely known enough, at least at the campaign's outset in November, to be considered a serious contender: only 36% named Otunnu, 33% Mao, and 29% Beti Kamya, of the Uganda Federal Alliance.
But the news for the opposition gets worse. In order to be successful, a challenger needs not just name recognition, but a positive public image as well. Yet generally speaking, opposition parties in Africa do not enjoy significant public confidence; they are often ranked as among the least-trusted political institutions, falling well behind ruling parties (Logan Reference Logan2008). Uganda is no exception: in the December 2010 Afrobarometer, 60% expressed trust in the ruling party, while just 39% trusted opposition parties.
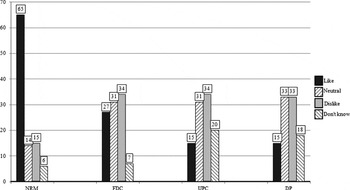
Nor did opposition parties fare well individually. Afrobarometer respondents were asked to say whether they liked, disliked or felt neutral about each of the major parties. The dismaying results for the opposition are shown in Figure 2: no more than one quarter of respondents express a liking for any major opposition party, and for both UPC and DP the numbers were far lower, and far below the portion who expressed dislike. The only good news for the opposition in these numbers was the relatively high number who were either neutral, or did not know, suggesting that many Ugandans had still not formed opinions about specific opposition parties.
Popular Assessments of Ruling and Opposition Parties.
Source: Afrobarometer Uganda Round 4.5.1 survey, Nov./Dec. 2010.
‘What do you think about each of the political parties participating in the forthcoming elections? Please say whether you strongly dislike, dislike, feel neutral about, like, or strongly like that party.’

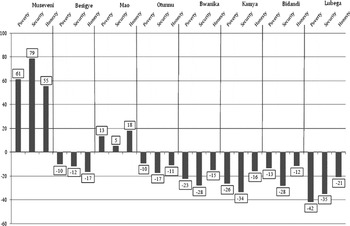
These results were confirmed by the findings of the first panel wave. If respondents could name a candidate, they were then asked to rate how effective that candidate would be at reducing poverty and improving security, and his or her honesty. The opposition candidates consistently fared far worse than Museveni. All of the opposition candidates except Mao started the campaign with net negatives, that is, more people rated them unfavourably than favourably on these grounds (Figure 3). Moreover, even among those respondents who named the opposition candidates, large numbers could not express an opinion about their honesty or abilities.
Net favourable or unfavourable ratings of candidates.
Source: First wave of panel study, Nov. 2010. Figures reflect the views only of those who could name a given candidate.
‘In your opinion:
– how capable of reducing poverty is [named candidate]?
– how capable of improving security is [named candidate]?
– how honest is [named candidate]?’
Response options: very/somewhat/not very/not at all/don't know.

Finally, panel respondents were also asked to name the most important issue facing the country, and identify which candidate would be most capable of dealing with that issue. Again, Museveni was the overwhelming favourite: 61% identified him as most capable of addressing their priority issue, while all other candidates fall below 10%. The panel also asked respondents to name the party they trusted most to deal with specific development tasks. On issue after issue – land reform, wealth distribution, fighting terrorism, creating jobs, public service provision and controlling prices – the answer was: the Movement. On average, 64% named NRM, compared with 8% for FDC, and 3% each for DP and UPC – well below the 7% who said ‘none of them’ (14% didn't know).
In sum, the opposition started the campaign at a severe disadvantage in terms of public perceptions, and over the course of the campaign its candidates demonstrated little success in overcoming these deficits. Indeed, they seem to have lost ground. When Afrobarometer asked in its first pre-election survey whether ‘the opposition has presented a convincing vision and plan for Uganda’, versus whether ‘the opposition has not shown that it has the plans to solve the country's problems’, Ugandans were evenly split between the two positions (45% vs 44%). When the same question was asked again in January 2011, an 11-point gap had opened; 53% reported that the opposition was not presenting a convincing alternative vision, compared with just 42% who thought it did. It appears that Besigye, Otunnu, Mao and the others were having little success in convincing the Ugandan public that they were ready to take the helm.
Several post-election commentators cited these issues as key reasons for the opposition's dismal performance. Mwenda (Reference Mwenda2011) noted that Besigye failed to convince voters that he had solutions to their immediate concerns, while Museveni excelled at this:
Where Besigye projected himself as a national statesman, Museveni positioned himself as a local politician. Where Besigye articulated a grand, national vision, Museveni focused on mundane local issues. Besigye came across as idealistic with a high sense of morality; Museveni was realistic, pragmatic and practical if not opportunistic.
A voter echoed this sentiment, suggesting that Besigye's focus on possible electoral malfeasance was misguided: ‘Besigye forgot that he has to get the vote first before concentrating on protecting it’ (Were Reference Were2011).
But were these poor perceptions of the opposition yet another manifestation of Museveni's incumbency advantage, via his dominance of the media? Positive coverage of the president clearly dominated the state-controlled media, with some radio stations even refusing to air opposition advertisements (Oluka Reference Oluka2010). Still, it should be noted that Uganda's radio environment remained relatively pluralistic, despite these pressures. Moreover, although survey data are imperfect for measuring the effects of media exposure on vote choice,Footnote 19 they offered a revealing first cut, and show no positive link between media exposure and support for Museveni. Focusing on radio, which reaches the widest audience, we actually found a modest decrease in support for Museveni as consumption of radio news increases. In the second Afrobarometer survey, 64% of those who reported listening to radio news several times a week or more said they planned to vote for Museveni, compared with 70% who listened less frequently. Moreover, frequent radio listeners rated the opposition as more credible (43%) than less frequent listeners (35%). Similarly, in the post-election wave of the panel, two thirds (67%) of voters who listened to radio news every day or almost every day reported voting for Museveni, against 73% of those listening less often.Footnote 20 In short, there is little evidence to suggest that media bias can explain Museveni's electoral success.Footnote 21
BUGANDA HOLDS STEADY FOR MUSEVENI
The opposition also significantly overestimated the depth of the rift between Museveni and Buganda. Ultimately, the incumbent won twenty-two out of twenty-three districts in the region, and his vote share increased from 57·4% in 2006 to 60·7% in 2011 (although it was down from 64·6% in 2001). For the third election in a row, the best-performing opposition candidate in Buganda was Besigye, who won 30·5% of the vote there, down from 35·7% in 2006 and 32·0% in 2001. The DP, long the favourite of Baganda monarchists (Carbone Reference Carbone2008: 12–13), also underperformed. The party's controversial nomination of Mao, a non-Muganda, exacerbated existing schisms within the party, and may have backfired. In the end, Mao won only 2·2% of the vote in Buganda, down from the 2·7% that DP candidate John Ssebaana Kizito won in 2006.
MORE WAR WEARY THAN MUSEVENI WEARY
Finally, we recall the opposition's hope that the downward trend in Museveni's vote share over three previous elections suggested that the Ugandan public was growing weary of his rule. Afrobarometer data suggest that this hope, too, was misplaced.
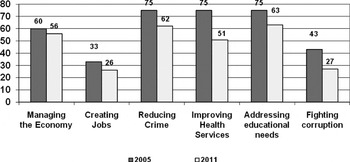
It is true that overall ratings of government performance dropped between 2005 and 2011, often substantially (Figure 4). Across six key performance areas, ratings were down in all, sometimes by wide margins.Footnote 22 At the same time, Uganda had experienced relatively strong economic growth despite the global economic downturn.Footnote 23 This is reflected, albeit relatively modestly, in respondents’ improved ratings of the country's general economic condition, as well as their own economic status. Some 43% rated their own present living conditions as ‘fairly good’ or ‘very good’ in January 2011, up from 35% in 2005, while the number rating their situation as ‘fairly bad’ or ‘very bad’ dropped to 41%. Perhaps more significantly, when asked at the start of the survey about the overall direction of the country, nearly two thirds (64%) averred that it was ‘going in the right direction’ (and among these, 76% said they would vote for Museveni). In short, despite weak performance in some sectors, the country's general economic successes appear to have favoured Museveni, perhaps strongly. But there also appears to be more to the story that government performance alone cannot explain. Further analysis reveals the additional factor is probably Museveni's success, finally, in bringing the war in the North to an end.
Government performance, 2005 and 2011.
Source: Afrobarometer.
‘How well or badly is the government handling each of the following matters, or haven't you heard enough to say? (% fairly well/very well)?’

The opposition had largely taken the North for granted, assuming that it would remain an electoral stronghold. The question, they thought, was whether the IPC or the DP would dominate there, not whether Museveni and the NRM would. The DP had hoped that Mao would bring a substantial block of northern votes into its formerly Buganda-centred orbit. However, Mao won only 5·9% of the northern vote, taking just three districts and even underperforming in his ethnic home of Acholiland (29·4%). The DP label probably did not benefit Mao: in the two Afrobarometer pre-election surveys, just 8–11% of northerners said they ‘like’ or ‘strongly like’ the DP, compared with 39–42% with negative views. In short, the DP strategy may have doubly backfired, undercutting the party's legitimacy in its Baganda base, while limiting Mao's appeal even within his home region. Besigye also underperformed. A Munyankole from the West, he swept the entire North, save Karamoja, in 2006, when he took 58·7% of the vote to Museveni's 36·4%. But in 2011, Besigye's share plummeted to 25·1%, and he captured just three districts: the northern vote swung heavily to Museveni, who took a majority (55·6%) there for the first time.
Museveni's gains in the North (+24·2 points), which built on what had previously been a very low base, were many times higher than his gains in the West and Central Regions (+2·5 and +3·3 points, respectively), and go a long way to explain his nationwide gain of 9·1 points over 2006 (although he also gained 12·6 points in the East) (Table 3). The second part of Table 3 is particularly revealing, as it compares the breakdown within the North between ‘new’ or ‘mother’ districts and old/unchanged districts. It is clear that although districtisation had positive effects, as we saw earlier (+5 points for ‘mother’ districts in the North relative to old, and +9 points for new districts), the effects of being a northern district (+21 points relative to being from Central or Western Region) are significantly greater.
Gains in Museveni's vote share, 2006–2011, by region
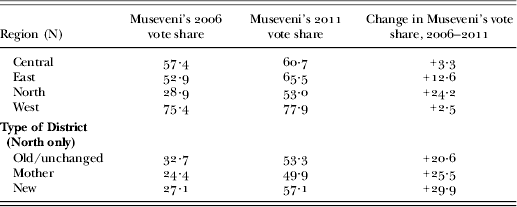
This large ‘northern effect’ suggests that much of the explanation for Museveni's improved performance in 2011 lies in the waning of hostilities against the Lord's Resistance Army since 2006. Evidence from successive Afrobarometer surveys suggests that levels of hardship in the region have since dropped markedly. In 2005, fully 46% of northerners reported having gone without enough food ‘many times’ or ‘always’ in the past year, a figure that plummeted to just 7% in January 2011. Similarly sharp declines were evident in reported lack of access to clean water for household use (37%, down to 9%) and medical treatment (49%, down to 25%). While life is still considerably more difficult in the North than elsewhere, these improvements were nonetheless reflected in significantly stronger pro-government sentiments in the region in 2011 than in 2005. As a consequence, Museveni's approval ratings climbed from 63% in 2005 to 79% in 2011. Most northerners could look back and say that their lives had improved over the last five years, and they appear to have rewarded Museveni accordingly.
THE FEAR FACTOR
Finally, it is worth looking at one other factor that some believe shaped the outcome in Uganda: fear. Numerous instances of violence were reported in 2006, including disruption of opposition rallies, and government harassment of opposition candidates was commonplace. By all accounts, the environment in 2011 was markedly different. Although observer reports and political analysts have noted concerns about the excessive visibility of security forces on election day, for the most part fear and intimidation were not viewed as decisive factors in 2011, in the way they may have been in 2006.
But does this perhaps paint an overly rosy picture of 2011? Overt violence and intimidation were certainly far less evident than in 2006, but ominous rumours circulated during the campaign that NRM stalwarts were making lists in each community of who supported the party, and who did not. The NRM party primaries in summer 2010 were marred by multiple violent incidents. And what lessons might Ugandans have learnt from their Kenyan neighbours and Ivorien cousins about what would happen if Museveni lost? Could fear of the implications of an opposition win have led Ugandans to opt instead for continuity? Evidence from the Afrobarometer surveys suggests that the public was concerned about the possibility of post-election violence, and a significant minority expressed fear of intimidation during the campaign. But also importantly, we observe few measureable effects of these concerns on planned vote choice. And perhaps most importantly, Ugandans expressed extremely high confidence in their freedom to vote as they choose, a critical indicator of a lack of intimidation.
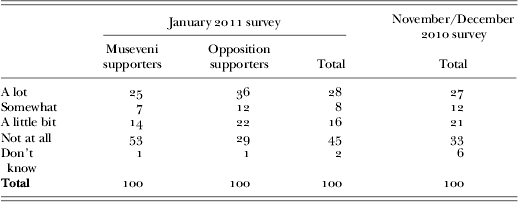
When asked in the January 2011 Afrobarometer survey ‘how much do you personally fear becoming a victim of political intimidation or violence’, 45% said not at all, an increase from 33% just six weeks earlier (Table 4). But a not insubstantial 37% feared such victimisation either ‘somewhat’ or ‘a lot’; the number rises to 48% for opposition voters. But importantly, the evidence does not suggest that fear was leading people to switch their votes to Museveni. Just 15% of those who did not fear violence at all intended to vote for the opposition, compared with 29% of those who feared violence ‘a lot’ – i.e., the opposite result from what we would expect if fear and intimidation were forcing voters towards Museveni. Moreover, 85% said the police were doing ‘fairly well’ or ‘very well’ at maintaining a secure environment, and 81% said they were behaving fairly in regulating campaign rallies and public demonstrations. In short, a majority of Ugandans may have been reassured by police presence rather than intimidated by it.
Fear of political intimidation or violence
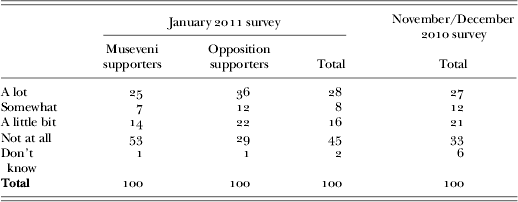
Source: Afrobarometer, January 2011, November/December 2010.
‘During the campaign for the 2011 elections, how much do you personally fear becoming a victim of political intimidation or violence?’
What about fear not of personal consequences, but of potential implications for the country if Museveni lost? Ugandans were close observers of the inter-ethnic violence following Kenya's disputed 2007 elections, and the violent aftermath of incumbent Laurent Gbagbo's refusal to accept defeat in Ivory Coast's November 2010 run-off was still being played out at the time of the Ugandan election. Did Ugandans take these ‘warnings’ to heart, and rally behind Museveni because they believed that he might not step down willingly, leaving them little real choice if they did not want to follow the same chaotic path as Kenya and Ivory Coast?
The Afrobarometer surveys asked respondents about the perceived likelihood of trouble in the aftermath of the elections. In November/December 2010 – before any other surveys had been released indicating a strong likelihood that Museveni would win easily – 73% said they thought it was somewhat or very likely that losers would refuse to accept the results, and 59% felt it was somewhat or very likely that there would be post-election violence. By January these numbers had moderated – perhaps as the likelihood of an easy Museveni victory was increasingly recognised. Still, 63% at this point thought the losers would reject the results, while 50% feared a violent aftermath.
But again, we find that rather than driving voters into the arms of the incumbent, these views tend to be expressed more often by opposition supporters. Those who thought post-election violence was likely were almost twice as likely to say they would vote for the opposition (30%) as those who were less concerned (16%). This suggests that opposition supporters were perhaps more fearful, but that they nonetheless stuck with their intentions to vote for opposition candidates despite these concerns. And perhaps most significantly, fully 76% reported that people were ‘completely free’ to ‘choose who to vote for without feeling pressured’, while another 15% felt ‘somewhat free’. Despite concerns about the election environment, especially on the part of opposition supporters, the vast majority of Ugandans had a remarkable degree of confidence in their ability to make their own choices.

The narrative of Uganda's 2011 election, from the perspective of the press and election observers, was the money. The ‘unprecedented’ quantity of funds dumped into election spending produced descriptions focused on the ‘monetisation’, ‘commercialisation’ and, in short, purchase of the election. The clear implication has been that were it not for abuse of incumbency advantages, Museveni might by now be the former president of Uganda. Survey data, however, tell a different story. The NRM's distribution of largesse was not a deciding factor in rallying voters to Museveni, but rather the icing on the cake for a strong contingent of supporters already committed to extending his tenure for other reasons. Contra Wantchekon's (Reference Wantchekon2003) finding that local and clientelist appeals are more effective tools for capturing votes than broad national appeals, our findings suggest that Ugandans’ eyes were focused more on the bigger picture. Museveni's success in settling the war in the North, and in keeping the economy largely on track, had not just preserved his status among Ugandans, but enhanced it considerably, especially in the North. At the same time, the opposition failed to convince the public that it was preferable. The press, Ugandan elites and much of the international community may have grown weary of Museveni, but the average Ugandan had not.
Northerners in particular were weary after decades of war. However culpable Museveni might have been for the fighting's long duration, he nonetheless appears to get credit for its resolution, and the return, finally, of peace and relative prosperity to the North. Put simply, northerners’ lives had improved over the previous five years, perhaps dramatically, and they rewarded Museveni accordingly. This appears to be the largest single factor that allowed Museveni not just to hang on in 2011, but to gain considerably relative to 2006. At the same time, faced with an unconvincing slate of alternatives, alongside continued stability and steady growth in the economy, most Ugandans elsewhere in the country likewise opted to preserve the status quo rather than risk an alternative. This does not mean that they did not see the weaknesses and failures of Museveni's government – witness the declining performance ratings he received for fighting corruption and providing social services amidst rising popular expectations. But the evidence suggests that despite whatever failures they attributed to Museveni, and any drawbacks they might see to extending his reign, overall, in the public's eyes the balance still came out very much in his favour.
In the end, the large quantity of resources dumped into the election played a bit part rather than a starring role. While vote-buying attempts may have been fairly common, the evidence suggests that they had limited impact. Ugandans apparently have enough confidence in the secrecy of the ballot box to accept ‘gifts’ from politicians and then vote as they please. And the disbursement of public goods prior to the election likewise had little obvious effect on voters. Substantial investment in new districts appears to have paid off in a marginal increase in Museveni's share – perhaps enough to have mattered had the election been close, but hardly a decisive factor given his wide margin of victory.
To be very clear, this is not to suggest that the election environment was therefore ‘fair’. While large majorities – primarily Museveni's supporters – did in fact rate it so, many opposition supporters rightly noted that there was significant, even extreme, bias in media access, widespread distribution of state resources, and, for them, an election environment shaped by at least some degree of fear and intimidation. But the evidence gathered from interviews with more than 5,000 Ugandans indicates that these factors were not changing votes. Ugandans told us (early in the interviews) which party they were ‘close’ to, and the vast majority of them revealed (late in the interview) that they intended to vote for this same party, despite whatever exposure to ‘other influences’ they experienced. In other words, there was no disconnect evident between their individual party preferences and voting intentions. Rather, Ugandans made their decisions based on other factors, and neither money nor fear seemed to have much power to change their views. Despite whatever dangers or imbalances may have existed, Ugandans evidently felt quite free both to express their concerns where they existed, and ultimately to vote as they liked.
Ironically, Museveni's profligate, and evidently unnecessary, campaign spending may now be undermining his more important strength: his ability to manage the economy over the long term. The cash infusion has probably contributed to local inflation. And if there is any truth to the claims that the government is now nearly broke, Museveni's ability to buffer the impacts of the rising global food and fuel prices that have recently threatened so many governments is constrained. In fact, more recent public opinion data suggest that Museveni's standing with the public suffered as a result of the economic challenges, including double-digit inflation, that the country faced in the year after the election. While 48% of respondents in the January 2011 Afrobarometer survey evaluated the country's economic condition positively, about twelve months later that figure dropped to 18%.Footnote 24 Similarly, in January 2011 57% of respondents stated that the government was doing ‘fairly well’ or ‘very well’ managing the economy; a year later, that figure plummeted to 18%.Footnote 25 Probably as a result, the share of respondents who reported that they would vote for the NRM ‘if a presidential election were held tomorrow’ dropped from 65% in the weeks before the February 2011 election to 47% in early 2012.
Still, the opposition was apparently unable to capitalise significantly on this slide in support for the president and the NRM. In January 2011, 23% indicated that they planned to vote for an opposition presidential candidate, but this figure only climbed to 28% a year later, despite the NRM's loss of support. These additional data further bolster two of the central findings of this paper. First, Museveni's level of support does seem to be related to Ugandans’ evaluations of the economy. Second, Ugandans do not seem to view any of the existing opposition parties as viable alternatives to the incumbent, even with growing dissatisfaction with his performance.
Indeed, despite his large victory, Museveni was deeply disconcerted by increases in public dissatisfaction over these issues. By April 2011, protests over rising food and fuel prices, dubbed the ‘Walk to Work’ campaign, were gaining momentum. All three of the leading opposition candidates were arrested and detained at least briefly. Besigye was detained several times, shot in the hand during one event, and beaten at another. The heavy-handed response bespoke a surprising lack of confidence for a government that had just secured a resounding re-election victory. Walk to Work never attracted a mass following, but was followed by further urban protests, particularly in Kampala, over issues such as democratic freedoms and inflation.
But what do the campaign and its outcome tell us about the state of democracy in Uganda more generally? The outlook is very mixed. For Museveni's challengers, and local and global democracy activists, the fact that the opposition lost rather than gained ground may not bode well for Uganda's development as a competitive, multiparty democracy. While that is certainly to a significant extent due to the opposition's own failures and divisions, it also reflects how entrenched and hegemonic the Museveni regime has become. The prospects for change in the near future seem limited at best.
But there are also reasons for democrats to be somewhat more sanguine. First, we cannot discount the 2011 election result without acknowledging that it reflects that many Ugandans – probably a solid majority – do think Museveni has made their lives better. The evidence suggests that Museveni won the election not because of fear and intimidation, or because of the abuse of his office, misuse of government resources and profligate vote buying, but because Ugandans wanted that outcome. Although Museveni's re-election raises many questions, it is of critical importance that, despite everything, the vast majority of Ugandans, including most of those who planned to vote for the opposition, reported that they were indeed free to vote as they pleased. It appears that, by and large, in February 2011 Ugandans were voting their own hearts and minds, not their fears, and not according to the demands of others.