





The WHO currently recommends ‘In both adults and children, the intake of free sugars should be reduced to less than 10 % of total energy intake’ (1,p.4), and ‘A reduction to less than 5 % of total energy intake would provide additional health benefits’ (1,p.4). Free sugars are defined as ‘monosaccharides and disaccharides added to foods and beverages by the manufacturer, cook or consumer, and sugars naturally present in honey, syrups, fruit juices and fruit juice concentrates’’ (1,p.4). The most efficacious methods to reduce free sugar intakes, however, remain unknown. Covert strategies such as increasing taxes, advertising restrictions and product reformulation can have impacts(1–Reference von Philipsborn, Stratil and Burns5), but negative perceptions can also arise, limiting long-term success(Reference von Philipsborn, Stratil and Burns5,Reference van Meurs, de Koster and van der Waal6) . Overt strategies tend to be more acceptable to consumers(Reference van Meurs, de Koster and van der Waal6), and these can also demonstrate success(Reference Bucher Della Torre, Moullet and Jotterand Chaparro2,Reference Kirkpatrick, Raffoul and Maynard4) . Population-based strategies typically involve information provision which aims to increase awareness and knowledge, changes to the food environment which aim to reduce access to free-sugar-rich foods/beverages and increase access to alternatives, and behavioural suggestions which similarly focus on reducing the consumption of high-free-sugar foods/beverages and substituting these for low-sugar alternatives(Reference Bucher Della Torre, Moullet and Jotterand Chaparro2,Reference Kirkpatrick, Raffoul and Maynard4) . Considerable debate, however, currently exists over the ideal low-free-sugar substitutions.
Free sugars and the foods that contribute most to high-free-sugar intakes typically taste sweet. Sweet taste is highly liked by humans(Reference Beauchamp7), and suggestions that sweet-tasting pleasures should be forgone can be met with negativity(Reference Appleton and McGowan8–Reference Tang, Mars and James11), difficulty(Reference Bielat, Rogers and Appleton12) and resistance(Reference Tang, Mars and James11). Fruit, some naturally sweetened dairy foods and low-calorie sweeteners (LCS) can provide the pleasure of sweet taste without the associated free sugar intake. Substitutions of free sugars and high-free-sugar foods/beverages with LCS and LCS-sweetened versions can result in reductions in free sugar intakes(Reference Hashem, He and MacGregor3,Reference Ebbeling, Feldman and Steltz13–16) , alongside reductions in energy intakes and body weight(15–Reference Rogers and Appleton18).
The WHO, however, currently recommends against the use of LCS(19), suggesting instead that reduced free sugar consumption is best achieved through the reduced consumption of all sweet taste, including that derived from LCS(19). The value of this advice for reducing free sugar intakes remains unclear. Studies where comparable sweet and non-sweet interventions can be directly compared demonstrate no differences in test meal sugar intake following a breakfast intervention for three weeks(Reference Appleton, Rajska and Warwick20), no differences in post-breakfast discretionary sugar intakes following a breakfast intervention for three weeks(Reference Carroll, Chen and Templeman21), and no differences in free-living sugar consumption following five weeks consumption of LCS-sweetened beverages compared to water(Reference Fantino, Fantino and Matray22), although LCS-sweetened beverage consumption did result in a slight decrease in sugar intakes under controlled conditions, and a marginal reduction in sweet food consumption in this scenario(Reference Fantino, Fantino and Matray22).
Longer-term intervention studies where participants were asked to replace free sugars with sweet-tasting or non-sweet-tasting alternatives also show few differences between sweet and non-sweet alternatives. In a trial by Ebbeling et al.(Reference Ebbeling, Feldman and Steltz13), 203 participants were randomised to maintain consumption of sugar-sweetened beverages or replace ≥1 sugar-sweetened beverages/day with LCS-sweetened or unsweetened beverages. Consumption of free sugars and total sugars were equally reduced in the two groups who were replacing sugar-sweetened beverages. In a similar trial by Kendig et al.(Reference Kendig, Chow and Martire14), consumption of high-sugar foods was equally reduced again in the two groups replacing sugar-sweetened beverages. In the SWITCH trial, 493 participants were randomised to consume water or LCS-sweetened beverages as part of a weight-management intervention. Comparable reductions in sugar intakes after the 12-week weight loss phase(Reference Harrold, Hill and Radu23) and after a subsequent 40-week weight maintenance phase(Reference Harrold, Hill and Radu24) were again reported in both the unsweetened and LCS-sweetened beverage groups. In the CHOICE trial, 210 participants were randomised to replace ≥2 servings per day of caloric beverages with either LCS-sweetened or unsweetened beverages(Reference Piernas, Tate and Wang25,Reference Tate, Turner-McGrievy and Lyons26) and again reported comparable reductions in total and added sugar consumption after 6 months. These studies all demonstrate comparable free and total sugar consumption in those replacing free-sugar-rich foods/beverages with sweet-tasting or non-sweet-tasting foods/beverages, and so suggest little benefit from recommendations to reduce our consumption of sweet taste for free sugar consumption outcomes.
In the CHOICE trial, furthermore, dessert and discretionary sweetener consumption were also significantly reduced in those consuming LCS-sweetened beverages compared with those consuming water(Reference Piernas, Tate and Wang25), an effect that mirrors the marginal effects found in the 5-week study by Fantino et al.(Reference Fantino, Fantino and Matray22). These findings suggest a benefit to consuming LCS-sweetened sweet-tasting foods for reducing free sugar intakes, rather than a detriment. A further recent study also suggests benefit to the continued consumption of sweet taste for reducing free sugar intakes. In the SWEET study, 102 participants randomised to consume sweeteners and sweetness enhancers while aiming to reduce free sugar intakes reported a reduction in free sugar intakes of 5·4 % TEI over a 12-month period, while 101 participants who were not permitted to use sweeteners reported a reduction in free sugar intakes of only 1·6 % TEI(Reference Pang, Kjølbæk and Bastings27). To return to the question of the ideal low-sugar alternatives for products that are high in free sugars, these findings suggest some benefit may be gained from recommending low-sugar options that also taste sweet. Further evidence on the importance of sweet taste for reducing free sugar consumption is of interest. Further studies will increase the evidence-base, increasing certainty in findings, aiding policy-makers and recommendation development. Evidence-based public health recommendations will benefit consumers.
Aim
This study aimed to investigate the effects on free sugar intakes of recommendations to replace high-free-sugar foods with either sweet or non-sweet alternatives. The study followed an earlier study from our laboratory where nutrient-based, nutrient- and food-based, and nutrient-, food- and food-substitution-based public health recommendations were found to result in reduced free sugar intakes compared to control(Reference Boxall, Arden-Close and James28), with a slight advantage for the nutrient-, food-, and food-substitution group(Reference Boxall, Arden-Close and James28,Reference Boxall, Dalby and Arden-Close29) . In the present study, individuals consuming >5 % TEI from free sugars were asked to reduce their free sugar intakes using either sweet or non-sweet low-free-sugar substitutions for usual high-free-sugar foods and beverages. Effects were assessed on free sugar intakes, a range of dietary, taste-based and attitudinal outcomes, and on participant perceptions of the recommendations over a 4-week and a 12-week period. Our study was nested in a public health context, where the dietary recommendations were provided once, and effects were investigated over the following period. Participant responses to the recommendations provided were an important part of this. Our null hypothesis stated that there would be no differences between intervention groups from baseline to week 4 in any outcome.
Methodology
Design
This study was designed as a pilot study – a mini version of an intended larger study, with the aim of testing all materials and processes as for the larger study, while reducing resource waste should changes by required(Reference Torgerson and Torgerson30). The study utilised a randomised controlled parallel-group trial design with three intervention arms. The primary purpose was to assess the effects of three taste-based substitution instructions for reducing free sugars, on free sugar intakes, over 4 weeks. Secondary aims were to investigate the effects of these different instructions on a range of dietary, taste-based and attitudinal outcomes; investigate participant perceptions of the interventions and study as a whole; and investigate all outcomes at 12 weeks, as well as at 4 weeks. Our larger study was planned with a 12-week assessment period allowing investigation of effects over the medium as well as the short term, while our earlier study(Reference Boxall, Arden-Close and James28) found greatest effects at 2 weeks and up to 4 weeks from a 12-week assessment period; thus, both 4- and 12-week periods of assessment were employed in this pilot study.
Participants
Individuals were considered suitable for inclusion in the study if they were: aged 18–65 years; consumed >5 % TEI from free sugars; able to provide informed consent and undertake all trial measures; and able to visit Bournemouth University, UK, for two in-person test days. Exclusion criteria were: underweight (BMI < 18·5 kg/m2); pregnancy or breastfeeding; dieting, allergies, smoking or the use of cigarettes or nicotine within the previous 3 months; and pre-existing medical conditions affecting taste and/or smell, appetite and/or involving dietary requirements (e.g. Crohn’s disease, diabetes mellitus, eating disorders).
Participants were recruited from the general community residing in the South of England. The trial was framed as ‘An investigation of the impacts of different types of dietary advice for dietary change’ and promoted using various streams of advertisement, such as personal and University contacts, social media, flyers, advertising among local community groups, in communal areas (e.g. libraries, cafes) and in the local newspaper. Early recruitment advertised the study as a 12-week study with a planned assessment at 4 weeks. Following limited recruitment, we added an option for participants to sign up for only 4 weeks, although the 12-week option remained available. Interested candidates were asked to complete the informed consent, an eligibility form and a 3-day diet diary (see Outcomes: Primary Outcomes: Free Sugar Intakes) to assess habitual free sugar intakes before being invited to participate.
Sample size calculations for the intended larger trial estimated the need for 46 participants per experimental group, to detect a 2 % TEI change in dietary free sugar intakes from baseline to trial end, for an α of 0·05, at a power of 80 %, assuming a sd in change of 2·4 % TEI, as previously reported in a trial on the use of similar dietary recommendations for dietary change(Reference Smith, Kerr and Howie31). As a pilot study, we sought to recruit half this number for the current study. This sample size was considered suitable for the purposes of a pilot study, but may not be sufficient to demonstrate statistical effects(Reference Torgerson and Torgerson30).
Registration
The trial was conducted at Bournemouth University, UK. The trial received ethical approval from the Research Ethics Committee of Bournemouth University, UK (ID: 46699) on 12·12·2022 and was registered on Clinicaltrials.gov (ID: NCT05684757) on 03·01·2023. The trial was run in accordance with the Declaration of Helsinki (1983), the Ethical Guidelines of the British Psychological Society and Bournemouth University’s Research Ethics Code of Practice. All participants provided written informed consent prior to participation. We adhered to our trial registration in all respects, excepting the reduction in assessment period for some participants, as detailed above. This reduced assessment period was registered on ClinicalTrials.gov (ID: NCT05932329) on 27.06.2023, with the two registrations linked, allowing data sharing for both periods. Our subsequent full trial has been registered under a different registration.
Randomisation
Participants were randomised following baseline assessments, to one of three experimental arms, at a ratio of 1:1:1, using stratified randomisation based on gender, BMI and free sugar intakes (%TEI) at screening, as variables that may affect our outcomes(Reference Boxall, Arden-Close and James28). Randomisation was undertaken prior to the commencement of the trial by a researcher with no direct contact with participants using a random number generator. Participants were allocated to intervention groups individually excepting where participants lived with others in the study. In this case, all participants were allocated to the same intervention group, based on the stratification of the person making the initial query, to avoid contamination between intervention groups. Group allocation was concealed from all researchers in contact with participants.
Interventions
Participants were randomised to one of three trial arms: sweet taste, taste and no taste. Participants in all trial arms were asked to reduce their free sugar intakes, and to aid with this, they were encouraged to reduce their intakes of sweet high-free-sugar foods/beverages and replace these with alternatives. In each of the three groups, the recommended alternatives differed in taste.
-
Sweet Taste: Participants in the sweet taste group were recommended to replace sweet high-free-sugar foods/beverages with sweet low-free-sugar alternatives. Participants were provided with suggestions for suitable foods, including fruit, low-sugar fruit-flavoured drinks and teas, and foods and beverages sweetened with LCS.
-
Taste: Participants in the taste group were recommended to replace sweet high-free-sugar foods/beverages with low-free-sugar foods that were non-sweet but high in other tastes and flavours. Suggestions for this group included herb-flavoured crispbreads, condiments and dressings, spice-flavoured foods/beverages, nuts and nut-flavoured foods, vegetables and vegetable juices.
-
No Taste: Participants in the no-taste group were recommended to replace sweet high-free-sugar foods with low-free-sugar foods that have no strong or a neutral taste or flavour. Suggestions for this group included plain porridge, plain yoghurts and a number of grains and oats.
All dietary suggestions were gained from current publicly available information from the UK government aiming to aid the general public with reducing free sugar intakes(32,33) or encourage healthy diets(34).
All intervention instructions were delivered to participants, following baseline assessments, in opaque envelopes. All intervention-containing envelopes were prepared by the researcher undertaking the randomisation and appeared identical from the outside, with the exception of an ID number. For all groups, the envelopes also contained an identical user guide for the Nutritics ‘Libro’ App(35) and a request for accurate diet recording using this software. To reflect the current delivery of public dietary recommendations in the UK (e.g. via government slogans and TV advertisements) which limit the possibility for inquiry, participants were unable to ask questions about the dietary instructions received, although clarification could be sought. Furthermore, the inability to ask questions ensured that each participant received the same information, upholding the integrity of the intervention.
Throughout data collection, the researchers in direct contact with the participants remained blind to treatment allocation. Although it was impossible to blind participants to group allocation, they were blinded to the true purpose of the study and all interventions other than their own.
Intervention instructions were delivered at a single timepoint with outcomes assessed over the following period of 4 weeks for all participants and 12 weeks for a subset of participants.
Outcomes
The primary outcomes were change in free sugar intakes, as a percentage of TEI, and adherence to the UK free sugar dietary recommendations by the end of 4 weeks. Secondary outcomes were as follows: dietary intakes, including TEI, diet composition, consumption of sugar-sweetened foods/beverages and the consumption of sweet-tasting foods/beverages; anthropometry; sweet food perceptions and preferences; sweet food choice; attitudes towards sugars, sweeteners and sweet-tasting foods; attitudes towards eating; quality of life; adverse events and participant perceptions of the intervention and study. All outcomes were assessed at 4 weeks, with all outcomes also assessed at 12 weeks in the subset of participants who volunteered for this. Demographic variables, sweet liker status and bitter taste status, were also assessed at baseline, considering some reported differences in sugar and other dietary intakes based on these characteristics(Reference Bartoshuk, Fast and Snyder36–Reference Yeomans, Prescott and Gould40).
Primary outcomes
Free sugar intakes: Changes in free sugar intakes, as %TEI, were assessed using diet diaries. Three days of diet diaries – one weekend day and two weekdays – at baseline, 4 weeks and 12 weeks were undertaken using the Nutritics software platform and the ‘Libro’ App(35) and used to compute dietary intakes(41). Although under- or misreporting can take place, diet diaries are recognised as a valid and reliable method for assessing short-term dietary intake in the real world(41–Reference Trabulsi and Schoeller44) and were selected here as the best method for assessing intakes and changes to intakes in a comprehensive manner over a period of free living(41–Reference Trabulsi and Schoeller44). Portion-size rather than weighed diaries and handheld portable digital diary entry methods(41,Reference Trabulsi and Schoeller44,Reference Raatz, Scheett and Johnson45) were used to reduce participant burden and minimise any effects of this, while maintaining data integrity and validity. All diaries were recorded via the Nutritics ‘Libro’ app, where participants had access to all British and Irish foods, via the Nutritics British (GB) and Irish (IE) databases, and to supermarket and brand-specific information, ensuring accurate dietary information could be found.
To encourage accuracy and honesty in dietary reporting, a bogus pipeline method was used(Reference Adams, Parkinson and Sanson-Fisher46,Reference Reid, Hammersley and Duffy47) , and participants were offered a dietary consultation, based on their collected data, from a Registered Nutritionist, as a thank you for taking part. For the bogus pipeline method, on all test days, each participant provided a saliva sample with the alleged purpose of analysing salivary enzymes that may change with changes in dietary intakes. Only at the end of the trial were participants informed that their samples had not been analysed.
The same diaries were also used for the 3-day screening, to also provide an opportunity to train participants, allow participants to gauge the commitment required for the study, and ensure participants were competent in the diet diary data collection methods prior to their entry into the study. Participants were not recruited into the trial until they were comfortable with the commitment and diet diary data collection methods. Diaries were undertaken on three days in one week for measurements at baseline, week 4 and week 12, as above. An additional seven diaries were also requested in weeks 1, 2 and 3, to allow interim assessments and sustain participant engagement. Further diaries were also requested in weeks 5 - 12 at a rate of one or two diaries per week, for participants remaining in the study for 12 weeks, for the same reasons. The schedule of requests for diary completion is given in the Supplementary Materials, Table S1. Any issues with dietary recording throughout the trial were addressed the same day by researchers blinded to treatment allocation and supported by the Nutritics Support Team.
Free sugar intakes (%TEI) were calculated using the Nutritics databases and manufacturer’s information(35). Where free sugars data were not available, either from databases or from manufacturers, foods were replaced with the closest available food for which free sugars data were available, using nutritional values for energy, carbohydrates and total sugars, by a registered Nutritionist with experience of the UK food supply (blinded to treatment allocation).
Adherence: Alongside changes in free sugar intakes, participants were categorised as ‘successful’ or not in achieving the dietary recommendations, where individuals with free sugar intakes ≤5 % EI were classified as ‘successful’, and free sugar intakes >5 % EI were classified as ‘not successful’.
Secondary outcomes
Full details of the methods for assessing all secondary outcomes are provided in the Supplementary Materials, Section S1. Briefly, dietary outcomes – daily energy intake, diet composition, consumption of sugar-sweetened foods/beverages and the consumption of sweet-tasting foods/beverages – were calculated from the undertaken diet diaries. Anthropometry, sweet food perceptions, preferences and sweet food choice were assessed at two in-person test days held at Bournemouth University, UK. Fasted body weight, BMI, waist circumference and body fat percentage were measured by a trained researcher. Sweet food perceptions and preferences were assessed in a taste test, and sweet food choice was assessed in an ad libitum buffet breakfast meal, using established methods(Reference Bielat, Rogers and Appleton12,Reference Appleton, Rajska and Warwick20) . Attitudes towards sugars, sweeteners and sweet-tasting foods(Reference Tang, Mars and James39), attitudes towards eating(Reference Karlsson, Persson and Sjöström48) and quality of life(Reference Ware, Snow and Kosinski49) were assessed by questionnaire. Adverse events and perceptions of the intervention and the study were assessed by self-report using open-response questions, throughout the study (adverse events), and at weeks 4, 8 and 12 (perceptions of the intervention and study).
Participant characteristics
Demographic characteristics were collected at baseline, to allow clearer description of the participant groups. These measures included sweet liker status, assessed using a single 1M aqueous sucrose solution(Reference Iatridi, Hayes and Yeomans37), and bitter taste status, assessed using a taste paper impregnated with 6-n-Propylthiouracil(Reference Bartoshuk, Fast and Snyder36). Full details of all assessments are provided in the Supplementary Materials, Section S2.
Outcome assessment
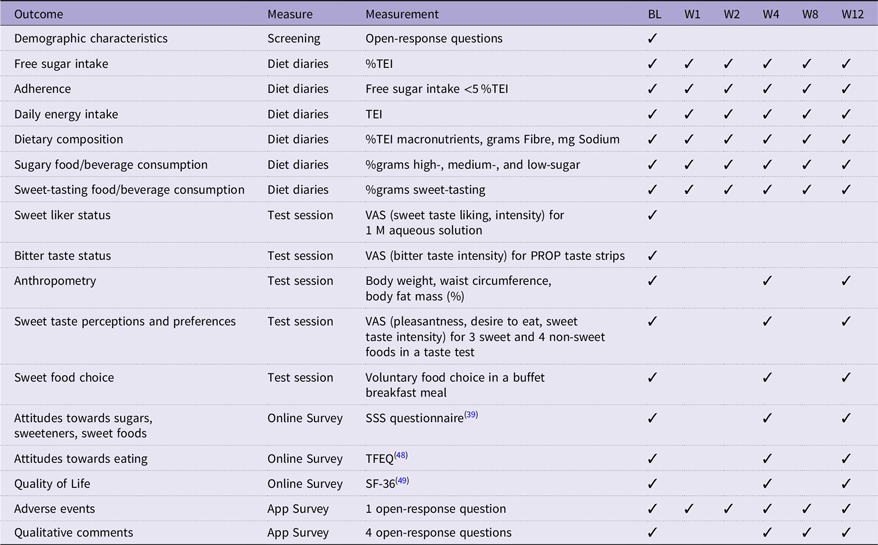
An overview of the outcome assessment schedule is given in Table 1. Dietary outcomes and adverse events were assessed throughout the intervention period, and all other outcomes were assessed at baseline, week 4 (and week 12), excepting the participant characteristics which were assessed only at baseline. All participants completed all measures in the same order irrespective of intervention arm and assessment week. Test sessions at the Eating Behaviour Laboratory, Bournemouth University lasted 30–60 min. Measures were undertaken in the same order during each test session, as follows, or omitted: anthropometry; saliva sample; sweet liker status; bitter taste status; sweet taste perceptions and preferences; and sweet food choice. All sessions were held in the morning, with a request that participants came to the laboratory having had nothing to eat or drink (excepting water) since 10 pm the night before, and having done no heavy exercise and drunk no alcohol the day before. Self-report surveys were distributed online using the Qualtrics platform a few days in advance of each test session. Incomplete questionnaires were completed during the test session. Missing diet diaries throughout the trial resulted in an automatic reminder. The last test day concluded with a debrief for each participant, where participants were also asked for their understanding of the trial’s objectives and for any final qualitative comments.
Outcomes assessed, with measures used and time frame

Long description
A table with 17 rows and 9 columns detailing various outcomes assessed, the measures used, and the time frame for each measurement. The columns are labeled Outcome, Measure, Measurement, BL, W1, W2, W4, W8, and W12. The rows include different outcomes such as Demographic characteristics, Free sugar intake, Adherence, Daily energy intake, Dietary composition, Sugary food/beverage consumption, Sweet-tasting food/beverage consumption, Sweet liker status, Bitter taste status, Anthropometry, Sweet taste perceptions and preferences, Sweet food choice, Attitudes towards sugars, sweeteners, sweet foods, Attitudes towards eating, Quality of Life, Adverse events, and Qualitative comments. Each row specifies the measure and measurement method, followed by checkmarks indicating the weeks when the measurement is taken.
BL: Baseline; PROP: 6-n-Propylthiouracil; SSS: Sugars, sweeteners and sweet-tasting foods questionnaire(Reference Tang, Mars and James39); TFEQ: Three-factor eating questionnaire(Reference Karlsson, Persson and Sjöström48); SF-36: Short-form 36 measure of quality of life(Reference Ware, Snow and Kosinski49); TEI: Total Energy Intake; VAS: Visual Analogue Scales; W1: Week 1; W2: Week 2; W4: Week 4; W8: Week 8; W12: Week 12.
Recruitment began in April 2023 and finished in November 2023. The trial was run over the year to limit seasonal effects and discontinued prior to the Christmas period to avoid potential effects as a result of unusual dietary intakes at this time.
Analyses
Quantitative data were first processed by a researcher blind to treatment group. Outcome data were cleaned, and diet diary data were averaged to provide intake data per participant, per week, from all completed diaries. Where diaries were missing or incomplete, other diaries in the same week were used as available. Where no diaries were available, data were treated as missing for the individual timepoint. Participant characteristics were analysed by participant group to describe the sample. Analyses were subsequently conducted on an intention-to-treat basis, with all missing data completed using multiple imputation. Data for all outcomes were subsequently described using means and sd and analysed using repeated measures ANOVA, to investigate differences between groups, over time and between groups over time. Considering the pilot nature of the work, including the reduced sample size, all statistical results, including significance, should be treated with caution. All statistical results are presented in the Supplementary Materials with only consistent patterns reported in the main text. For all statistical tests, we used a significance cut-off of p ≤ 0·01 to ensure against over-interpretation.
Qualitative data were analysed using content analysis, following coding by two independent researchers blind to treatment group(Reference Braun and Clarke50). Full details are given in the Supplementary Materials, Section S3.
Findings for all participants at the 4-week assessment timepoint are presented in the main text. For the subset of participants undertaking assessments for 12 weeks, results are presented in the Supplementary Materials. No statistical analyses were conducted on this subset.
Results
Participant characteristics
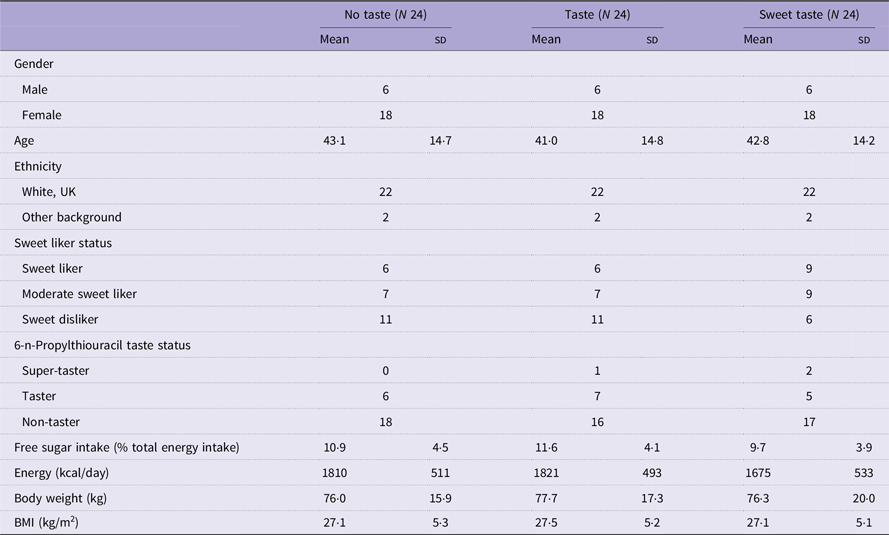
A total of seventy-two adults (20 male, 52 female), with a mean (sd) age of 42·3 (14·4) years and a mean (sd) BMI of 27·2 (5·1) kg/m2, took part in the study for 4 weeks, with 24 participants randomised to each group. Key characteristics per participant group are provided in Table 2, with full details provided in the Supplementary Materials, Table S4. Twenty-nine participants continued with the study beyond 4 weeks to provide assessments also at 12 weeks (see Results: Week 12 assessments).
Participant characteristics (N 72). Data provided as number of participants, unless otherwise stated

Table 2. Long description
A table comparing participant characteristics across three groups: No taste, Taste, and Sweet taste. The table has 12 rows and 7 columns, including headers. Row 1: Gender, Male, 6, 6, 6. Row 2: Gender, Female, 18, 18, 18. Row 3: Age, Mean, 43.1, 41.0, 42.8. Row 4: Age, SD, 14.7, 14.8, 14.2. Row 5: Ethnicity, White, UK, 22, 22, 22. Row 6: Ethnicity, Other background, 2, 2, 2. Row 7: Sweet liker status, Sweet liker, 6, 6, 9. Row 8: Sweet liker status, Moderate sweet liker, 7, 7, 9. Row 9: Sweet liker status, Sweet disliker, 11, 11, 6. Row 10: 6-n-Propylthiouracil taste status, Super-taster, 0, 1, 2. Row 11: 6-n-Propylthiouracil taste status, Taster, 6, 7, 5. Row 12: 6-n-Propylthiouracil taste status, Non-taster, 18, 16, 17. Row 13: Free sugar intake (% total energy intake), Mean, 10.9, 11.6, 9.7. Row 14: Free sugar intake (% total energy intake), SD, 4.5, 4.1, 3.9. Row 15: Energy (kcal/day), Mean, 1810, 1821, 1675. Row 16: Energy (kcal/day), SD, 511, 493, 533. Row 17: Body weight (kg), Mean, 76.0, 77.7, 76.3. Row 18: Body weight (kg), SD, 15.9, 17.3, 20.0. Row 19: BMI (kg/m2), Mean, 27.1, 27.5, 27.1. Row 20: BMI (kg/m2), SD, 5.3, 5.2, 5.1.
Study progress
A CONSORT diagram showing participant progress through the study is given in Figure 1. Sixty-six participants completed the 4-week assessment (diet diaries and test session), with six participants withdrawing prior to this: 3 from group Sweet Taste, 1 from group Taste and 2 from group No Taste. For the sixty-six participants, twenty-seven of 198 (13·6 %) week 4 diaries were missing. Five participants also failed to provide qualitative comments: two from group Sweet Taste, two from group Taste, and one from group No Taste. The majority (78 %) of participants reported following the instructions they were given.
CONSORT diagram.

Primary outcomes
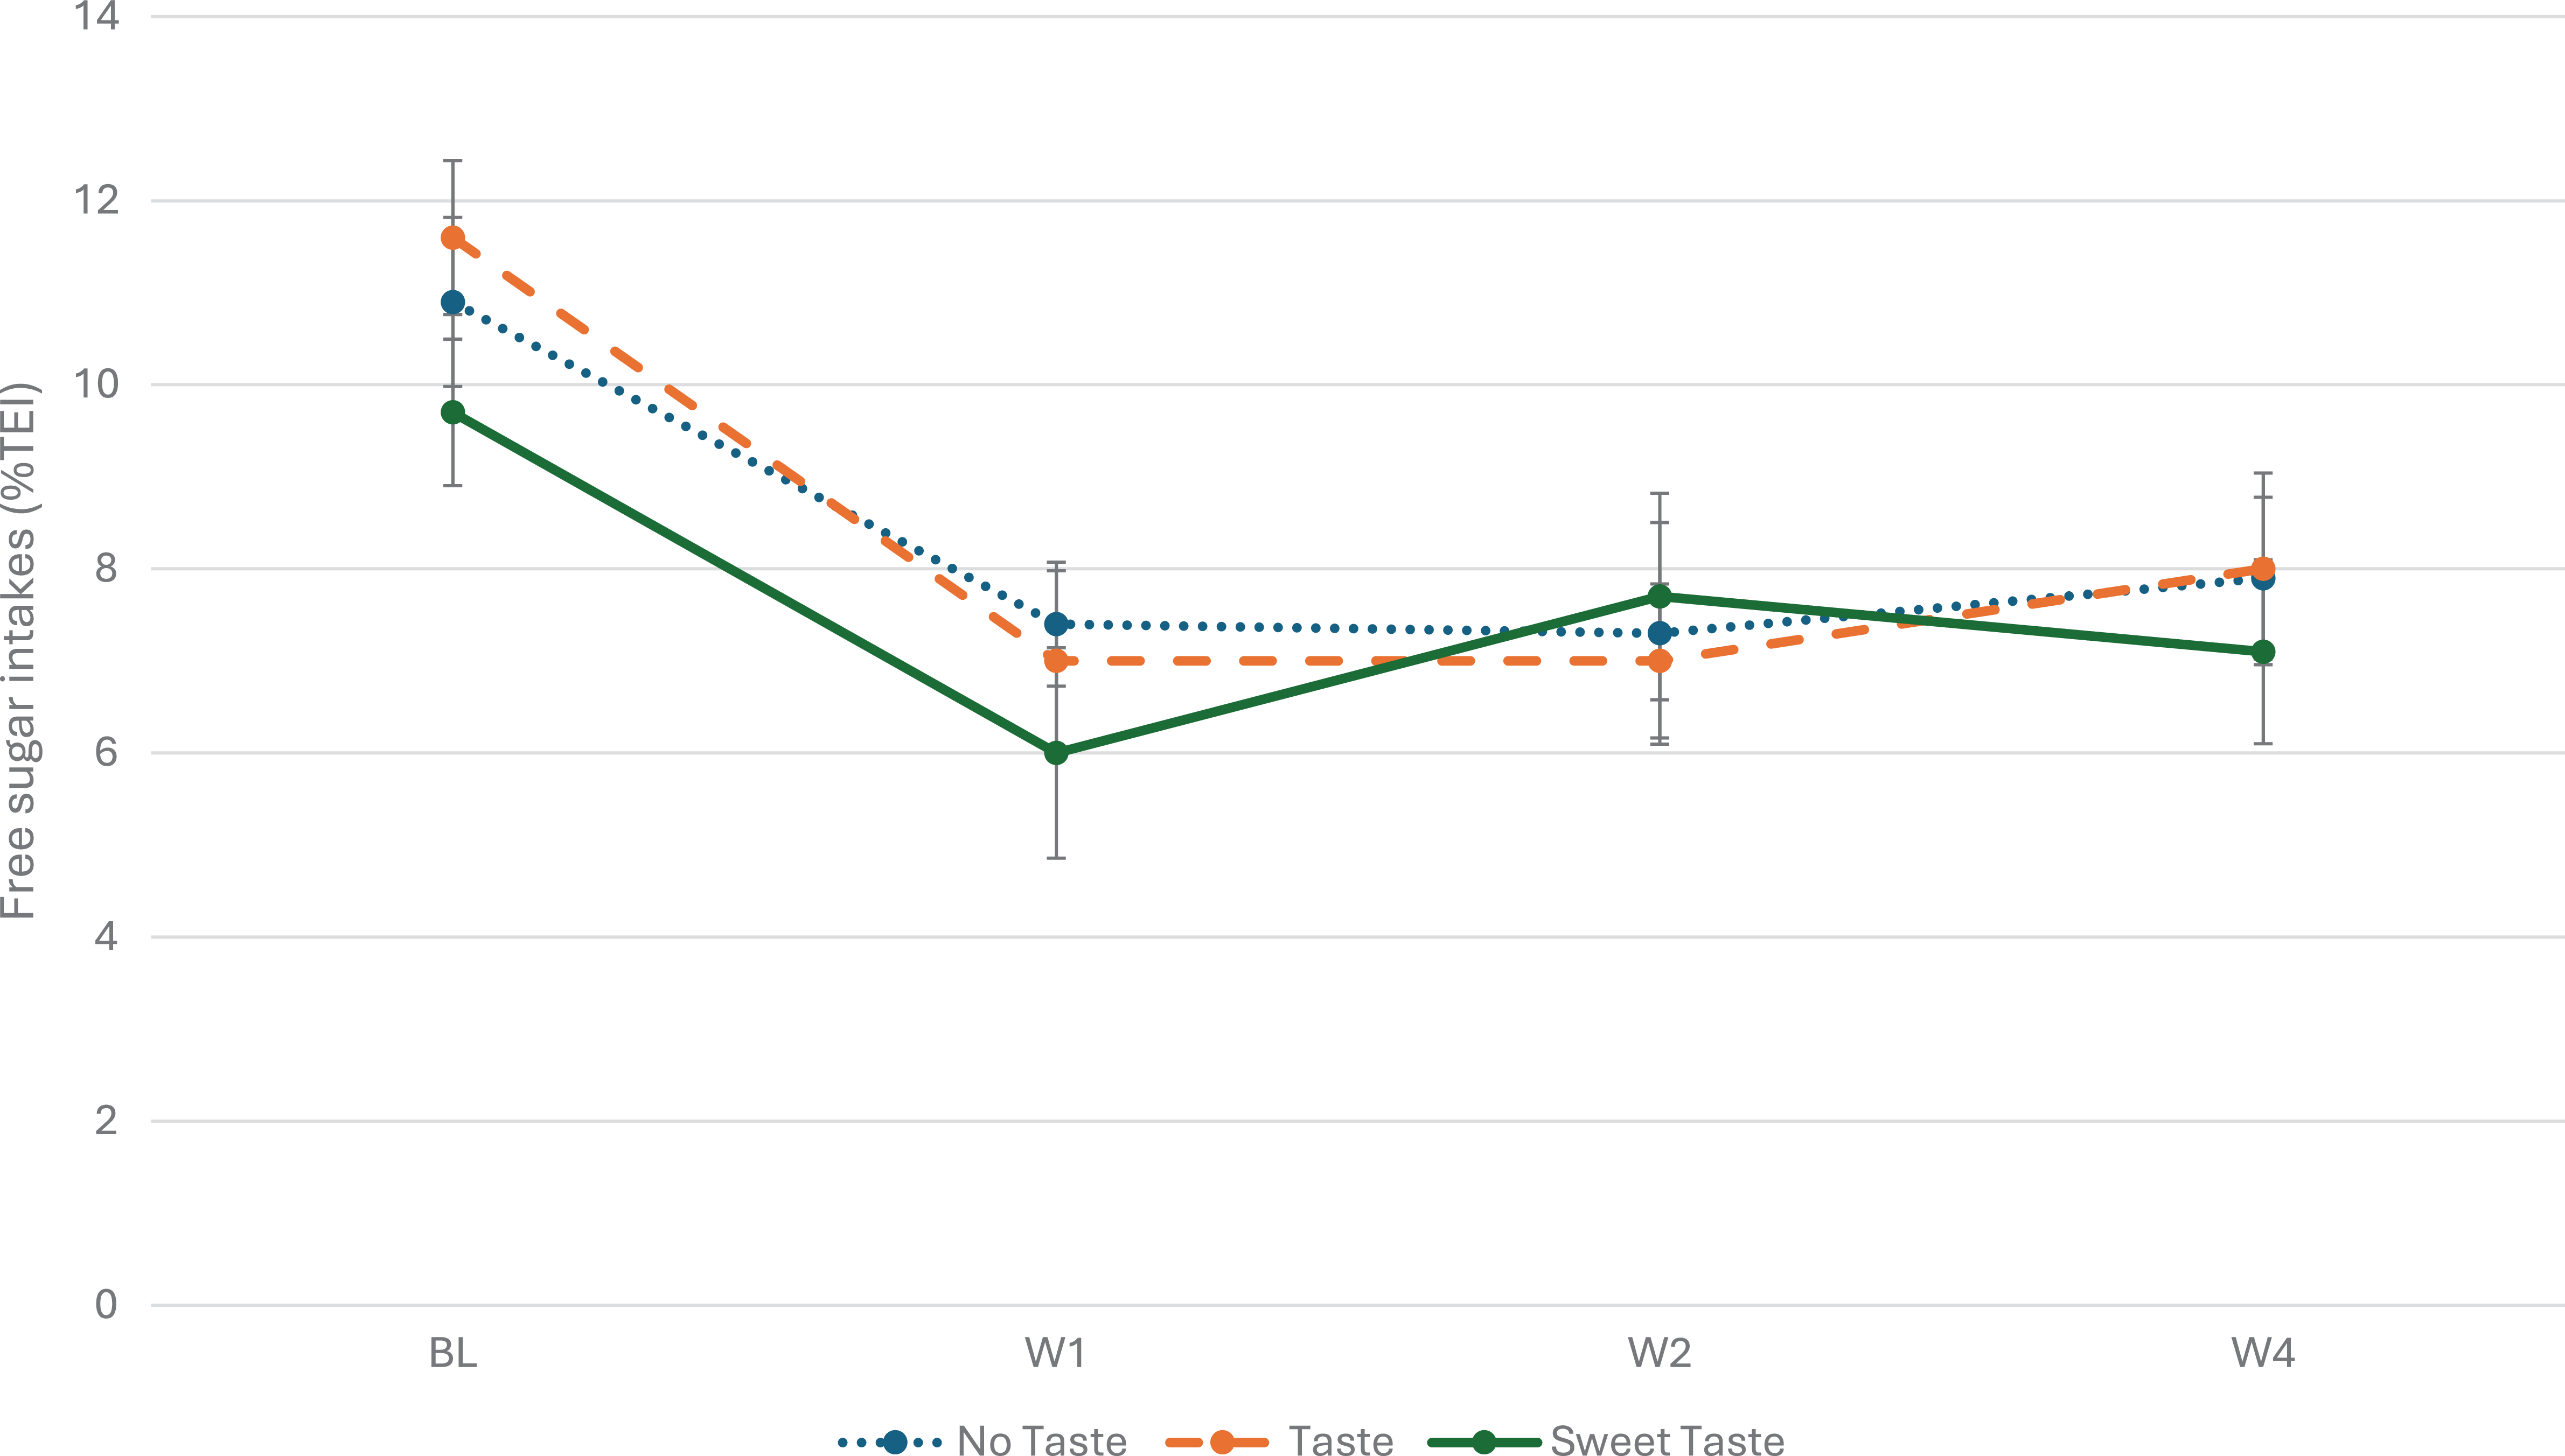
Free sugar intakes at baseline and week 4 and number of participants adhering to the UK free sugar recommendations (<5%TEI) are given in Table 3, with the pattern of effects from baseline to week 4 also demonstrated in Figure 2. All groups reduced free sugar intakes by 2·6–3·6 %TEI (F(1,69) = 19·86, P < 0·01), although no differences between groups were found. Full statistics are given in the Supplementary Materials, Table S5.
Mean (sd) free sugar intakes and number of participants adherent (free sugars <5 % TEI), at baseline and week 4 in each intervention group (N 72)

Table 3. Long description
The table presents data on free sugar intakes and adherence to the UK free sugar recommendations (<5%TEI) for three groups: No taste, Taste, and Sweet taste, each with 24 participants. The table is divided into two main time points: Baseline (BL) and Week 4 (W4). For each time point, it shows the mean free sugar intakes as a percentage of total energy intake (%TEI) and the number of adherent participants (free sugars <5%TEI). Row 1: At baseline, the No taste group had a free sugar intake of 10.9%TEI with 1 adherent participant. The Taste group had an intake of 11.6%TEI with 2 adherent participants. The Sweet taste group had an intake of 9.7%TEI with 2 adherent participants. Row 2: At week 4, the No taste group had a free sugar intake of 7.9%TEI with 6 adherent participants. The Taste group had an intake of 8.0%TEI with 8 adherent participants. The Sweet taste group had an intake of 7.1%TEI with 9 adherent participants.
BL: Baseline; sd: standard deviation; TEI: total energy intake; W4: Week 4.
Note: some participants reduced their free sugars intake between screening and baseline assessments to become adherent by baseline.
* Significant decreases over time (in all groups), P ≤ 0·01.
Free sugar intake (mean (standard error) at weeks 0, 1, 2 and 4, per intervention group (N 72).

Secondary outcomes
Daily energy intake, dietary composition and dietary taste
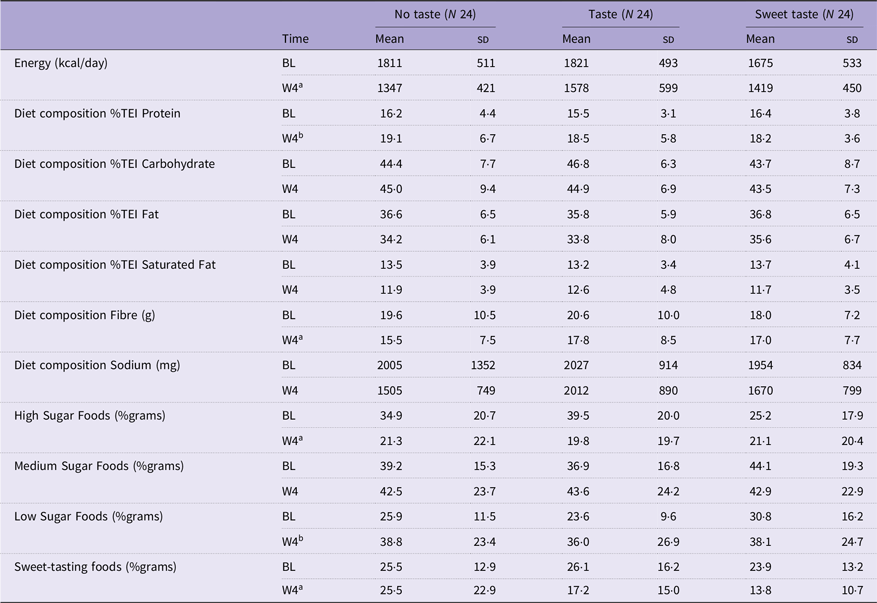
Effects over time were also reported in other dietary outcomes, to demonstrate reductions in TEI (kcal/d), increases in %TEI consumed from protein and decreases in the consumption of fibre (g) in all groups (smallest F(1,69) = 10·87, P < 0·01). Participants in all groups also reported reductions in the percent weight consumed from high-sugar foods/beverages (%grams), decreases in percent weight consumed from sweet-tasting foods/beverages (% grams) and increases in the percent weight consumed from low-sugar foods/beverages (%grams) (smallest F(1,69) = 10·71, P < 0·01) (see Table 4). All statistics are given in the Supplementary Materials, Table S5.
Mean (sd) for all dietary outcomes at baseline and week 4, per intervention group (N 72)

Long description
A table with 11 rows and 9 columns comparing dietary outcomes at baseline and week 4 across three intervention groups: No taste, Taste, and Sweet taste. The columns are labeled Time, No taste (N=24), Taste (N=24), and Sweet taste (N=24). The rows include Energy (kcal/day), Diet composition %TEI protein, Diet composition %TEI carbohydrate, Diet composition %TEI fat, Diet composition %TEI saturated fat, Diet composition fibre (g), Diet composition sodium (mg), Low-sugar foods (grams %), Medium sugar foods (grams %), and High sugar foods (grams %). Each row provides values for baseline (BL) and week 4 (W4) for each intervention group. Notable trends include variations in energy intake, diet composition, and sugar food consumption across the groups and time points.
BL: Baseline; sd: standard deviation; TEI: total energy intake; W4: Week 4.
a Significant decreases over time (in all groups), P ≤ 0·01.
b Significant increases over time (in all groups), P ≤ 0·01.
Anthropometry
No changes were found in body weight, BMI, waist circumference or body fat percentage (largest F(1,69) = 3·44, P = 0·07). All data and statistics are given in the Supplementary Materials, Table S6.
Sweet taste perceptions, preferences and sweet food choice
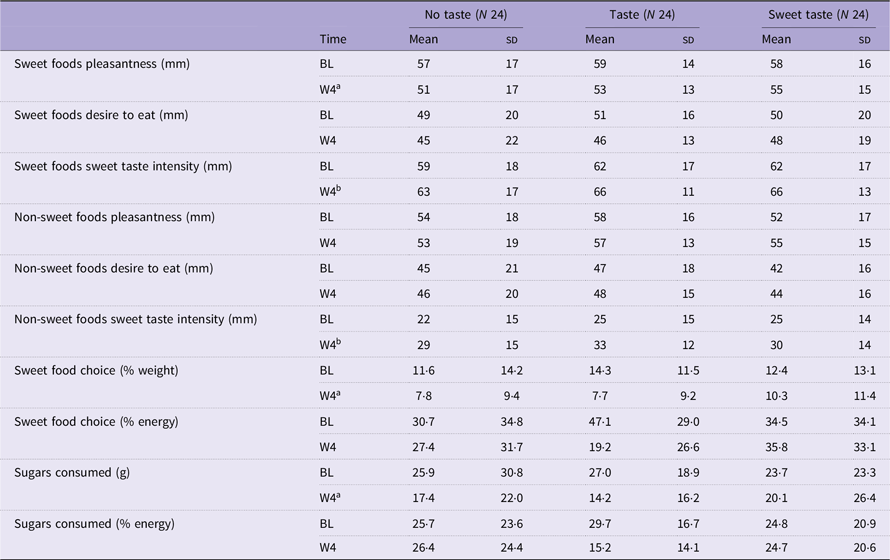
In sweet taste perceptions, preferences and sweet food choice (see Table 5; Supplementary Materials, Table S7), all participants reported increases in perceived sweet taste intensity for sweet foods and non-sweet foods, decreases in the pleasantness of sweet foods and a reduction in %weight consumed from sweet foods and sugars (g) consumed at the buffet breakfast (smallest F(1,69) = 6·50, P = 0·01).
Mean (sd) for all sweet taste outcomes at baseline and week 4, per intervention group (N 72)

Long description
The table presents data on sweet taste perceptions, preferences, and food choices for three groups: No taste, Taste, and Sweet taste, each with 24 participants. The table is divided into several rows and columns, with columns representing different time points (BL and W4) and groups (No taste, Taste, Sweet taste). Each group has mean and standard deviation (SD) values for various metrics. Row labels include Sweet foods pleasantness, Sweet foods desire to eat, Sweet foods sweet taste intensity, Non-sweet foods pleasantness, Non-sweet foods desire to eat, Non-sweet foods sweet taste intensity, Sweet food choice (% weight), Sweet food choice (% energy), Sugars consumed (g), and Sugars consumed (% energy). Each row provides data for baseline (BL) and week 4 (W4) measurements. Notable trends include changes in perceived sweet taste intensity, pleasantness of sweet foods, and reductions in the percentage weight consumed from sweet foods and sugar intake at the buffet breakfast.
BL: Baseline; sd: standard deviation; W4: Week 4.
a Significant decreases over time (in all groups), P ≤ 0·01.
b Significant increases over time (in all groups), P ≤ 0·01.
Attitudes and behaviours towards sugars, sweeteners and sweet-tasting foods, towards eating, quality of life and adverse events
In the questionnaire measures, participants in all groups reported adding less sugar to drinks, consuming less sugary foods, an increase in the perceived ‘personal impact’ of sugars, sweeteners and sweet-tasting foods/beverages and a reduction in ‘negativity’ towards these foods/beverages (smallest F(1,69) = 6·78, P = 0·01). All participants also reported an increase in cognitive restraint (F(1,69) = 6·96, P = 0·01), in self-reported physical health (F(1,69) = 9·84, P < 0·01), and reported no adverse events. All data and statistics are provided in the Supplementary Materials, Table S8.
Participant perceptions of the intervention and study
The majority of participants in all groups reported that the diet provided was enjoyable (34 %) or acceptable (28 %) (see Supplementary Materials, Table S9). In response to a question on dietary taste, participants in all groups reported their diet as less sweet, with more participants in the No-Taste group also reporting their diet as more tasty/with more variety in taste, more participants in the Taste group reporting their diet as having more non-sweet tastes and more participants in the Sweet Taste group reporting no change to the taste of their diet (see Supplementary Materials, Table S5).
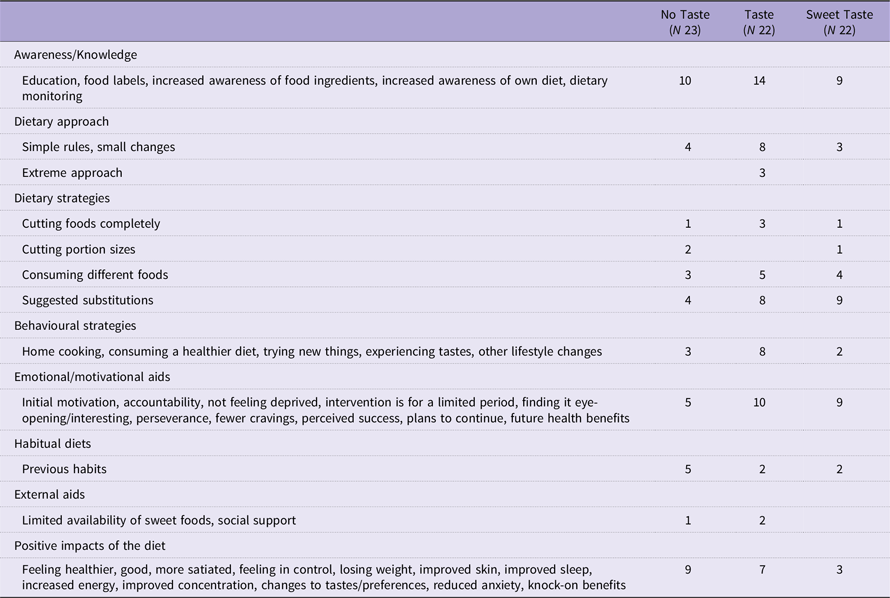
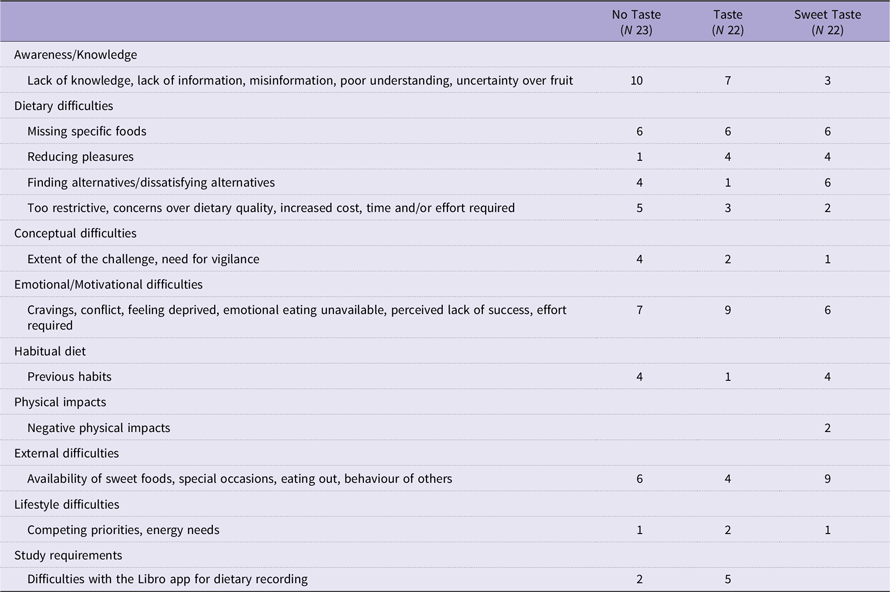
For the questions on positive and negative elements of the study, descriptions of all qualitative codes and code categories, with example quotes, are provided in the Supplementary Materials, Tables S10 and S11, respectively. Numbers of participants in each group providing comments in each code category are given in Tables 6 and 7, with a fuller breakdown in Supplementary Materials, Tables S12 and S13, respectively. Participants reported benefits from increased awareness/knowledge, from simple rules, small changes and the substitutions provided, from behavioural strategies, emotional/motivational aids and perceived impacts. Participants also reported difficulties as a result of a lack of information/knowledge, from missing specific foods and a lack of satisfying alternatives, emotional/motivational difficulties and difficulties as a result of external factors.
Number of respondents in each group reporting positive aspects of the recommendations/diet, in each code category (N 67)

Table 6. Long description
A table comparing the number of respondents in each group reporting positive aspects of dietary recommendations across various code categories. The table has 11 rows and 4 columns. The columns are labeled ‘Awareness/Knowledge’, ‘No Taste (N-23)’, ‘Taste (N-22)’, and ‘Sweet Taste (N-22)’. The rows are labeled with different code categories such as ‘Education, food labels, increased awareness of food ingredients’, ‘Simple rules, small changes’, ‘Extreme approach’, ‘Cutting foods completely’, ‘Cutting portion sizes’, ‘Consuming different foods’, ‘Suggested substitutions’, ‘Home cooking, consuming a healthier diet, trying new things, experiencing tastes, other lifestyle changes’, ‘Initial motivation, accountability, not feeling deprived, intervention is for a limited period, finding it eye-opening/interesting, perseverance, fewer cravings, perceived success, plans to continue, future health benefits’, ‘Previous habits’, and ‘Limited availability of sweet foods, social support’. Each cell contains the number of respondents in each group for the corresponding code category. Notable trends include higher numbers in the ‘No Taste’ group for ‘Education, food labels, increased awareness of food ingredients’ and ‘Positive impacts of the diet’, while the ‘Taste’ group has higher numbers for ‘Initial motivation, accountability, not feeling deprived, intervention is for a limited period, finding it eye-opening/interesting, perseverance, fewer cravings, perceived success, plans to continue, future health benefits’.
Number of respondents in each group reporting negative aspects of the recommendations/diet, in each code category (N 67)

Table 7. Long description
A table comparing the number of respondents in each taste group reporting various difficulties. The table has 12 rows and 4 columns. The columns are labeled ‘No Taste (N-23)’, ‘Taste (N-22)’, and ‘Sweet Taste (N-22)’. The rows are labeled with different categories of difficulties: Awareness/Knowledge, Dietary difficulties, Conceptual difficulties, Emotional/Motivational difficulties, Habitual diet, Physical impacts, External difficulties, Lifestyle difficulties, and Study requirements. Each row contains specific subcategories and the number of respondents reporting those difficulties in each taste group. For example, under Awareness/Knowledge, the subcategory ‘Lack of knowledge, lack of information, misinformation, poor understanding, uncertainty over fruit’ has 10 respondents in the No Taste group, 7 in the Taste group, and 3 in the Sweet Taste group. The table provides a detailed breakdown of the challenges faced by respondents in different taste groups.
No participant reported a correct understanding of the aim of the study as an investigation of the different dietary recommendations for reducing free sugar intakes.
Week 12 assessments
Of the seventy-two participants who commenced the 4-week study, 29 (40 %) of these continued in the study for a further 8 weeks: twelve in group Sweet Taste, eight in group Taste and nine in group No Taste, with twenty participants providing qualitative comments (eight in group Sweet Taste, eight in group Taste, four in group No Taste). Details of these participants and descriptive data for all outcomes from these participants at baseline and week 12 are given in the Supplementary Materials, Tables S14–S21. There were no obvious differences between these data and the data from the assessments at week 4.
Discussion
For our primary outcome, free sugar intakes were found to reduce by an average 2·6–3·6 %TEI in all intervention groups. The size of the effect is similar to that reported in our earlier study also using a recommendation-based intervention(Reference Boxall, Arden-Close and James28). As in that study, effects were also reported early in this study, from week 1, to be sustained for the rest of the assessment period with little change. The size and stability of this change are promising for future health, with around one-third of our participants also reaching UK recommended intake levels at 4 weeks. These effects were also found with a low-intensity advice-based intervention provided at a single timepoint. Our reductions are not as great as those that have been found in some other studies(Reference Ebbeling, Feldman and Steltz13,Reference Kendig, Chow and Martire14,Reference Harrold, Hill and Radu23–Reference Pang, Kjølbæk and Bastings27) , but these studies involved more extensive interventions. Our study participants, however, were also likely to have been motivated to change their diet, considering that they volunteered for a research study requiring dietary change, and some reports of initial motivation were provided in the qualitative comments. This initial motivation will have increased our effect sizes(Reference Deci and Ryan51–Reference Ng, Ntoumanis and Thøgersen-Ntoumani54); thus, our findings demonstrate an effect that can be achieved with an advice-based intervention, provided at a single timepoint, in a motivated general population sample.
Improvements were also found in other dietary outcomes. Diet diaries showed specific reductions in the consumption of high-sugar foods/beverages and increases in the consumption of low-sugar foods/beverages, and questionnaire measures reported less sugar added to beverages and a lower consumption of sugary foods. These findings represent deliberate choices from our participants; decisions that are supported in our qualitative comments, where participants reported cutting or reducing the consumption of specific sugar-rich foods and beverages. Reductions in energy intake (kcal/d) in individuals with a high body weight and increases in protein consumption also demonstrate positive changes to dietary profiles(34). Both effects were also reported in our previous similar study(Reference Boxall, Arden-Close and James28), and an increase in protein consumption was also found in the CHOICE trial(Reference Piernas, Tate and Wang25,Reference Tate, Turner-McGrievy and Lyons26) . These findings likely stem from both an absolute increase and a relative increase in the selection of protein-rich foods(Reference Piernas, Tate and Wang25,Reference Tate, Turner-McGrievy and Lyons26,Reference Boxall, Arden-Close and James28) . Reductions in fibre consumption, however, were also reported. Fibre is a valuable component of the diet, of benefit for a number of aspects of health, including mortality and risk from cardiovascular disease, obesity and diabetes(Reference McKeown, Fahey and Slavin55–Reference Veronese, Gianfredi and Solmi57). These effects may have occurred as a result of a reduction specifically in fibre-containing foods that are also high in free sugars, such as breakfast cereals, or that are typically consumed with high-free-sugar items, such as toast and jam. Future dietary advice for reducing free sugars may benefit from additional considerations about fibre.
Also from the diet diaries, all groups reported a reduction in dietary sweet taste, as a percentage of weight of food consumed. These effects were found despite our advice to retain the sweet taste of the diet for the Sweet Taste group, although more participants in this group also self-reported no change to the taste of their diets, while more participants in the No-Taste and Taste groups self-reported changes. The findings from the diet diaries may suggest limited benefit from the advice component of the interventions provided, although further qualitative comments suggest some value. Participants in all three groups reported benefits, with the suggested substitutions considered useful particularly by the two taste-based groups. Repeated previous work demonstrates the value of information provision for dietary change(Reference Boxall, Dalby and Arden-Close29,Reference Gupta, Smithers and Harford58–Reference Wallace, Koebbel and Heath61) , with practical advice also known to confer benefits(Reference Boxall, Dalby and Arden-Close29,Reference Hills, Byrne and Lindstrom59–Reference Wallace, Koebbel and Heath61) . Some suggestions that additional or alternative substitutions would also have been helpful were also offered, primarily in the No-Taste and Sweet Taste groups, with confusion around fruit and a dislike or distrust of LCS also reported. From a public health perspective, these concerns are important. Other work also reports negativity towards LCS in UK consumers(Reference Tang, Mars and James11,Reference Boxall, Dalby and Arden-Close29,Reference Tang, Mars and James39) , and the comments around fruit may offer an additional barrier to reducing free sugar intakes in some consumers. Considering the independent health benefits that are gained from the consumption of fruit(Reference Aune, Giovannucci and Boffetta62–64), additional work here may be warranted. Our findings in dietary sweet taste from the diet diaries may reflect the difficulty of objectively measuring the sweet taste of a diet, considering the many different dietary behaviours that may affect overall taste(Reference Trumbo, Appleton and de Graaf65), and the crude nature of our calculations.
Effects were also found in a number of our taste-based and attitudinal outcomes. In sweet taste perception, participants in all groups reported increases in the perceived intensity of sweet taste for both sweet and non-sweet foods in the taste test, and changes in taste sensitivity were also provided in the qualitative comments. Changes in intensity perception have previously been reported in other studies where reduced sugar consumption has been directly compared to no sugar reduction, but findings are mixed. Changes in sweet taste intensity perception were reported by Wise et al.(Reference Wise, Nattress and Flammer66), were not found by Schwimmer et al.(Reference Schwimmer, Ugalde-Nicalo and Welsh67) and were reported by Ebbeling et al.(Reference Ebbeling, Feldman and Steltz13) when the sweet taste of the diet also changed, but not when dietary sweet taste was retained. Considering the similarities and differences between our groups, our findings may be more related to sugar reduction than dietary taste, but further work is required here.
Participants also reported decreases in the pleasantness of the sweet foods in the taste test, reduced voluntary selection of sweet foods in the buffet breakfast and a reduced voluntary sugar consumption in this meal. Where sugar reduction has been compared directly to no sugar reduction, findings in these outcomes are again mixed. Studies report reduced sweet taste preferences following sugar reduction compared to control(Reference Ebbeling, Feldman and Steltz13), no changes(Reference Wise, Nattress and Flammer66,Reference Schwimmer, Ugalde-Nicalo and Welsh67) and reduced sweet taste preferences where the taste of the diet had also changed, but not otherwise(Reference Kendig, Chow and Martire14). Significant work now suggests unlikely changes in generalised sweet taste preferences following changes in dietary taste(Reference Bielat, Rogers and Appleton12,Reference Appleton, Rajska and Warwick20,Reference Appleton, Tuorila and Bertenshaw68–Reference Mela and Risso70) . Our findings then may reflect a preference for reduced sugar-rich foods or sugar-rich-food consumption following our intervention instructions. Notably, all the foods in our taste test were familiar to participants and some were easily identifiable as sources of free sugars. Alternative mechanisms specific to sugars, or otherwise distinct from oral taste perception, such as the stimulation of receptors in the intestinal tract, or other methods of glucose-sensing, may also be possible(Reference Gutierrez, Fonseca and Simon71,Reference Lee and Owyang72) .
Changes in attitudes towards sugars, sweeteners and sweet-tasting foods, towards eating and in self-reported quality of life, are also likely to reflect the intervention instructions and a willingness to take part in the study. The impacts of dietary information on attitudes to foods are well-reported(Reference Verbeke60,Reference Wallace, Koebbel and Heath61) , with a systematic review by Gupta et al.(Reference Gupta, Smithers and Harford58), reporting associations specifically for sugars. Similarly, taking part in a dietary research study, with the additional dietary knowledge that may be gained, additional awareness of diet as part of study processes, and the associated motivation, judgement or pressure can all change attitudes to result in both improvements and deterrents towards healthy behaviour change(Reference Boxall, Arden-Close and James28,Reference Boxall, Dalby and Arden-Close29,Reference Hagger, Hardcastle and Chater53,Reference Ng, Ntoumanis and Thøgersen-Ntoumani54,Reference Wallace, Koebbel and Heath61) . Changes in attitudes may also be secondary to dietary changes or other changes observed by participants, for example, in taste sensitivity(Reference Boxall, Arden-Close and James28,Reference Boxall, Dalby and Arden-Close29,Reference Deci and Ryan51–Reference Ng, Ntoumanis and Thøgersen-Ntoumani54,Reference Hills, Byrne and Lindstrom59–Reference Wallace, Koebbel and Heath61) .
Our study was undertaken as intended for the larger trial, to provide valuable insights. A number of limitations, however, were also observed. First, our study was not powered as a full trial, and thus, caution is required over statistical differences and conclusions of ‘no changes’ or ‘no differences’. Second, in relation to study design, we have no no-intervention control. Considering our research question aimed to investigate effects of dietary taste, we included a no-taste control, but this does not control for effects resulting from the act of dietary recording, from receiving an intervention or from being part of a study(Reference Verbeke60,Reference Wallace, Koebbel and Heath61) . In our previous study(Reference Boxall, Arden-Close and James28), a no-intervention control group (controlling for these elements) demonstrated a reduction in free sugar intakes of 1·2 %TEI compared to a mean reduction of 3·0 %TEI in all intervention groups; thus, a similar effect can be estimated here. Our primary outcome was also assessed using diet diaries, which can be subject to misreporting(41–Reference Trabulsi and Schoeller44). At present, there is no objective measure for free sugar intake, and food diaries are considered an appropriate, reliable and validated method for capturing dietary intakes and changes to dietary intakes over time in a free-living situation(41–Reference Trabulsi and Schoeller44). Reported TEI does decrease over our assessment period, but many participants reported a desire to lose weight as motivation to undertake the study, so actual intake may have reduced, and in fact was reported elsewhere by some participants. All dietary recording was checked for completion at the time of submission, by a researcher blinded to intervention group, difficulties with reporting, including difficulties with digital recording or the necessary software, were remedied quickly, and our bogus pipeline method and dietary consultations for taking part were intended to encourage accurate reporting. We can make no comment, however, on the possibility, or not, of sugar-specific misreporting. Calculations of free sugar content were also only based on the information available or calculated from products with known content, but variety between products can exist, and some of this variation will have been lost by our methods. To minimise any resultant effects, all calculations were made only after data collection, by a researcher blinded to treatment allocation, and foods with missing data were consistently replaced with the same alternative.
Taken together, our findings replicate previous success from dietary recommendations for reducing free sugar intakes in high-free-sugar consumers who volunteer for a dietary study, with beneficial impacts also for wider dietary profiles, and in some attitudinal outcomes. We can offer no comment from this study however, on the value or not of the continued consumption of sweet taste to aid with this. Further work is needed on the advice provided to aid with reducing free sugar intakes, and the value of this advice, particularly in larger samples and over longer time frames.
Supplementary material
To view supplementary material for this article, please visit https://doi.org/10.1017/S0007114526108307
Data availability statement
Materials are available from the corresponding author on request.
Data described in the manuscript will be made available upon request.
Acknowledgements
Grateful thanks are extended to all participants and to the funders of this work. We are also grateful to Rebecca Jones and Matt Green, Bournemouth University, for help with participant recruitment, and with compiling the data for analysis, respectively.
Author contributions
KMA conceived and designed the trial; ADB, DJG and NK ran the trial; ADB, LRB and KMA undertook the analyses; ADB and KMA wrote the first draft of the manuscript. All authors critically reviewed and revised the final version.
Katherine M. Appleton: Conceptualisation-Lead, Formal analysis-Lead, Funding acquisition-Lead, Writing – original draft-Equal, Writing – review & editing-Equal; Aleksandra D. Bielat: Formal analysis-Equal, Investigation-Equal, Writing – original draft-Equal, Writing – review & editing-Equal; Danielle J. Guy: Investigation-Equal, Writing – review & editing-Equal; Lucy R. Boxall: Formal analysis-Equal, Writing – review & editing-Equal; Neshat Karami: Investigation-Equal.
Financial support
This trial was funded by The Coca-Cola Company, USA. The funders had no role in the design or development of the trial and took no part in running the trial or interpreting the trial findings.
Competing interests
This trial was funded by The Coca-Cola Company, USA. In the area of sugar reduction and sweet taste, KMA has also received research funding from Unilever R&D Vlaardingen, NL, the International Sweeteners Association, BE, a consortium of the American Beverage Association, Arla Foods, Cargill R&D Centre Europe BVBA, DSM-Firmenich SA, International Sweeteners Association, SinoSweet Co., Ltd, Cosun Nutrition Center and Unilever Foods Innovation Centre Wageningen; from ILSI-North America, USA, the Institute for the Advancement of Food and Nutrition Sciences (IAFNS), USA, Ajinomoto Health and Nutrition North America, Inc., USA, and UNESDA, BE. She has received speaker’s expenses from the International Sweeteners Association; PepsiCo; ILSI-North America; EatWell Global and SEVA (The Hellenic Soft Drinks Industry Association), Greece. Other authors have no conflicts to declare.
Ethical statement
Ethics approval was gained from the Research Ethics Committee of Bournemouth University, UK (ID: 46699) on 12·12·2022, and the trial was registered on Clinicaltrials.gov (ID: NCT05684757) on 03·01·2023. The trial was run in accordance with the Declaration of Helsinki (1983), the Ethical Guidelines of the British Psychological Society and Bournemouth University’s Research Ethics Code of Practice. All participants provided written informed consent prior to participation.
Consent for publication
All authors approve the final manuscript. Consent for publication has been obtained from all necessary parties.
Declaration of generative AI or AI-assisted technologies in the writing process
None used.




 Open access

