I. INTRODUCTION
Non-oriented silicon steel sheets are manufactured to provide specific magnetic properties and can be produced from Fe–Si or Fe–Si–Al alloys. Reference Steiner1 The most desired magnetic properties are high permeability and low magnetic core loss, both of which depend on microstructure parameters, e.g., grain size, texture intensity, and precipitate density. Reference Moses2–Reference Szpunar and Bunge5 It is well known that increasing grain size lowers the core loss since it reduces the area of grain boundaries which can restrain the movement and rotation of magnetic domains during magnetization. Reference Shiozaki and Kurosaki6 It is a classical method to control the grain size of electrical steels through governing the precipitation of fine particles. Reference Sidor and Kovac7–Reference Lee and Cooman10
The nano-sized precipitates are harmful to magnetic properties of non-oriented silicon steel. It has been known that the fine sulfides can prevent the grain growth and increase the core loss of the non-oriented silicon steel sheet. Reference Irie, Matsumura, Nakamura, Shianaka and Suzuki11 The formation mechanisms of the sulfide produced in casting, Reference Chojecki and Bogacz12,Reference Oikawa, Ishida and Nishizawa13 oxide metallurgy, Reference Liu, Kobayashi, Yin, Kuwabara and Nagai14,Reference Wakoh, Sawai and Mizoguchi15 and steel semi-products Reference Osio, Liu and Olson16 had been investigated in the last twenty years.
The grain growth inhibition by particles was first quantified by Zener, Reference Smith17 who developed a simple model which described the pinning of grain boundaries by immobile particles. Afterward, other models on the inhibition of recrystallization by precipitates formed from micro-alloying elements were presented. Reference Gladman18,Reference DeArdo, Ratz and Wray19 The hypotheses behind all these models are based on the concept that the grain growth will stop when the driving force is smaller than or equal to the pinning force. Reference DeArdo, Ratz and Wray19–Reference Hansen, Vander Sande and Cohen22
Particle pinning on grain growth has been extensively studied experimentally and theoretically. The pining effect of aluminum nitrides was qualitatively presented by Nakayama et al. Reference Nakayama and Honjou23 on the study of the non-oriented semi-processed electrical steel sheet, where the particles (<0.5 μm) containing grains were not coarsened during high-temperature annealing. Andrey et al. Reference Karasev and Suito24 studied the relationship between austenite grain sizes and the surface area of grains/particles, and suggested that the austenite grain growth is inhibited by increasing the interfacial area between grains and particles. Titov et al. Reference Titov, Inoue and Suito25 indirectly verified the grain-growth-inhibiting effects of TiC and ZrC precipitates in Fe–0.15–0.30 mass% C alloy according to the experimental result that the grain growth only occurs with the dissolution of grain-boundary TiC precipitates. More recently, the effect of nitride particles on the grain growth in a Fe–20 mass% Cr alloy during heat treatment was investigated by Janis et al. Reference Janis, Karasev, Nakajima and Jőnsson26 In their study, the pinning effect of nitride particles on grain growth was investigated in situ on the sample surface. Zhou et al. Reference Zhou, Li, Wan, Li and Wu27 established that the particles in the size range from 0.3 to 1.2 μm can effectively pin the grain boundary and strongly retard the grain coarsening in heat affected zone (HAZ) of Ti/Zr deoxidized steel.
The aforementioned studies mainly focused on assessing the qualitative relationship between precipitates and grain growth, while less attention was paid to quantify the effect of precipitates on grain growth based on the result of the experiment. This study focused on the pining effect of precipitates on the grain boundary. The goal is to reduce the inhibition effects of precipitates on grain growth, thus enhancing the magnetic properties of non-oriented silicon steel.
II. EXPERIMENTAL PROCEDURE
The samples were cut from a sheet of non-oriented silicon steel in the processes of hot-rolling, continuous-annealing, and stress-relief-annealing, which were labeled as HR, CA, and SA, respectively. The chemical composition of the investigated material is presented in Table I. The ingot was hot-rolled to 2.5 mm and then was annealed at about 1100 K, followed by cold rolling to 0.5 mm thick. Continuous annealing was performed after cold rolling for several seconds at 1100 K. Then, the temper rolling and stress relief annealing for several hours at 1123 K were performed sequentially.
Chemical composition of the non-oriented electrical steel (wt%).

Precipitates in the polished samples were detected in a scanning electron microscopy (SEM; Apollo 300, CamScan, Cambridge, United Kingdom) equipped with energy dispersive spectrometry (EDS). 75 micrographs in each sample were taken at 3000× magnification. The images consist of 15 continuous observation areas in the horizontal direction and 5 continuous observation areas in the vertical direction. The size and number of precipitates were analyzed using Image-Pro Plus (IPP). Then, the surfaces of samples were re-polished using 0.04 μm colloidal silica slurry for 4 h in a Vibratory Polisher (VibroMet 2, Buehler, Chicago, Illinois), and photoed with electron back-scattered diffraction (EBSD) detector. The grain sizes were measured using Channel 5 software.
After SEM characterization, the samples were then analyzed by X-ray diffraction (XRD). The XRD profiles of the samples were conducted on a conventional diffractometer (D/max 2550V, Rigaku Corporation, Tokyo, Japan) using Cu Kα radiation operating at 40 kV and 250 mA with a scan speed of 8°/min. The diffraction angle (2θ) was scanned over a wide angle range of 30–90° to ensure that the α-Fe (110) peak can be detected. The dislocation densities were calculated from the full width at half maximum (FWHM) of diffraction peaks performed by X-ray diffraction to clarify the effect of dislocation on grain growth.
III. RESULTS
A. Analysis of precipitates
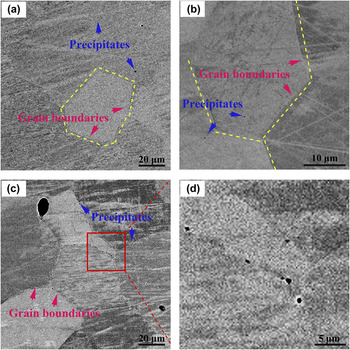
Unetched samples for the observation of precipitates and microstructures were characterized. Figure 1 shows the SEM images of the HR, CA, and SA samples. The grain boundaries (marked with white dotted lines) were well defined in all samples. All three samples showed a ferrite microstructure. The images show that the precipitates (indicated by blue arrows) exist in all the investigated samples, which appear spherical. The precipitates are mainly dispersed inside the grains [see Figs. 1(a) and 1(b)] in HR and CA samples and are mostly located at the grain boundaries [indicated by pink arrows in Fig. 1(c)] in the SA sample. The diameters of the grain-boundary precipitates were measured to be in the range of 0.3–0.7 μm [Fig. 1(d)].
Typical SEM micrographs showing the grain boundaries and precipitates of (a) HR, (b) CA, and (c) SA samples; (d) the partial enlarged view of the red square area in the SA sample.

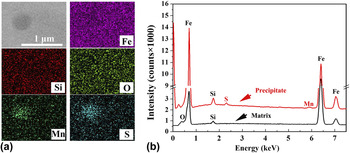
Typical elemental mapping images of the grain-boundary precipitate are displayed in Fig. 2. EDS mapping images in Fig. 2(a) reveal that the precipitate is rich in both Mn and S. The peaks of Fe, O, and Si in the EDS spectrum [Fig. 2(b)] were attributed to the contribution of the ferrite matrix as the EDS spot size was larger than the size of precipitate. Hence, the precipitates at grain boundaries were identified as manganese sulfides. The manganese sulfides can exist in three forms: the stable α-MnS with a rock-salt type structure and octahedral shape, and two metastable tetrahedral structures, β-MnS (sphalerite type) and γ-MnS (wurtzite type). Reference Skromme, Zhang, Smith and Sivananthan28,Reference Wang, Sivananthan and Sporken29 Taking into account that no octahedral shaped manganese sulfides can be found, the precipitates are likely β-MnS or γ-MnS. Reference Zhang, Yi, Wang, Shi, Wang, Qiu and Liu30
(a) Elemental maps scanning and (b) EDS analysis of a typical precipitate.

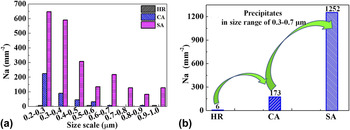
In consideration of the fact that the precipitates beyond 1 μm play no role in inhibiting grain growth Reference Geiger31 and that below 0.2 μm can be hardly detected by SEM, the precipitates with the size range between 0.2 and 1 μm were examined quantitatively. Figure 3 shows the histogram of the precipitates size distribution, which was generated using 75 SEM micrographs captured continuously at 3000× magnification. After counting and measuring the size of precipitates observed in the fields, the results were grouped with an interval of 0.1 μm [Fig. 3(a)]. As mentioned above, the size of precipitates at grain boundaries is mainly in the range of 0.3–0.7 μm. Hence, this work focuses on the effect of the precipitates in the size range of 0.3–0.7 μm. The precipitate densities (number of precipitates in unit area) within 0.3–0.7 μm in all the samples were shown in Fig. 3(b). The data show that the precipitate densities are 6, 173, and 1252 mm−2 in HR, CA, and SA samples, respectively.
The number of precipitates per unit area (a) in all detected size range and (b) in the size range of 0.3–0.7 μm.

B. Analysis of grain sizes
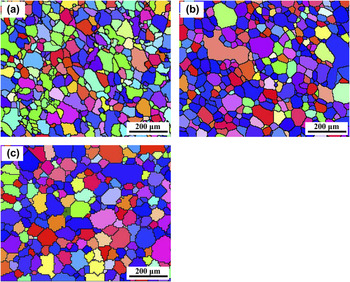
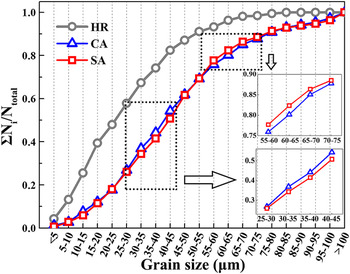
Figure 4 shows the grains of the investigated samples. The grain sizes of the three samples were quantified by Channel 5. The average grain sizes of the HR, CA, and SA samples are 28, 46, and 46 μm, respectively. As can be seen, the average grain size of the CA sample is equal to that of the SA sample, whereas that of the HR sample is much smaller. The grain size distribution is plotted in Fig. 5. The grains with a size of less than 40 μm account for 70% of the total grains for the HR sample, while only about 44% for both of the CA and SA samples (Fig. 5). That means the continuous annealing can result in significant grain growth, while stress relief annealing introduces nothing for this.
Grain maps in (a) HR, (b) CA, and (c) SA samples for accurate grain size calculation.

Grain size distributions in HR, CA, and SA samples.

IV. DISCUSSION
A. Precipitation behavior
Sulfur is one of the surface active elements, which tends to segregate to the grain boundary. Reference Heiple, Roper and Stagner32 Grain boundary segregation can be divided into equilibrium grain boundary segregation (EGS) and non-equilibrium grain boundary segregation (NGS). Reference Xu and Cheng33 NGS is dominant for sulfur segregation at low temperature in sulfur content steels. Reference McLean34 According to the theory of NGS, sulfur can interact with vacancies to form vacancy–sulfur complexes. Reference Aust, Armijo, Koch and Westbrook35,Reference Anthony36 During isothermal annealing, these complexes diffuse toward the grain boundaries much faster than isolated sulfur atoms. In view of the fact that grain boundary can be the sink for point defects, the vacancies in complexes that diffused to grain boundaries would disappear, resulting in enrichment of sulfur at the grain boundaries. Reference Zhang, Lin and Yu37
Faulkner Reference Faulkner38 and Xu Reference Xu39 showed that grain boundary segregation reached the maximum level when annealing approached a critical time. The critical time (t c) can be estimated by equating the flux of complexes toward the grain boundaries to the impurity (sulfur) flux toward the grain interiors, using the following relationship Reference Xu40 :
 $${t_{\rm{c}}} = {{\left[ {{D^2}\ln \left( {{{{D_{\rm{c}}}} \over {{D_{\rm{i}}}}}} \right)} \right]} \mathord{\left/ {\vphantom {{\left[ {{D^2}\ln \left( {{{{D_{\rm{c}}}} \over {{D_{\rm{i}}}}}} \right)} \right]} {\left[ {\delta \left( {{D_{\rm{c}}} - {D_{\rm{t}}}} \right)} \right]}}} \right. \kern-\nulldelimiterspace} {\left[ {\delta \left( {{D_{\rm{c}}} - {D_{\rm{t}}}} \right)} \right]}}\quad ,$$
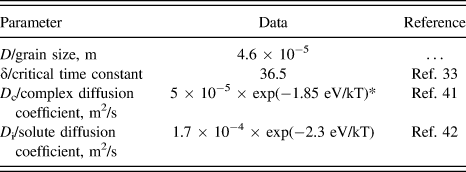
where D is the average grain size, δ is the critical time constant, D c is the diffusion coefficient of the complex, and D i is the diffusion coefficient of the solute in matrix. The parameters are summarized in Table II. Reference Xu and Cheng33,Reference Gale and Totemeier41,Reference Van Vlack, Riegger, Warrick and Dahl42 The grain boundary segregation was analyzed only in the CA and SA samples since just a few precipitates can be detected in the HR sample. The t c in the CA and SA samples was calculated to be about 14 min, much longer than the time for continuous annealing treatment but shorter than that for the stress relief annealing treatment in this study. This indicates that the segregation of sulfur at grain boundary is more likely to occur in the stress relief annealing rather than in continuous annealing.

This work indicates that manganese sulfides precipitate heavily in the SA sample. As the stress relief annealing proceeds, a number of sulfur atoms segregates along the grain boundary and the diffusion of manganese occurs simultaneously. When the solubility product of manganese and sulfur supersaturates, MnS nucleates at the grain boundaries. The growth of MnS occurs at grain boundaries with the diffusion of manganese and sulfur. Reference Xiao, Wilbrandt and Haasen43,Reference Hao, Kang, Zhao and Hao44
B. Grain growth behavior
Grain size is controlled by the competition between the driving and pinning forces for grain growth. When the driving force exceeds the pinning force, grain growth tends to occur. Reference Mason45
1. Driving force of grain growth
Grain growth is conventionally driven by the reduction of either the stored strain energy or the grain boundary energy. Reference Srolovitz, Grest, Anderson and Rollet46 It is generally accepted that the strain energy is proportional to the dislocation density. Reference Deus, Fortes, Ferreira and Vander Sande47 The grain boundary energy depends on the grain curvature which is always substituted for grain size in previous studies. Reference Shahandeh and Militzer48,Reference Williamson and Hall49
According to the Dunn equation, Reference Williamson and Smallman50,Reference Kisko, Talonen, Porter and Karjalainen51 dislocation density (D) is related to the FWHM of diffraction peaks,
 $$D = {{{\beta ^2}} \over {k{b^2}}}\quad ,$$
where k is a constant, generally selected as 4.35 for metal materials. Reference Yang, Huang, Thorogood, Jiang, Ye, Li and Zhou52 β is the FWHM of diffraction peaks in radian which is identified by the XRD method, and b is the mode of burgers vector which is taken as 0.248 nm. The equation indicates that D is proportional to β.
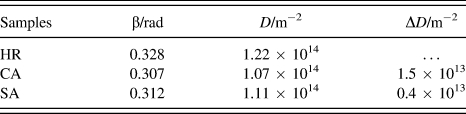
The values of the dislocation density were quantitatively calculated according to Eq. (2). The FWHM of diffraction peaks and the calculation results of dislocation density were shown in Table III. According to the model of strain-induced grain boundary motion, Reference Beck and Sperry53 the driving force (F d-D) for recrystallization coming from the dislocation density can be expressed as
 $${F_{{\rm{d - D}}}} = {{\mu {b^2}\Delta D} \over 2}\quad ,$$
where μ is the shear modulus (4 × 10⁴ MN/m2 for low carbon steel), and ΔD is the change in dislocation density. The growing grains must overcome an initial retarding force (F T), Reference Haessner54
 $${F_{\rm{T}}} = {{2\gamma } \over R}\quad ,$$
where γ is the grain boundary energy per unit area (taken as 0.8 J/m2) and R is the average grain size. The critical ΔD for grain growth can thus be descripted as
 $${{\mu {b^2}\Delta D} \over 2} \ge {{2\gamma } \over R}\quad .$$
According to this equation, the critical ΔD was calculated to be about 2.8 × 10¹³ both for the CA and the SA samples. The actual changes of the dislocation density (listed in Table III) are smaller than the critical ΔD. Hence, the driving force provided by dislocation density on the grain growth is negligible in this study.
FWHM (β), dislocation density (D), and the change in dislocation density (ΔD) in HR, CA, and SA samples.

Another possible driving force for grain growth is provided by the reduction of grain boundary energy. A theoretical equation modified by Gladman Reference Gladman55 was often used for calculating the driving force, F d-G, for grain growth as shown in Eq. (6),
 $${F_{\rm{d}}} = \left( {{3 \over 2} - {2 \over Z}} \right)\left( {{\gamma \over R}} \right)\quad ,$$
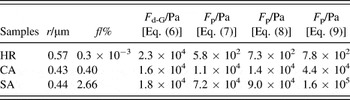
where Z is the size advantage (the ratio of the maximum grain size to the average grain size), which is calculated to be 2.9, 3.4, and 4.1 for the HR, CA, and SA samples, respectively. The values of F d-G calculated by Eq. (3) are given in Table IV.
The calculated driving forces (F d-G) and pinning forces (F p) of precipitates (0.3–0.7 μm) in HR, CA, and SA samples.

2. Pinning force of grain growth
The pinning effect of precipitates on grain growth is caused by the reduction in grain boundary areas. Reference Gladman55 The pinning force was first analyzed by Zener Reference Smith17 with the assumption of the spherical, equal-sized, and random distributed precipitates [Eq. (4)]. Rigid boundary model (RBM) [Eq. (5)] is a modification of Zener formula, which assumes that the motion of a rigid boundary is capable for interacting with the particles lying within ±r of the boundary plane (r is the radius of the particle). The calculated values are somewhat of an underestimate as the pinning effect of precipitates inside the grains cannot be completely ignored sometimes. Another model called flexible boundary model (FBM) Reference DeArdo, Ratz and Wray56 [Eq. (6)] presumed that an infinitely flexible boundary can interact with every particle of radius r within a single plane of a three-dimensional array until fully pinned. Therefore, the pinning force predicted from the FBM is greater than those calculated from the RBM and Zener formulas, because a larger number of particles interact with the moving boundary in the FBM,
 $${F_{\rm{P}}} = {{3f\gamma } \over {2r}}\;\left( {{\rm{Zener\ formula}}} \right)\quad ,$$
 $${F_{\rm{P}}} = {{6f\gamma } \over {\pi r}}\;\left( {{\rm{RBM}}} \right)\quad ,$$
 $${F_{\rm{P}}} = {{3{f^{{2 \over 3}}}\gamma } \over {\pi r}}\;({\rm{FBM}})\quad {\rm{,}}$$
where γ is the grain boundary energy per unit area (taken as 0.8J/m2) Reference Chapa, Medina, López and Femández57 ; f and r are the volume fraction and the radius of particles in size of 0.3–0.7 μm, respectively. The values of the driving and pinning forces obtained by different methods and hypotheses were calculated and listed in Table IV.
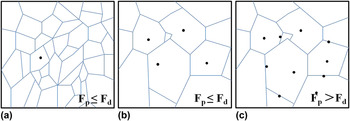
The calculated values show that the driving force is higher than the pinning force in the HR sample. Hence, the precipitates (0.3–0.7 μm) in the HR sample cannot inhibit the migration of grain boundaries, which results in the grain coarsening. Without regarding for the overestimate of the result calculated by FBM model, the driving force is slightly larger than the pinning force in the CA sample. Thus, the grain growth is less likely to occur in the CA sample. The number of precipitates increases dramatically at the grain boundaries in the SA process. The pining force is considerably larger than the driving force, which leads to the result of grain growth inhibition in the SA sample. The grain size distributions for the HR, CA, and SA samples shown in Fig. 5 are well consistent with the calculations.
However, the slight decrease in small-sized grains (25–45 μm) accompanied by an increase in medium-sized grains (55–75 μm) (see Fig. 5) indicates that a few small-sized grains are growing during the SA process. It can be concluded that a few finer grains which have much larger driving force [according to Eq. (6)] can grow up, and the motion of a large amount of grains is impeded by the precipitates (0.3–0.7 μm). The relationship between the precipitation behavior and the grain growth from hot rolling to stress relief annealing is illustrated briefly in Fig. 6.
Schematic diagram of precipitation and grain growth in (a) HR, (b) CA, and (c) SA samples.

V. CONCLUSIONS
We characterized the morphology, the composition, the and density of the precipitates in non-oriented silicon steel in different processes. The influence of precipitates on grain growth was analyzed by comparison of driving and pinning forces. We concluded as follows:
-
(1) The spherical precipitates that gathered along grain boundaries were identified as either β-MnS or γ-MnS. The nucleation and growth of MnS were attributed to diffusion of manganese and to segregation of sulfur on grain boundaries resulting from the interaction of sulfur with vacancy.
-
(2) Precipitates were low in density (6 mm−2) in the HR sample, but much higher (more than one hundred) in the CA sample, and even up to one thousand in the SA sample.
-
(3) Driving force for grain growth was mainly determined by the curvature of grain boundaries, rather than the density of dislocation.
-
(4) Grain growth was stopped in the stage of stress-relief-annealing because of the presence (ranging in size from 0.3 to 0.7 μm) of precipitates at grain boundaries.
ACKNOWLEDGMENTS
This work was supported by the National Natural Science Foundation of China (No. U1460103). We thank Dr. Han in the National High Magnetic Field Laboratory of USA for insights, Dr. Tyler for editing, and the Instrumental Analysis & Research Center in Shanghai University for support.