

I INTRODUCTION
. . .la longue marche vers une francophonie moyenne passe sous les fourches caudines du tu et du vous. (Calvet, Reference Calvet1976: 188)
Let us begin by recognizing, as Louis-Jean Calvet suggests in the quotation above, that becoming a competent speaker of French (as a first, second, additional, etc. language) entails coming to understand the complexities and ambiguities associated with the second-person address system – that is, the choice to use tu (T) or vous (V) when addressing another individual. Although the reference to the ill-fated Roman soldiers marching into an ambush and having no other choice but to negotiate surrender may make Calvet's characterization of the issue a bit overly dramatic, it nevertheless effectively highlights the difficulty involved in negotiating the French second-person address system for native and non-native speakers (and learners) alike.
This article reports on perceptions of appropriate T/V use among self-identified native, near-native, advanced-level and intermediate-level second language (L2) speakers of French between the ages of 18 and 29 who completed a web-based survey that explored awareness of pragmatic conventions. The survey asked participants to make a variety of judgements related to appropriate language use, including T/V choice, in a series of five social-interactive contexts. The survey also included judgements regarding the formality of the context, the degree of closeness or distance in the relationship, and so on. To be sure, there is not necessarily a direct correspondence between participants’ responses and their actual use of T/V in concrete communicative activity, and I want to clarify from the outset that no such claim is made here. Rather, the survey was designed to glean insight into respondents’ evaluations of the norm, in the sense that Labov (e.g., Reference Labov1972) gave to the term. It is, briefly put, about an ideal, about what respondents think ought to be done rather than what they and others actually do. Responses to the survey therefore reflect participants’ symbolic action (Golato, Reference Golato2003) rather than their material action (i.e., language use).
2 TU, VOUS AND THE INDEXICAL ORDER
2.1 Power, solidarity and social indexicality
Coveney (Reference Coveney2010: 127) characterizes the choice between T and V, and related morphological forms, as ‘possibly the most salient of all sociolinguistic phenomena in French’. His review of T/V research highlights a variety of disciplinary, theoretical and methodological perspectives extended to the domain. Much of the early work on French T/V was informed by Brown and Gilman's (Reference Brown, Gilman and Sebeok1960) semantic approach to analysing the constructs of power and solidarity. The power semantic was associated with V whereas the solidarity semantic was associated with T.
Research since the late 1960s has expanded approaches to include socio-psychological methods (e.g., Lambert and Tucker, Reference Lambert and Tucker1976), ethnography (e.g., Morford, Reference Morford1997), analyses of recorded conversations (e.g., Martiny, Reference Martiny1996), interviews and focus groups (e.g., Gardner-Chloros, Reference Gardner-Chloros1991, Reference van Compernolle2007), and corpus analysis of computer-mediated French discourse (e.g., Williams and van Compernolle, Reference Williams and van Compernolle2007, Reference Williams and van Compernolle2009). This more recent research has expanded and advanced our understanding of the social meaning of T/V choice, originally characterized as static power or solidarity relationships (Brown and Gilman, Reference Brown, Gilman and Sebeok1960), to include a malleable system of meaning, or ‘orders of indexicality’ (Silverstein, Reference Silverstein2003). As Morford (Reference Morford1997: 5) writes, this entails ‘first and most straightforwardly, the capacity to “index”, or point to, the relative formality of settings and occasions, as well as degrees of deference and/or intimacy between the speaker and addressee; and second, the capacity to signal certain aspects of an individual speaker's identity within the wider social order’ (see also Mühlhäusler and Harré, Reference Mühlhäusler and Harré1990). Accordingly, the indexicality approach recognizes the import of such factors as power/deference and social distance/intimacy but in a way that is flexible and personal rather than static and universal. In this way, the social indexicality approach is more semiotic than semantic (cf. Brown and Gilman, Reference Brown, Gilman and Sebeok1960) because it conceives of T/V use in particular, and of all sociolinguistic communicative acts in general (Eckert, Reference Eckert2008; Silverstein, Reference van Compernolle2003), as a process in which social meaning is emergent, reified and modifiable in language use (van Compernolle, Reference van Compernolle2011). In short, while such factors as formality, social distance and power are important, there are no steadfast or immutable rules governing T/V choices because indexical meanings are variable and malleable from one individual to the next.
2.2 Tu/Vous in French as second (or additional) language
Given the complexities of the indexical nature of the T/V system, it is understandable that second language (L2) learners of French experience significant difficulties learning to use T and V is socially appropriate and meaningful ways (Belz and Kinginger, Reference Belz and Kinginger2002). Indeed, Dewaele and Planchenault (Reference Dewaele, Planchenault and Faraco2006) observe that while beginning-level learners of French perceive the choice between T and V to be relatively straightforward, based on rather simplistic rules related to formality and politeness, learners with more experience in a wider range of non-pedagogical social-interactive contexts (e.g., through study abroad) perceive the choice as increasingly complex and difficult to navigate. This is why Dewaele (Reference Dewaele2004) uses the metaphor of a sociolinguistic tightrope to describe T/V choice. Kinginger (Reference Kinginger2008) also emphasizes the complexities of developing pragmatic competence (i.e., awareness of and ability to use T/V) in the context of study abroad. She notes that individuals’ socialization experiences and histories as language learners contribute to their appropriation of meaning-making resources, resulting in highly variable developmental trajectories and outcomes.
Learner textbooks often offer advice for selecting T and V, usually based on simplistic rules of thumb (e.g., T is friendly, V is polite) and/or lists of contexts of use (e.g., use T with friends and family, use V with strangers). Though provided with the best of intentions, such simplistic descriptions do not come close to characterizing the indexical meaning potentials of T and V (van Compernolle, Reference van Compernolle2010). Pedagogical research has, accordingly, attempted to make form-function-meaning relationships visible to learners in more systematic ways. Approaches include functional-analytic instruction (Lyster, Reference Lyster1994), discussions of intercultural differences (Liddicoat, Reference Liddicoat2006), and instruction centered on systematic explorations of concepts such as indexicality, self-presentation, social distance and power in relation to pragmatic resources (van Compernolle, forthcoming). This research shows that instruction can help learners to develop greater awareness of the complexities of T/V choice and the meaning potential of the T/V system.
2.3 Rationale for the current study and research questions
As stated in the introduction, this article provides a direct comparison of perceptions of appropriate pragmatic behaviour (i.e., T/V) in relation to the factors of formality, social distance and power between native, near-native and advanced and intermediate L2 speakers of French. To my knowledge, the present study is the first to do so. This is not to say that L2 French research has not been informed by native speaker data, but it is the case that this research does not systematically compare native and nonnative speakers’ perceptions of appropriateness using the same data collection instrument or method. The rationale for limiting the population to survey respondents between the ages of 18 and 29 is to focus specifically on the age-peers (and near peers) with whom university learners of French are likely to interact if they happen to study abroad. In this sense, the study's goal is indirectly – though importantly – related to L2 development and instruction (e.g., teaching learners the complexities and meaning-making potential of T/V; see van Compernolle, forthcoming). The specific questions to be addressed in this article are the following:
RQ 1: What differences, if any, are there in judgements of formality, social distance and power/equality?
RQ 2: What differences, if any, are there in perceptions of appropriate tu/vous use?
RQ 3: How, and to what extent, do judgements of formality, social distance and power/equality correlate with tu/vous choice?
3 METHODS
3.1 Survey design
The survey was designed to elicit perceptions of the appropriateness of several pragmatic features of discourse. The present article focuses exclusively on responses relevant to T/V choice in French. The survey included five social-interactive situations, based on materials used in a previous study exploring L2 instructional pragmatics (van Compernolle, forthcoming):
Situation 1: You are at a local café one evening and a friend of yours, Jean, comes in. He walks over to your table and greets you.
Situation 2: You're at a party with a friend, Paul, and his girlfriend, Sophie, arrives. You've never met her before, so Paul introduces the two of you.
Situation 3: You're going to a café that you've been frequenting regularly for about three months because it's a nice place to watch soccer matches. You've gotten to know the owner, Jean-François, fairly well. He's about 40 years old and very friendly to all his customers.
Situation 4: You're at the grocery store looking for some cheese for a small dinner party you're having with some friends. Unfortunately, you don't see the cheese you wanted. You decide to ask the clerk, a young woman in her early 20s.
Situation 5: You are at the bus stop on your way home, and you accidentally step on someone's toe. You look and see that it's a woman dressed in business attire who looks to be in her mid 40s, and she seems angry. You want to apologize and tell her you didn't do it on purpose.
The situations include differing levels of formality and social relationship qualities (see below).
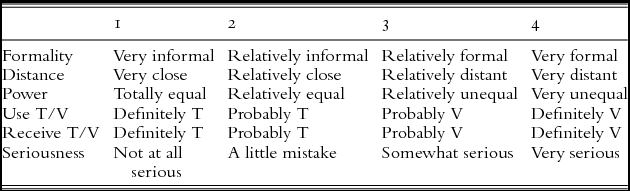
For each situation, respondents rated the formality of the context, the degree of social distance in the relationship, and the amount of equality/power in the relationship. In addition, they indicated their preference to use T or V, their expectation to receive T or V, and their perception of the seriousness of using the ‘wrong’ pronoun. Response options were forced-choice, meaning there were no options for ‘I'm not sure,’ or ‘I don't know’. This was done in order to increase the number of usable responses in the analysis (Wivagg, Reference Wivagg and Lavrakas2008). The questions and response options were as follows:
3.2 Data collection
Recruitment for the study was done by email, and the survey was administered online via Survey Monkey (http://www.surveymonkey.com) for a period of approximately six weeks, between early October 2012 and mid December 2012. The recruitment email was sent to professional email lists (e.g., the AFLS listserv) as well as to the author's personal professional contacts, who were asked to forward the survey to colleagues and students. Although it is not possible to know exactly who responded to the survey, given the recruitment procedures it is likely that participants include educated individuals, most of whom were either university or (post)graduate students, or teachers/university professors of French. Additionally, it is important to note that recruitment and the survey were conducted in English, meaning that native French speaker participants were bilingual, or at least had sufficient proficiency in English to complete a questionnaire. (The interested reader is referred to Wilson and Dewaele, Reference Wilson and Dewaele2010 for a critical discussion of the advantages and limitations of web-based surveys in L2 and bilingualism research, including sampling issues.)Footnote 1 In total, 260 people responded to the survey, of which 161 completed it.
3.3 Participant information
The present article focuses on younger speakers (i.e., under 30) (see above). Accordingly, respondents self-identifying as 30 years of age or older were excluded from analysis. A total of 71 respondents reported being between the ages of 18 and 29. However, eight of them did not respond to one or more of the survey items, and they have therefore been excluded from the analysis, leaving a final total of 63 participants. There were 19 native speakers (4 men, 15 women), 5 near-native speakers (1 man, 4 women), 17 advanced L2 speakers (3 men, 14 women), and 22 intermediate L2 speakers (11 men, 11 women). Because of the overall imbalance in the representation of men and women, it was not possible to explore potential gender differences. A preliminary analysis of intermediate-level L2 speakers, where there is a gender balance, however, revealed no discernable gender-related patterns. An overwhelming majority (all but one) of the intermediate L2 speakers reported that they had spent less than a month in a French-speaking country, while over half of the advanced L2 speakers reported spending at least nine months in a French-speaking country. All near-natives reported having spent at least one year in a French-speaking country, all but one reporting that their stay was for two or more years.
3.4 Analytic procedures
Following data collection, participant responses were converted to numerical values (range = 1 – 4) for statistical analysis (see Table 1). In order to test whether or not differences between the groups were statistically significant, the non-parametric Kruskal-Wallis one-way test of variance was used. Significance was set at p < 0.05. In addition, correlation coefficients (r) between T/V choices and ratings of formality, social distance and power were calculated as a way of exploring in what ways, if at all, perceptions of sociopragmatic factors are related to pragmatic choices. Squared correlation coefficients (r 2) were calculated as a means of estimating the relative importance of sociopragmatic factors in respondents’ T/V choices.
Numerical values assigned to survey responses.

4 RESULTS
Results for each situation are reported below as separate analyses (i.e., one situation at a time). In other words, each situation from the survey is treated as its own ‘mini study’ in order to evaluate and particularize the differences in ratings of formality, distance, power, as well as respondents’ preferences for T and V and their judgements of the seriousness of using an inappropriate pronoun.
4.1 Situation 1: The friend
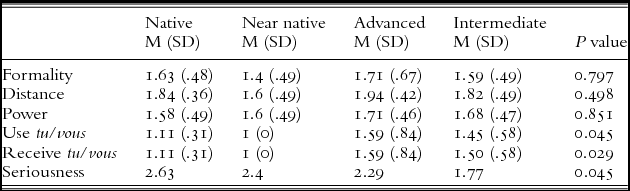
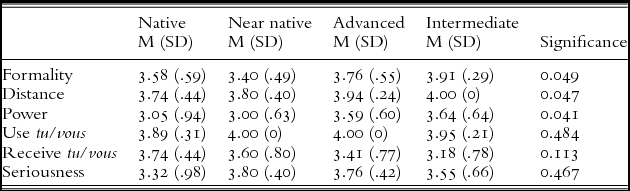
Situation 1, meeting a friend at a café, was intended to represent a relatively unambiguous context in which the use of T would be the conventional choice because of the relative informality and low degree of social distance or a hierarchical power relationship in the situation. Indeed, participants’ responses (Table 2) support this interpretation. All four groups have low average values for formality, social distance and power. None of the observed differences are statistically significant.
Mean scores, standard deviations and significance for situation 1.
All four groups also agreed that T was the most appropriate pronoun to use and that they would expect to receive T. Nonetheless, there are statistically significant differences for both questions. The differences are due to the fact that natives and near-natives responded with more commitment to T (i.e., choosing ‘definitely T’) than advanced and intermediate speakers, who as a group tended to choose ‘probably T’ more frequently. There are also significant differences for participants’ judgements of the seriousness of using the wrong pronoun. Native and near-native speakers judged wrong pronoun use to be on the more serious side of the rating scale, while advanced and intermediate speakers tended to judge it as less serious.
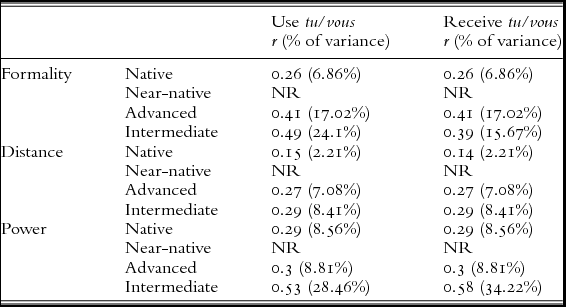
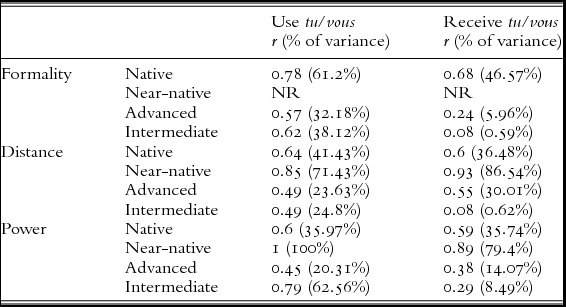
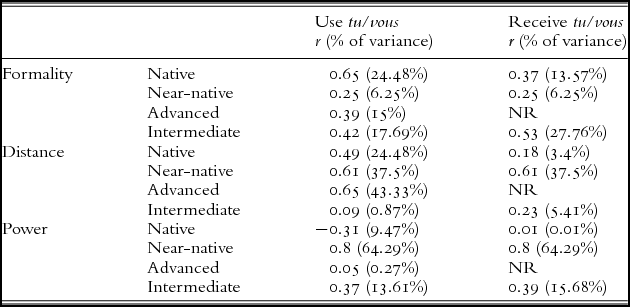
Correlation analysis also revealed differences between the groups (Table 3). On the one hand, there are no data relationships (NR) for near-natives, all of whom selected ‘definitely T’ for ‘use T/V’ and ‘receive T/V’. On the other hand, while formality is only weakly correlated with T/V judgements among native speakers, there are moderate positive correlations for advanced and intermediate L2 speakers. Distance does not appear to be an important factor for any of the groups, as all the positive correlations are either negligible (natives) or weak (advanced and intermediate). However, power emerges as a relatively important factor for intermediate L2 speakers, whereas positive correlations are weak for natives and advanced L2 speakers.
Correlation coefficients (r) and per cent of variance for situation 1.
4.2 Situation 2: The friend's girlfriend (first meeting)
Situation 2, meeting a friend's girlfriend for the first time at a party, represented a relatively informal context in which a tu/vous relationship would be initiated between strangers but, presumably at least, with minimal social distance and power differences because they have a mutual friend/close relationship. Table 4 displays results for each question related to this situation.
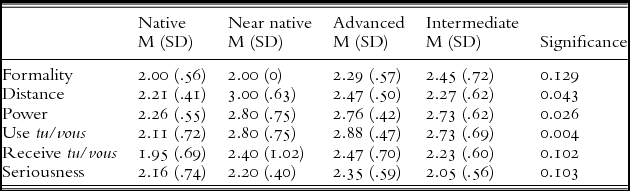
Mean scores, standard deviations and significance for situation 2.
Significant differences are observed between the groups regarding ratings of formality and distance. Both natives and near-natives judged the situation to be on the more informal side of the continuum, while advanced and intermediate responses were approximately evenly split between ‘relatively informal’ and ‘relatively formal’. Natives also tended to assign less social distance to the relationship than did near-natives and advanced and intermediate L2 speakers. Differences in ratings of power were not statistically significant, however.
Striking differences are also present between groups in relation to their preferences for using and receiving T/V. Natives and near-natives tended to opt to use T and to expect T in return, while advanced and intermediate L2 speakers leaned more toward using V and expecting V in return. It should, however, be noted that more variation in responses among advanced and intermediate L2 speakers, whose responses included all four options (i.e., definitely T, probably T, probably V, definitely V) than among natives and near-natives, as indicated by the differences in standard deviations. In other words, there was more agreement among natives and near-natives than among advanced and intermediate L2 speakers, who appear to be less certain about appropriate pronoun choice as a group (see also Dewaele, Reference Dewaele2002).
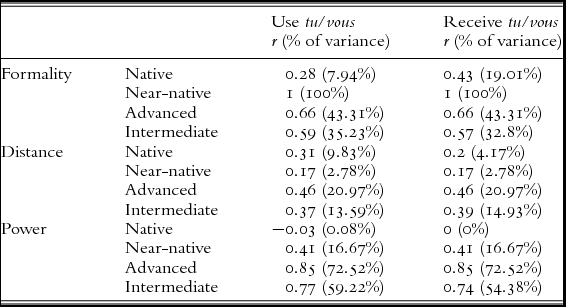
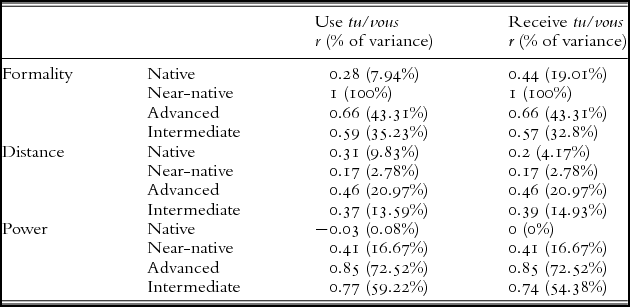
Correlation coefficients and percent of variance figures for the relationship between T/V choices and formality, distance and power judgements are presented in Table 5. Formality has a weak correlation with use of T/V among natives, but there is a perfect correlation among near-natives and moderate, high correlations among advanced and intermediate L2 speakers. Near-natives’ responses to the ‘receive T/V’ question are also perfect, while natives have a moderate, low correlation and advanced and intermediate L2 speakers have moderate correlations. There are low correlations between distance and T/V choices for both natives and near-natives, whereas correlations are moderate among advanced and intermediate L2 speakers. Correlations between power and T/V choices are very low/negligible among natives, while they are moderate for near-natives and strong among advanced and intermediate L2 speakers.
Correlation coefficients (r) and per cent of variance for situation 2.
4.3 Situation 3: The friendly barman
Situation 3, addressing a 40-something café owner/barman who is a friendly acquaintance, was designed to include some ambiguity. Although the convention for service encounters is to use V, respondents were told that they had got to know the barman fairly well, a factor potentially leading to the use of T. In addition, the barman is somewhat older (i.e., in his 40s) than the respondents (ages 18 to 29), which introduces another factor for respondents to consider. Results are shown in Table 6.
Mean scores, standard deviations and significance for situation 3.
There are no significant differences between the groups with regard to judgements of formality: all of them – on average – tended to rate the context as relatively informal. Nevertheless, advanced and intermediate L2 speakers tended to give a slightly higher formality rating. There are significant differences, however, in ratings of social distance and power. Near-natives rated the relationship as having more social distance than did natives and advanced and intermediate L2 speakers. Natives judged the relationship to involve less of a power difference than did the other groups.
With regard to T/V choices, the ‘use T/V’ question produced significant differences. Natives tended to choose ‘probably T’ whereas the other groups leaned more toward ‘probably V’. Although differences for the ‘receive T/V’ question are not significant, it is interesting to point out that near-natives and advanced and intermediate L2 speakers converged with native speakers to a greater degree (i.e., toward the ‘receive T’ option) than in the ‘use T/V’ question. In other words, while near-natives and advanced and intermediate L2 speakers tended to opt to use V, they also tended to expect T in return, whereas natives’ responses tended to be T for both questions. Differences for the seriousness of using the wrong pronoun are not significant: all groups tended to rate wrong pronoun use as not very serious.
As the figures in Table 7 show, there are a number of moderate and strong correlations between T/V choices and ratings of formality, distance and power. There is a strong correlation between natives’ judgements of formality and their choice to use T or V, and a moderate, high correlation with their expectation to receive T or V. For advanced and intermediate L2 speakers, the relationship between formality judgements and use of T/V is also moderate. However, the correlations between judgements of formality and expectations to receive T/V are low (advanced) and negligible (intermediate). No data relationship exists among near-natives as they categorically rated the context as ‘relatively informal’. Distance is moderately correlated with natives’ and advanced L2 speakers’ choices to use and receive T/V, while for near-natives this relationship is stronger. For intermediate L2 speakers, there is a moderate correlation between distance and use of T/V, but a negligible one for their expectation to receive T/V. Finally, power moderately correlates with T/V choices among natives, and the relationship is strong to very strong among near-natives, and there is a moderate to low correlation among advanced L2 speakers. For intermediate L2 speakers, there is a strong correlation between power and use of T/V, yet a weak correlation exists between power and their expectation to receive T/V.
Correlation coefficients (r) and per cent of variance for situation 3.
4.4 Situation 4: The young supermarket clerk
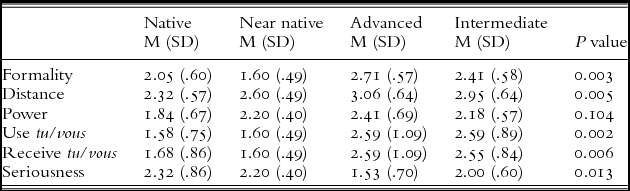
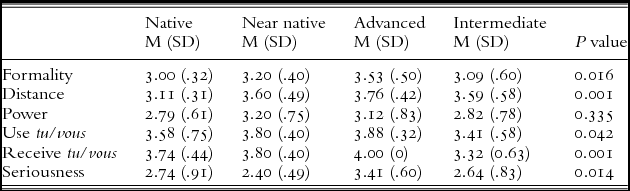
Situation 4, addressing a 20-year-old supermarket clerk, was also designed to introduce some degree of ambiguity. Although V is the convention in service encounters, the young woman described in the situation represents a peer or near-peer of the respondents in this study (based on age), which may lead some to select T as an appropriate choice. Results for this situation are provided in Table 8.
Mean scores, standard deviations and significance for situation 4.
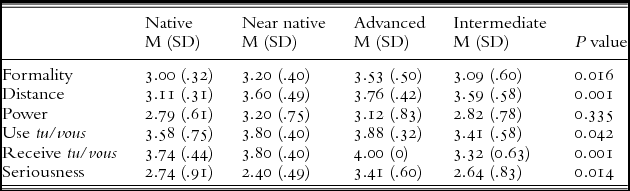
Significant differences between the groups emerge for ratings of formality and distance. Natives, near-natives and intermediate L2 speakers leaned in the direction of ‘relatively formal’, while advanced L2 speakers tended to judge the situation as more formal at significantly higher frequencies. Natives tended to rate the relationship as ‘relatively distant’ whereas near-natives and advanced and intermediate L2 speakers leaned in the direction of ‘very distant’. Differences in power ratings are not significant: all four groups hover around the ‘somewhat unequal’ rating.
There are also clear preferences among all four groups to use and to receive V in this situation. Despite this apparent convergence, there are significant differences between the groups. Native, near-native and advanced L2 speakers demonstrated more commitment to using V with the supermarket clerk than did intermediate L2 speakers. Likewise, native, near-native and advanced L2 speakers had a stronger expectation to receive V than did the intermediate group. With regard to the seriousness of using the wrong pronoun, advanced L2 speakers stand out from the other groups in that they tended to rate inappropriate T/V use as ‘somewhat serious’ to ‘very serious’.
Correlation coefficients and percent of variance presented in Table 9 also illustrate differences between the groups. There is no data relationship between the ‘receive T/V’ question and formality, distance, and power for advanced L2 speakers, who categorically chose the ‘definitely V’ response option. There is, however, a moderate, high correlation between formality and use of T/V among natives, whereas this relationship is weak for near-natives and moderate, low for advanced and intermediate L2 speakers. Formality is also weakly correlated with expectations to receive T/V for natives and near-natives, while this relationship is moderate for intermediate L2 speakers. Correlations between distance and use of T/V are moderate for natives, near-natives and advanced L2 speakers, but negligible for intermediate L2 speakers. With regard to the ‘receive T/V’ question, there are weak correlations with distance among natives and intermediate L2 speakers, whereas the relationship is moderate among near-natives. Power appears to be unrelated to T/V choices among natives and advanced L2 speakers, yet the relationship is strong for near-natives and moderate for intermediate L2 speakers. It is interesting to point out that there is a weak negative correlation between power and use of T/V among natives, which indicates that even if natives tended to rate power as low, they still demonstrated a strong preference for the use of V.
Correlation coefficients (r) and per cent of variance for situation 4.
4.5 Situation 5: The business woman at a bus stop
The final situation in the survey was intended to put respondents into the rather awkward context of needing to apologize to a middle-aged businesswoman whose toes they had just stepped on at the bus stop and who appeared to be angry. The expectation was that this situation would produce high formality, distance and power scores, as well as a strong preference for V. The results, presented in Table 10, confirm the expectation.
Mean scores, standard deviations and significance for situation 5.
Differences between the groups’ judgements of formality, distance and power are statistically significant, despite the fact that there was agreement that the situation is rather formal, and that there is social distance and power inequality in the relationship. Natives and near-natives rated the context as closer to ‘relatively formal’ compared to advanced and intermediate L2 speakers, whose perceptions of formality approached ‘very formal’ at higher frequencies. Similarly, advanced and intermediate L2 speakers rated the relationship as having more social distance (especially the intermediates, who categorically rated the context as ‘very formal’) than did natives and near-natives. In relation to power, natives and near-natives perceived the relationship as ‘somewhat unequal’ whereas advanced and intermediate L2 speakers tended to rate it as ‘very unequal’.
None of the differences related to T/V choice are significant. All four groups showed a strong preference to use V. There was also a relatively strong expectation to receive V in return. However, it is interesting to point out that advanced and especially intermediate L2 speakers appeared to be less certain of this choice, as they tended to opt for the ‘probably V’ response, although overall these differences are not statistically significant. Ratings for the seriousness of using an inappropriate pronoun were high overall.
As Table 11 shows, formality and distance are weakly correlated with T/V choices among natives, with the exception of the moderate positive correlation between formality and expectations to receive T/V. By contrast, formality is perfectly correlated with T/V choices among near-natives, and there are moderate correlations among advanced and intermediate L2 speakers. Advanced and intermediate L2 speakers’ T/V choices are also moderately correlated with perceptions of social distance, whereas this relationship is weak/negligible among near-natives. Differences with regard to power are substantial. Among natives, power is virtually unrelated to their T/V choices, yet there are moderate correlations among near-natives and strong correlations among advanced and intermediate L2 speakers.
Correlation coefficients (r) and per cent of variance for situation 5.
5 DISCUSSION
As the results reported above have shown, there are a number of differences, but also similarities, between the four groups analysed and across the five situations included in the survey. The sections presented below synthesize the results in relation to the three research questions addressed in this article.
5.1 What differences, if any, are there in judgements of formality, social distance and power/equality?
Significant differences in formality ratings were found for situations 2 (the friend's girlfriend), 4 (the young supermarket clerk) and 5 (the businesswoman at the bus stop), but not situations 1 (the friend) and 3 (the friendly barman). Advanced and intermediate L2 speakers tended to judge situations 2, 4 and 5 to be more formal than did native and near-native speakers. This finding suggests that advanced and intermediate L2 speakers associate formality with first meetings/interactions with strangers, which is seemingly not the case for their native and near-native counterparts. This interpretation is bolstered by the lack of statistically significant differences between the groups for situations 1 and 3, where the respondents already knew the interlocutor.
There were also statistically significant differences for perceptions of social distance between the groups for situations 2, 3, 4 and 5, but not situation 1. Advanced and intermediate L2 speakers judged the relationship with the friend's girlfriend to have a higher degree of social distance than did native and near-native speakers. The same was true for situation 5. A different pattern emerged for situation 3. Near-natives appeared to be more conservative in their responses in comparison to the other groups, judging the relationship with the friendly barman to be ‘relatively distant’, whereas natives and intermediate L2 speakers tended to select ‘relatively close’ and advanced L2 speakers were in the middle. For situation 4, near-native, advanced and intermediate L2 speakers all judged the relationship to be more distant than did native speakers. Overall, the three groups of nonnatives tended to perceive first meetings (situations 2, 4 and 5) to entail more social distance than native speakers. Near-natives stand out, for their part, in their judgements of distance in situation 3, which were significantly higher than the other three groups even though the friendly barman was described as an acquaintance.
Statistically significant differences were found in the groups’ ratings of power for situations 3 and 5, but not situations 1, 2 and 4. The three nonnative groups all judged there to be somewhat more inequality in the relationship with the friendly barman than did the natives. Interestingly, near-natives had the highest power rating, meaning that the biggest difference was between natives and near-natives, which was also the case for ratings of distance (see above). Although the reason for this is unclear, this particular finding suggests that near-natives are significantly more conservative in their perceptions of this particular social relationship (i.e., a service encounter with an acquaintance) than their native-speaker counterparts. With regard to situation 5, however, natives and near-natives responded nearly identically (i.e., ‘relatively unequal’), whereas advanced and intermediate L2 speakers rated the power difference to be higher.
In sum, there is a tendency for nonnatives to be somewhat more conservative in their judgements of formality, social distance and power in comparison to native speakers. Advanced and intermediate L2 speakers appeared to be especially sensitive to first meetings/interactions with strangers. Near-natives tended to be more conservative with regard to judging the relationship qualities involved with a service employee whom they had got to know fairly well (i.e., the friendly barman). Although only speculative, one possible explanation for these differences is that nonnatives, especially advanced and intermediate L2 speakers who have limited, if any, French-language socialization experiences, position themselves as cautious outsiders who are careful not to presume too much informality, closeness/intimacy, or equality with their native French-speaking interlocutors. To be sure, the present study does not include autobiographical data to support this idea directly; however, it does align with findings reported in the study abroad literature that has included journal/diary data and interviews (e.g., Kinginger, Reference Kinginger2008) as has some of the work in L2 instructional pragmatics (e.g., van Compernolle, forthcoming).
5.2 What differences, if any, are there in perceptions of appropriate tu/vous use?
There were several statistically significant differences in responses to the ‘use T/V’ and ‘receive T/V’ questions. In the case of situation 1, the differences were due to the degree of certainty. Although all groups tended to select T as the appropriate pronoun to use and to receive, advanced and intermediate L2 speakers appeared to be less committed to this choice compared to native and near-native speakers. In other words, their responses suggested some caution, or at least the possibility of variation, in choosing T/V. In situation 2, however, advanced and intermediate L2 speakers tended to lean in the direction of using and receiving V, whereas native and near-native speakers tended to select ‘probably T’. To recall the discussion presented above, this finding provides further support for advanced and intermediate L2 speakers being more cautious, and potentially erring on the side of more formality/politeness, in comparison with native and near-native speakers who, almost by definition, have much more socialization experience in French-speaking settings. Nonnative pragmatic conservatism was also present in situation 3 in relation to the ‘use T/V’ question: all three nonnative groups leaned in the direction of using V whereas natives tended to opt for T use with the barman. However, the non-native groups had lower values for the ‘receive T/V’ question, thereby aligning with the native speaker group (hence, the lack of statistically significant differences for the ‘receive T/V’ question). This suggests that although they would likely use V, they would expect T in return, further evidence of pragmatic caution (i.e., erring on the side of using the more polite V even if they expected to be called the more familiar T in return). A different pattern was evident in situation 4. Near-natives and advanced L2 speakers leaned in the direction of ‘definitely V’, while natives and intermediate L2 speakers were closer to ‘probably V’. Thus, while there was agreement that V was more appropriate, the near-native and advanced groups appeared to be more committed to this choice. No significant differences were found for situation 5: all four groups strongly tended to select ‘definitely V’ in response to the ‘use’ question, and ‘probably V’ in response to the ‘receive’ question.
Several significant differences regarding perceptions of the seriousness of inappropriate T/V use also emerged in the analysis. Native and near-native speakers tended to rate inappropriate T/V use as more serious in situations 1 and 2 (the friend and the friend's girlfriend) than did advanced and intermediate L2 speakers. In situation 4, advanced L2 speakers judged inappropriate T/V use to be much more serious than did the other three groups. Differences in seriousness ratings were not statistically significant for situations 3 and 5. It is also interesting to point out that advanced and intermediate L2 speakers’ seriousness ratings for situations 1, 2 and 3 were substantially lower than for situations 4 and 5. Such a pattern is not found among natives and near-natives. There is a potential link here between age-peer status and seriousness ratings, in that advanced and intermediate L2 speakers perceived inappropriate pronoun use with (near) peers as less (negatively) consequential than with interlocutors who were older than them. This inference is certainly only speculative, but it is logical to presume such as link given the focus in many L2 French pedagogical materials on age status as a determining factor in T/V choice (van Compernolle, forthcoming).
5.3 How, and to what extent, do judgements of formality, social distance and power/equality correlate with tu/vous choice?
As the results reported above indicate, T/V choices did not straightforwardly correlate with judgements of formality, social distance and power/equality in a systematic way within or across the four groups. For example, while T/V use choices were only weakly correlated with formality judgements among native speakers in situations 1, 2 and 5, there was a strong correlation for situation 3 and a moderate, high correlation for situation 4. Correlations between T/V choices and formality, social distance and power therefore appear to be context specific. In some contexts, one or more of these factors may not be relevant, while in another it may be determining.
There was, however, a trend for advanced and intermediate L2 speakers’ T/V choices to have higher correlations with formality, social distance and power than those of native and near-native speakers, though this observation was not without exceptions. A possible, though speculative, explanation for this tendency is that in the absence of extensive language socialization experiences, as is the case for native and, presumably, near-native speakers, advanced and intermediate L2 speakers rely more heavily on learned rules related to formality, distance and power (cf. the rules usually taught to L2 French learners; see above and van Compernolle, forthcoming). For natives and near-natives, these factors may be less important, or they may not in fact be independent of one another and/or other factors, because these speakers operate with extensive empirical experience in a variety of social-interactive contexts. This experience is not only relevant for appropriating social conventions, but also – and importantly – for developing personal preferences for making meaning through pragmatic resources (van Compernolle, Reference van Compernolle2011). Accordingly, the lack of straightforward correlations is not surprising and simply underscores the complexities of the French second-person pronoun system.
6 CONCLUSION
As a first study directly comparing native and nonnative (near-native, advanced and intermediate L2 speakers) perceptions of appropriateness in relation to the French T/V system, the present article has underscored the complexities of these pragmatic choices. There were clear differences and similarities between the natives, near-natives and advanced and intermediate L2 speakers, though these differences and similarities were not systematic across the five situations included in the survey.
One principal finding that has important implications for L2 research is that nonnatives, especially advanced and intermediate L2 speakers, appeared to be somewhat more conservative in and/or less committed to their T/V choices in comparison to native speakers. More specifically, nonnatives often tended to assign more formality, social distance and power to the situations than did native speakers. Accordingly, they also tended to be less committed to their pragmatic choices and/or err on the side of ‘more politeness’ through the use of V where natives leaned in the direction of T. As I have argued elsewhere (e.g., van Compernolle, forthcoming), pragmatics-centered L2 instruction ought to highlight learners’ own agentive use of their communicative artifacts, such as T and V, to create the meanings they want to create. This involves developing through instruction a systematic understanding of the meaning potentials of T and V, but also of the complexities involved in the act of second-person address. In other words, it is not enough to teach idealized conventions related to such factors as formality, distance and power; instead, it is necessary to focus on the ways in which T and V operate within the orders of indexicality (Morford, Reference Morford1997; Silverstein, Reference Silverstein2003; van Compernolle, Reference van Compernolle2011). If the results presented above have shown anything, it is that T/V choices and expectations are likely determined by personal choice rather than steadfast, universal rules, and this is something that must be instilled in L2 French learners.
Future research in this domain would do well to improve upon the survey design. For example, one limitation of the present study is that judgements of formality, social distance and power in each situation were scored on the basis of a single questionnaire item. Including multiple questions targeting each construct would likely improve the reliability of the items and the overall validity of the survey by allowing scores for formality, social distance and power to be based on mean ratings across multiple items. Another limitation is that only five situations were included in the survey. Including two or more similar situations (e.g., multiple ‘friend contexts’) would also help to improve survey validity since perception as well as T/V choice scores could be aggregated and averaged across multiple items. A third limitation of the study is that no qualitative data (e.g., open-ended responses) were included. In future research, the inclusion of open-ended questions would help to qualify individual respondents’ judgements and perceptions of appropriateness (e.g. Dewaele, Reference Dewaele, Manchón and Cenoz2008), which would help to address some of the unanswered questions and speculative conclusions raised in the analysis and discussion of this study.