Introduction
There are a number of challenges facing the agriculture industry. In general, production costs are increasing at a faster rate than commodity prices and there is a greater amount of pressure for the industry to produce more with less while still reducing its environmental footprint. Precision agriculture is one solution for addressing some of these concerns. Precision agriculture is a site-specific management technique aimed at increasing efficiency. The foundation of precision agriculture lies in data collection in order to make informed management decisions to address spatial and temporal variability. One of the principle requirements for determining the economic and environmental effects of a precision agriculture management scheme is yield data. Yield data, collected using yield monitoring systems, is essential for evaluating and improving any production system. Many cropping systems, such as grain (Searcy et al., Reference Searcy, Schueller, Bae, Borgelt and Stout1989; Stafford et al., Reference Stafford, Ambler and Smith1991; Borgelt and Sudduth, 1992) and cotton (Perry et al., 1998; Durrence et al., 1999), have commercially available yield monitors to help in increasing efficiency. Despite this industry push towards efficiency, peanut is one of the few major agronomic crops for which a yield monitor is not commercially available. This puts peanut growers at a competitive disadvantage because it does not allow them to assess the results of precision agriculture management plans.
Prior efforts to develop peanut yield monitors did not result in commercialized products because the technologies used resulted in relatively high costs and the companies which licensed these concepts never brought them to market. Vellidis et al. (Reference Vellidis, Perry, Durrence, Thomas, Hill, Kvien, Hamrita and Rains2001) developed the Peanut Yield Monitoring System (PYMS) which uses load cells for instantaneous measurements of harvested peanuts. In this system, load cells were mounted on the collection basket to quantify the load of peanuts accumulating during harvest. The PYMS was successful with a low error on a large scale, however the system was not recommended for use to make management decisions on a fine scale. Since the system measured accumulating weight, the instantaneous yield resolution was not sufficient for finer scale management decisions.
In order to acquire finer resolution data, optical yield monitoring systems have also been investigated. Currently, optical yield monitors are commercially available for cotton. Peanuts, like cotton, are pneumatically conveyed crops, so efforts have been made to adapt cotton yield sensors to peanuts. Thomasson et al. (Reference Thomasson, Sui, Wright and Robson2006) detailed their work to adjust an optical reflectance based mass flow sensor that they had previously developed for cotton (Thomasson and Sui, Reference Thomasson and Sui2000, Reference Thomasson and Sui2003, and Reference Thomasson and Sui2004) to be used on peanuts. The sensor is comprised of light emitters and detectors in the same unit to measure the optical reflectance of peanuts as they are conveyed through the combine duct into the basket. A total of 53 loads of peanuts were harvested using the system in Mississippi, United States and Queensland, Australia. Results showed high correlations between the sum of the sensor outputs and peanut load weights (R2 ranging from 0.89 to 0.96) suggesting promising production use of the yield monitoring system. Thomasson et al. (Reference Thomasson, Sui, Wright and Robson2006) also reported effects of moisture content on system accuracy as well as sensor non-linearity as mass flows increased. Rains et al. (Reference Rains, Perry and Vellidis2005) and Porter et al. (Reference Porter, Taylor and Godsey2012 and 2013) also tested an optical yield monitor, intended for use with cotton, on quantifying yield in peanuts. The commercially available Ag Leader sensor pair was used as accurate yield monitoring systems for peanuts with strong correlations.
The goal of this study were to expand on the work of Thomasson et al. (Reference Thomasson, Sui, Wright and Robson2006) to determine application of their peanut yield monitoring system in a production agriculture scenario. The specific objective of the study reported here was to evaluate the system under harvest conditions typical in southern Georgia, USA.
Materials and Methods
Peanut Harvesting
Peanut plants develop pods, which contain the desirable peanut kernels, in the soil. To prepare for harvest, peanut plants are dug mechanically and the whole plant is inverted before being laid back on the soil surface to dry to a moisture content suitable for harvest. Once peanuts have been dug and inverted, a grower has a window of only a few days to harvest the crop before quality begins to deteriorate. Typically, two rows of plants are inverted into a single windrow. Thus, a 6–row peanut combine harvests three windrows at a time. Tractor-pulled 4-row and 6-row combines and a self–propelled 8–row peanut combine are currently in production.
A peanut combine harvests the peanuts in much the same way as a grain combine fitted with a windrow pickup. This pickup feeds the vine–like plants onto a throat elevator where they are drawn into a series of picking cylinders and over sieves, where the pods are separated from the vegetative section of the plant and fall through stemmer saws. After the stemmer saws, the pods fall into an air duct which spans the width of the machine and wraps up the side of the combine. A powerful centrifugal fan propels the pods and any harvested foreign materials such as soil, pebbles, and small pieces of vine through the duct and delivers them into the collecting basket. The pods and the foreign material are propelled through the duct at approximately 28 m/s.
Field Testing
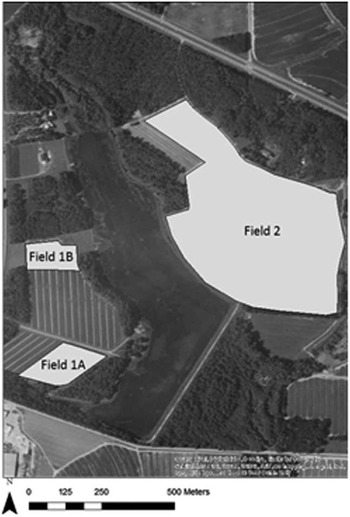
The peanut yield monitor (PYM) system was tested during the 2016 harvest season in September in Tift County, Georgia. A total of 28.9 ha of peanuts were harvested over two fields on the producer’s property using the system (Figure 1). Both fields were predominantly classified as Tifton Loamy Sand and planted with the same variety of peanuts under the same management conditions. Tifton loamy sand consists of deep, well drained moderately permeable soils that contain nodules of ironstone that can range from 3 to 13 mm in size. These ironstone nodules have the appearance of pebbles and typically make up about 12% of the soil by volume (SCS, 1983).
The three fields in which the PYM was evaluated during 2016.

The PYM system was installed onto the producer’s KMC 3386 peanut combine (Kelley Manufacturing Company, Tifton, Georgia, USA) prior to the 2016 harvest season. The header of the combine is 5.5 m wide and harvests 6 rows of peanuts. The PYM consists of two mass-flow sensors, a data acquisition system, and a DGPS receiver. The mass-flow sensors are active optical sensors that contain the energy source and detectors in one single unit. The data acquisition system consists of a 206 mHz, 32-bit low-power central processing unit. Windows CE is used and runs an embedded Visual Basic code with algorithms relating peanut mass flow to the energy reflected by the peanuts. The simplified program includes a “start” and “stop” button to begin and end data collection. Each complete run outputs a single text file that includes latitude, longitude, GPS PDOP (precision dilution of position), speed, and the voltage readings of each sensor collected at 64 Hz, averaged, and stored at 1 Hz. A Trimble DGPS receiver was used to output the GSA and RMC sentences to the data acquisition unit.
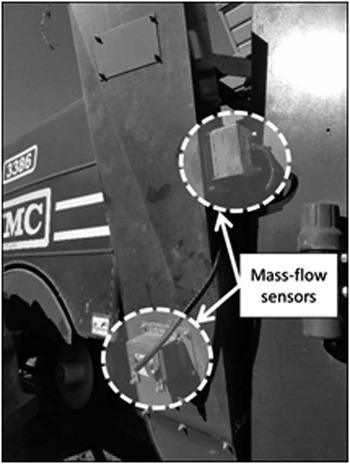
The data acquisition system was mounted in-cab and the DGPS receiver was mounted to the top of the producer’s tractor. Harvested peanuts are conveyed from the body of the combine where the peanut pods are threshed from the vines to the collection basket located at the top of the combine by air flow. Two mass-flow sensors were used and mounted onto the duct which conveys the peanuts as shown in Figure 2. The sensors were installed on separate planes of the duct in order to capture the full range of peanut flow. Sensor placement was determined based on minimizing any interaction from the additional sensor as well as ambient light. The sensors were mounted on the duct in the two locations thought to provide the best potential for the sensors to capture the mass of peanuts flowing by. However, there was concern that soil and pebbles carried through the duct with the peanut pods would abrade the lens of the sensors. The intent was to evaluate several mounting locations during the harvest season.
Mounting location of the two sensors on the duct of a KMC 3386 combine.

Peanuts were harvested beginning 22 September 2016 in three fields located in Tift County, Georgia, USA. Calibration was performed by harvesting a range of peanut weights. Each load was emptied from the basket on the combine to a 6-wheel peanut wagon. The peanut wagon was weighed using truck scales with one scale under each wheel. The accuracy of the truck scales used was ±2.3 kg. To clearly segregate the sensor data collected during each weighed load, it was necessary to create a separate data file for each load used. The total weight of the load was then compared to the sum of the sensor voltage outputs from the data file associated with that load. Each time calibration was performed, a minimum of four loads were weighed. The project team relied on the farmer operating the tractor to create and close the data file. This consisted on tapping a Start or Stop button on the data acquisition system. On several occasions, the farmer forgot to either start or stop the file at the appropriate time thus reducing the number of data files available for calibration on two of the three calibration days. For example, the farmer would remember to start the file several minutes after peanuts had already begun to accumulate in the basket.
Results and Discussion
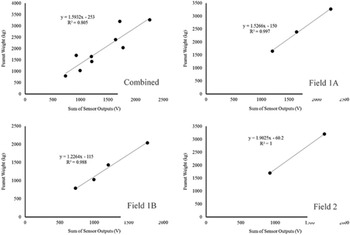
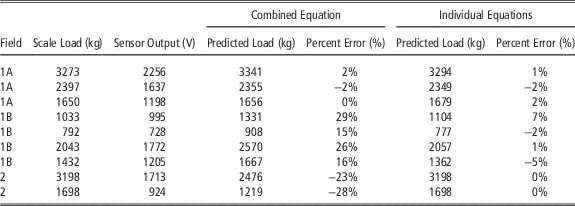
A total of nine loads were used for calibration including three loads from Field 1A, four loads from Field 1B, and two loads from Field 2. Peanut loads used for calibration ranged from 700–3,300 kg (full basket). The sum of the sensor voltage outputs from the individual calibration files were regressed against the associated scale loads and used to generate a calibration equation to estimate yield. Calibration equations were developed for the three individual calibrations as well as for all nine loads combined as shown in Figure 3. A good coefficient of determination (R2=0.805) was observed for the combined equation however, when the resulting regression equation was used to calculate the weight of the individual loads, it was clear that the combined equation was not able to accurately predict the weight of individual loads across all three fields (Table 1). Percent error between the scale load and calculated load was 2% or better for Field 1A while it increased greatly for Fields 1B and 2. When individual calibrations equations were developed for each calibration event, the percent error was reduced to less than 7% for Field 1B. An accuracy comparison cannot be made for Field 2 as only two data files were useable for calibration and thus only two data points were used to develop the regression equation. However, the regression equation is useful in showing that both the slope and the y-intercept of the equations resulting from Fields 1B and 2 are different from the combined equation and the equation for Field 1A (Figure 3). It should be noted that the farmer harvested approximately 12 ha between the calibration loads collected in Fields 1A and 1B and an additional 15 ha between the calibration loads collected in Fields 1B and 2.
Combined and individual curves for Fields 1A, 1B, and 2.

Percent error of PYM based on the combined and individual calibration equations.

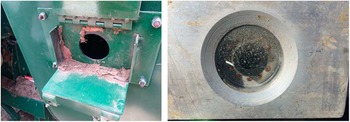
There may be several explanations for this problem but the most likely is that the performance of the sensors was affected by the damage caused to the sensor lens from the impact of pebbles. Figure 4 shows that the upper half of the lens of the sensors became opaque from the abrasion and impacts. The lower half was protected because the sensor lens was slightly recessed from the edge of the duct and the edge of the duct deflected pebbles away from that portion of the lens. Although not clearly visible in Figure 4, both lenses were also deeply pitted from impacts. To address this problem, deflectors were fabricated from ultra-high-molecular-weight polyethylene (UHMW) and mounted inside the duct. The deflectors were tapered with the thin end (3 mm) at the bottom of the duct and the thicker end (6 mm) at the bottom of the sensor opening. This forced the airstream carrying the peanut pods and pebbles away from the opening in the duct where the sensor lens was located. To evaluate the performance of the PYM with the deflectors, the sensor lenses were replaced and the system installed on another KMC peanut combine operated by a farmer in Coffee County, Georgia. Initial evaluation showed that the deflectors greatly reduced the abrasion of the sensors although very light pitting indicated that a few pebble impacts did occur. At the time that this paper was prepared, harvest was still in progress and so the performance of the PYM using the deflector is not included.
Mounting bracket used to mount the sensor on the air duct showing dust accumulation (left) and lens of the sensor located at that position showing abrasion and pitting from the pebbles and other foreign material.

Yield Maps
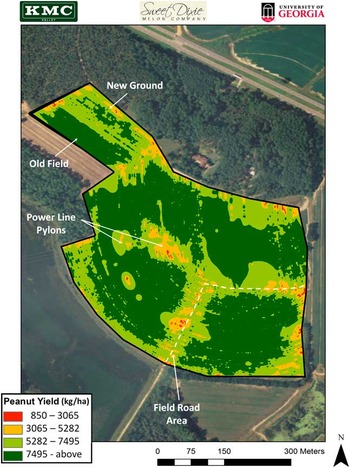
To assess if the PYM with the abraded lenses was still able to capture yield variability in the field, the combined calibration equation was used to develop yield maps for Fields 1A, 1B, and 2. The yield map from Field 2 is presented in Figure 5. The yield map was created using ArcGIS and the Geostatistical Analyst Toolbox. To approximate actual yield values, individual yield data points were increased by 25% to match the percent error shown in Table 1 for Field 2. The inverse weighted distance method was used to contour yield data into a continuous yield map. The farmer indicated that the yield patterns matched his field observations and experiences well and his explanations for the yield variability are given in Figure 5.
Peanut yield map of Field 2 created using the combined calibration equation. Yields were increased by 25% to match the percent error for Field 2.

Conclusion
The optical yield monitoring system evaluated in this study has potential to be used as a yield monitor for peanuts. The data collected during the study show that the system can accurately estimate basket-loads of peanuts. However, the sensor mounting method used in this study resulted in the lens of both sensors being badly abraded by pebbles and perhaps other foreign material. This in turn resulted in large errors over time. A deflector was designed and installed to deflect the pebbles away from sensor lens which appeared to greatly reduce abrasion.
Acknowledgements
Funding for this project was provided by the Georgia Agricultural Commodity Commission for Peanuts and Kelley Manufacturing Company. The authors are grateful to Mr. Alan Parrish and Mr. Ricky Tawzer of Sweet Dixie Melon Company for their participation in the study.