Introduction
Estuaries and saltmarshes have been recognized worldwide as highly productive ecosystems, harbouring a great biodiversity (Kristensen, Reference Kristensen2008; Potter et al., Reference Potter, Tweedley, Elliott and Whitfield2015; Julian & Osborne, Reference Julian and Osborne2018). Estuarine ecosystems are characterized by high variability in environmental parameters (Urbina et al., Reference Urbina, Paschke, Gebauer and Chaparro2010) over short time scales as a result of changing tidal levels and over long time scales as a result of water inputs from rivers and precipitation (Montagna et al., Reference Montagna, Hu, Palmer and Wetz2018). Variability in factors such as temperature, salinity and oxygen in substrates and the water column can result in drastic changes in the estuary conditions (Kerner, Reference Kerner2007; Luppi et al., Reference Luppi, Bas, Méndez-Casariego, Albano, Lancia, Kittlein, Rosenthal, Farías, Spivak and Iribarne2013; Montagna et al., Reference Montagna, Hu, Palmer and Wetz2018; Murrell et al., Reference Murrell, Caffrey, Marcovich, Beck, Jarvis and Hagy2018).
Estuarine systems are especially important habitats for crabs, as many crab species can play key roles in structuring the communities in which they live (Botto & Iribarne, Reference Botto and Iribarne2000; Kristensen, Reference Kristensen2008; Poore et al., Reference Poore, Campbell, Coleman, Edgar, Jormalainen, Reynolds, Sotka, Stachowicz, Taylor, Vanderklift and Duffy2012). Also, they perform diverse trophic roles from potential prey to higher consumers (Brousseau et al., Reference Brousseau, Filipowicz and Baglivo2001; Kim & O'Connor, Reference Kim and O'Connor2007; Grabowski et al., Reference Grabowski, Hughes and Kimbro2008; Hulathduwa et al., Reference Hulathduwa, Stickle, Aronhime and Brown2011). They are also important inter-specific and intra-specific competitors (Brockerhoff & McLay, Reference Brockerhoff and McLay2005; Hulathduwa et al., Reference Hulathduwa, Stickle, Aronhime and Brown2011; Cannicci et al., Reference Cannicci, Fusi, Cimo, Dahdouh-Guebas and Fratini2018) and can be modulators of ecosystem functions and associated services (Martinetto et al., Reference Martinetto, Montemayor, Alberti, Costa and Iribarne2016). Estuarine crabs have high osmo-regulatory and physiological plasticity, allowing them to adapt to a wide variety of environmental stressors (Corotto & Holliday, Reference Corotto and Holliday1996; Bas & Spivak, Reference Bas and Spivak2000; Bianchini et al., Reference Bianchini, Lauer, Nery, Colares, Monserrat and dos Santos Filho2008; Urzua & Urbina, Reference Urzua and Urbina2017; Urzua et al., Reference Urzua, Bascur, Guzman and Urbina2018; Theuerkauff et al., Reference Theuerkauff, Rivera-Ingraham, Roques, Azzopardi, Bertini, Lejeune, Farcy, Lignot and Sucré2018).
Living systems such as populations and communities are highly dynamic and likely to experience frequent changes in their organization and structure (Datry et al., Reference Datry, Larned, Fritz, Bogan, Wood, Meyer and Santos2014). As the natural variability of habitats can affect species' fitness, one could expect decapod, and particularly crab life history patterns to respond to environmental (e.g. salinity, temperature and oxygen) and ecological factors (e.g. competition, predation, mortality and food availability) by exhibiting differences in size frequency distributions (SFD), sex ratios, reproductive periods, size of maturity and recruitment (Lardies et al., Reference Lardies, Rojas and Wehrtmann2004; Posey et al., Reference Posey, Alphin, Harwell and Allen2005; Spivak et al., Reference Spivak, Bas and Luppi2016; Vina et al., Reference Vina, Bascur, Guzman, Riera, Paschke and Urzua2018), as well as migratory movements, lifespan, physiology and growth rates (Baeta et al., Reference Baeta, Cabral, Neto, Marques and Pardal2005; Posey et al., Reference Posey, Alphin, Harwell and Allen2005; Koolkalya et al., Reference Koolkalya, Thapanand, Tunkijjanujij, Havanont and Jutagate2006; Lagos et al., Reference Lagos, Caceres and Lardies2014; Theuerkauff et al., Reference Theuerkauff, Rivera-Ingraham, Roques, Azzopardi, Bertini, Lejeune, Farcy, Lignot and Sucré2018; Bas et al., Reference Bas, Nuñez, Spivak and Luppi2019). Depending on the environment and species, these effects can be expressed equally or differentially in males, females, ovigerous females and juveniles (Bas et al., Reference Bas, Luppi and Spivak2005; Posey et al., Reference Posey, Alphin, Harwell and Allen2005; Taylor & Seneviratna, Reference Taylor and Seneviratna2005).
Hemigrapsus crenulatus (H. Milne Edwards, 1837) (Brachyura, Varunidae) is among the most conspicuous inhabitants of intertidal and estuarine environments in the SE Pacific, distributed in Chile from 18°–55°S and also in New Zealand (McLay et al., Reference McLay, Hinnendael, Lavery and Riquelme-Bugueno2011; Vega-Aguayo et al., Reference Vega-Aguayo, Figueroa-Munoz, Retamal and De los Rios2018). While the important ecological and physiological traits of H. crenulatus have been well-documented (Retamal, Reference Retamal1981; Stuardo et al., Reference Stuardo, Valdovinos, Figueroa and Occhipinti1993; Haye & Ojeda, Reference Haye and Ojeda1998; Brockerhoff & McLay, Reference Brockerhoff and McLay2005; Taylor & Seneviratna, Reference Taylor and Seneviratna2005; Riquelme-Bugueño, Reference Riquelme-Bugueño2006; Retamal & Moyano, Reference Retamal and Moyano2010), few studies have focussed on their population dynamics (i.e. abundance throughout the year and growth). Additionally, there is scant information on the biological processes determining their population structure and productivity.
The Tubul and Raqui rivers form an intertidal marsh-type estuary of coastal origin with a marked seasonal variability coming from the pluvial regime. There is a strong salinity gradient because of the transition between inland and coastal marine waters with mixohaline conditions of high biological productivity (Valdovinos et al., Reference Valdovinos, Sandoval, Vasquez, Olmos, Fariña and Camaño2017). Between autumn and spring months (i.e. April–September), there is cold and humid weather with precipitation reaching 1300 mm annually. In contrast, during summer periods (i.e. December–March) there is a slight dry season with a strong influence of southern winds which promote coastal upwelling and changes in the sea temperature, salinity and chlorophyll (Valle-Levinson et al., Reference Valle-Levinson, Atkinson, Figueroa and Castro2003; Landaeta and Castro, Reference Landaeta and Castro2006; Valdovinos et al., Reference Valdovinos, Sandoval, Vasquez, Olmos, Fariña and Camaño2017).
The objective of this study was to describe the population dynamics of the dominant estuarine crab H. crenulatus in the Tubul estuary. We sought to describe and estimate the following for H. crenulatus: (1) the annual pattern in abundance, size structure and sex ratios, (2) the absolute growth pattern, and (3) the relationship of population traits with environmental variation. We hypothesized that H. crenulatus population structure is better explained by the influence of salinity and temperature in the Tubul estuary. In particular, recruitment of crabs is hypothesized to occur during austral autumn and winter seasons when there are lower salinity and temperature fluctuations, while faster growth will occur during austral summer.
Materials and methods
Study area
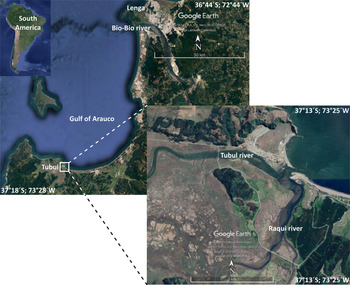
The Tubul river estuary, located at the southern area of the Gulf of Arauco (37°14′S 73°27′W, Figure 1), is characterized by a highly seasonal and productive embayment, frequently impacted by upwelling waters (Valle-Levinson et al., Reference Valle-Levinson, Atkinson, Figueroa and Castro2003; Landaeta & Castro, Reference Landaeta and Castro2006). It is ~17–19 km long, with tidal influence along the first 6 km from the mouth. The river bed is composed of very fine sand with anoxic mud in areas of limited circulation. Gastropods; bivalve shells; algae, mainly Gracilaria chilensis (Bird, McLachlan & Oliveira, 1986); and codgrass, mainly Spartina densiflora (Brongn, 1829) and Sarcocornia fruticosa (L.) (Scott, 1977) are common components of its food web (Alveal, Reference Alveal1988; Stuardo et al., Reference Stuardo, Valdovinos, Figueroa and Occhipinti1993).
Map of the study site: Tubul estuary (South America, Chile). Square indicates sampling site.

The abiotic environment in the Tubul River and adjacent area of the Gulf of Arauco during the study is shown in Figure 2. The temperature pattern in the estuary demonstrated a clear austral summer peak and a winter low. Values above 15°C are typical from November–March. Low temperatures predominated during the rest of the year (Figure 2a). Salinity was far more variable, with multiple peaks over 34, due to the strong marine influence on the estuary. Lower salinities were around 32. Next to the estuary in the Gulf of Arauco, temperature variability presented a clear annual cycle with maximum values during austral spring-summer seasons. Satellite temperature variability during the study period presented a similar pattern to that of in situ temperature values inside the estuary. Furthermore, this variability is concordant with long-term climatology (Figure 2b). Chlorophyll variability followed the temperature trend, with peaks during austral spring-summer time (Figure 2c).
Annual variations of (a) sea surface temperature (°C) and salinity from October 2003 to October 2004 in the Tubul estuary. (b) MODIS SST during the study period (Nov 2003–Oct 2004) and climatology (2002–2010). (c) MODIS chlorophyll during the sampling period (Nov 2003–Oct 2004) and climatology (2002–2010).

Sampling and statistical analysis
Monthly samples of H. crenulatus were taken with a 30 min tow of a 25 cm-diameter, 0.4 cm mesh size net from October 2003 to October 2004 (except July 2004). Sampling was allocated to randomly selected transects parallel to the coastline and performed at low tide. All samplings (N = 12) were carried out at 0.5 m depth on the sandy bottom directly from the mouth of the estuary. The 30 min tow sample was equivalent to 200 m2 of bottom surface. Once collected, samples were preserved in alcohol (~70%) for later analysis. Additionally, in situ sea surface temperatures were recorded with a thermometer, and 0.5 l water samples were taken from sea surface at the start of tows in order to determine salinity in the laboratory. Further, considering the strong influence of the adjacent Gulf of Arauco on the estuary, the broader climatology including satellite sea surface temperature (SST, °C) and chlorophyll-a (Chl-a, mg m−3) with high-resolution procedures (1 km) were processed and estimated using NASA software SeaDAS 6.0 (http://seadas.gsfc.nasa.gov/). Mean climatology (2002–2010) and seasonal evolution during the sampling period in an area of 10 × 10 km next to the estuary are shown in Figure 2.
In the laboratory, carapace length (CL) of each crab was measured with a digital calliper (to nearest 0.02 mm). Sex was determined by inspection of its secondary sexual characters (abdomen and pleon). All individuals were classified into one of three categories: males, females and ovigerous females (carrying eggs). Differences between mean sizes of males and females for the total period were tested with the Student's t-test. The abundance of H. crenulatus in the study site was standardized per area (individuals/200 m2).
For SFD analysis, crabs were arranged into 26 size classes (1-mm each class interval), from 7–33 mm CL, according to both minimum and maximum sizes observed. Normality in the size distributions was checked with the Kolmogorov–Smirnov test (KS) (Zar, Reference Zar1999).
Temporal variations and per-size classes in sex ratio were evaluated by deviations between observed and expected sex ratios (1:1), using the G test to determine their significance (Sokal & Rohlf, Reference Sokal and Rohlf1997).
Monthly length–frequency distributions of collected individuals were plotted, and growth patterns were determined in two ways. The preferred approach was to use a modal progression analysis (MPA), using SFD. Sub-annual individual cohorts were identified from SFD by MPA using the FISAT II software package (Gayanilo et al., Reference Gayanilo, Sparre and Pauly2006) (version 1.2.2.; FAO-ICLARM (Stock Assessment Tools and International Centre for Living Aquatic Resources Management)). Modal distributions were separated from SFD using this method, which assumes that the components are normally distributed (Bhattacharya, Reference Bhattacharya1967). These underlying distributions can be identified as a series of two or more points defining a regression line with a negative slope when logarithms of the ratios of successive frequencies are plotted against the corresponding midpoints (Gayanilo et al., Reference Gayanilo, Sparre and Pauly2006). Two criteria were used to identify the modes: (a) the separation index (SI), a ratio of the difference between the means of the components and their standard deviations (components showing SI greater or equal to two were considered meaningfully separated); (b) confidence interval of correlation coefficients (r 2) of regression lines. When sufficient degrees of freedom were available, the χ2 test was performed to indicate how well expected frequencies fitted the observed ones. When small cohorts could not be identified clearly by MPA, we highlighted those on histograms by using the eye fitting method (Chan & Williams, Reference Chan and Williams2004). Sub-annual cohorts were defined when at least two monthly length modes were present and used to provide estimations of instantaneous relative growth rate (IRG), modified from Botter-Carvalho et al. (Reference Botter-Carvalho, Santos and Carvalho2007), and defined as
 $${IRG = \displaystyle{{Ln( {ML_2} ) -Ln( {ML_1} ) } \over {t_ 2-t_ 1}} \times 100}$$
where, ML2 and ML1 are mean length at time 2 and 1, respectively, calculated from MPA and t 2 – t 1 = elapsed time in months. IRG is expressed as a percentage of length per time period (%mm mo−1).
However, when this was not possible, the von Bertalanffy growth equation was fit to the SFD data. Growth parameters were described with the von Bertalanffy growth model (von Bertalanffy, Reference Von Bertalanffy1938) for all data sets from SFD using a version of the ELEFAN method (Pauly, Reference Pauly, Pauly and Morgan1987) included in the automatic routine of the LFDA software package (Kirkwood et al., Reference Kirkwood, Aukland and Zara2001) (Length Frequency Distribution Analysis, version 5.0.; MRAG (Marine Resources Assessment Group Ltd)). The von Bertalanffy growth equation is described by,
 $${{CL_t = CL_\infty \left[ { 1-e^{{-}k( {t-t_ 0} ) }} \right] }}$$
where CL∞ is the asymptotic size (in mm, that is the mean length a given population would reach if they were to grow indefinitely), k is the constant of annual growth (rate of dimension time−1 at which CL∞ approached), t is the age (in years) and t 0 is the theoretical age at zero length if the population had always grown according to the equation. When it was not possible to estimate some parameter for this method (LFDA), we proceeded to use the routine ELEFAN I included in FISAT II. Furthermore, the growth performance index Φ (Φ = 2 log L∞ + log k) (Munro & Pauly, Reference Munro and Pauly1983) was employed to compare growth parameters obtained in the present work with those reported by Retamal (Reference Retamal1969) in the Lenga estuary, central Chile.
Generalized linear models (GLM) and linear regressions were applied to statistically test the relationship between growth parameters/patterns with environmental variation. Statistica 12 was used for all calculations with significance level set at 0.05.
Results
Size frequency distributions
A total of 1025 specimens of H. crenulatus were collected, of which 652 were males (63.61%), 362 females (35.32%) and only 11 ovigerous females (1.07%). However, ovigerous females were collected all along the year: four specimens in October 2003, two in November 2003, two in December 2003, one in April 2004, one in May 2004 and one in October 2004. All ovigerous females collected were brooding early stage (orange) eggs. Abundance ranged from 30 to 150 individuals 200 m−2.
The monthly size structure for H. crenulatus is described in Figure 3. Mean size in males varied from 22.3 mm (October 2003) to 28.71 mm (February 2004), before again decreasing to 21.19 mm CL (September 2004). In females, mean size varied from 22.97 mm (November 2003) to 26.83 mm (March 2004), decreasing to 19.54 mm CL (May 2004).
Hemigrapsus crenulatus. Monthly variability in the sizes for males and females from October 2003 to October 2004 (except July 2004) in the Tubul estuary.

Sizes of males ranged from 7.72–33.51 mm CL, with an average of 24.06 ± 2.63 (± SD) mm CL. Sizes of females ranged from 11.97–29.58 mm CL, averaging 23.84 ± 1.85 mm CL. Mean sizes did not differ significantly among sexes (t test; t 0.05; 1012 = 0.23; P = 0.82). Males attained larger sizes than females did, 33 mm and 29 mm CL, respectively (Figure 4). Normality analysis showed normal distribution in males (KS test; d = 0.040; P > 0.2), but not in females (KS test; d = 0.077; P < 0.05). Due to the low number of ovigerous females, the normality analysis was not carried out on this population group.
Hemigrapsus crenulatus. Overall size frequency distribution from October 2003 to October 2004 (except July 2004) in the Tubul estuary.

In males, monthly SFD were mostly polymodal (Figure 5). Multiple modes were observed in the population from November 2003 to January 2004 and from August–October 2004. The monthly pattern in size distribution observed in females contrasts with that found in males (Figure 6). Females were most abundant during the austral spring months (August–October), with few individuals collected at other times of the year. During May 2004, the smallest size was observed for males (i.e. 7.7 mm CL) indicating probably the main recruitment period. A similar pattern was observed when male and female data were combined with subtle differences compared with separate sex histograms (Figure 7).
Hemigrapsus crenulatus. Monthly size frequency distribution for males from October 2003 to October 2004 (except July 2004) in the Tubul estuary. Letters indicate the cohorts identified by FISAT.

Hemigrapsus crenulatus. Monthly size frequency distribution for females from October 2003 to October 2004 (except July 2004) in the Tubul estuary. Letters indicate the cohorts identified by FISAT.

Hemigrapsus crenulatus. Monthly size frequency distribution for males and females (combined) from October 2003 to October 2004 (except July 2004) in the Tubul estuary. Letters indicate the cohorts identified by FISAT.

Sex ratio
Sex ratios are shown in Table 1. The overall sex ratio as a function of time was 1.75:1 favouring males, significantly different from the expected 1:1 (G test; G 0.05; 1 = 76.43; P < 0.05). The sex ratio was highly variable through the year. It was male-biased, from November to December 2003, and from February to June 2004. In contrast, the sex ratio was female-biased in October 2003, January 2004 and from August to October 2004. However, when examining sex ratios by size classes, it was found that they were significantly male-biased at 17, 19–21 and 27–29 mm size classes (G test; P < 0.05).
Sex ratio (by month and size class) of Hemigrapsus crenulatus collected between October 2003 and October 2004 (except July 2004) from Tubul estuary, central Chile

Numbers in bold are statistically significant and different from 1:1 ratio (test G; P < 0.05). Values >1 are in favour of males and <1 are in favour of females. n.c., not computed.
Growth patterns
The MPA identified the presence of sub-annual cohorts during the study period: seven cohorts in males (A–H, Figure 8a) and seven in females (I–O, Figure 8b). In males, at least two of the identified cohorts (A and B) were based on coherence of six monthly modes. The remaining cohorts (C–H) represent fewer modes (between three and four). Cohorts A, B and C were followed for the longest duration. The number of cohorts identified in any single month varied. For example, in May and June 2004, four cohorts were identified, whereas only two were identified in April 2004. For females, the seven cohorts identified were tracked for only short periods. Cohort K was tracked for the longest time (from October 2003 to April 2004). However, in accordance with the modes identified in December 2003, at least four different groups of age classes coexisting in that month can be inferred. Due to low numbers of small individuals (<7–12 mm CL), it was not possible to determine with precision and confidence the recruitment period of the identified cohorts based on the data presented here. Figure 8c shows seven cohort progressions when male and female data were combined. This consistency in the observed patterns was more evident for the cohorts identified from October 2003 until May 2004 (cohorts A, C and D) whereas for the remainder of period 3 cohorts were reshaped although keeping a similar trend (Figure 8c).
Hemigrapsus crenulatus. Temporal growth patterns of sub-annual cohorts identified for males (A–H) and females (I–O), and males and females combined (lower panel) from October 2003 to October 2004 (except July 2004) in the Tubul estuary. Modes (mean length ± SD) were estimated from SFD using the Bhattacharya method. Grey rectangle indicates probable recruitment period based on this data.

The observed vs expected normal distributions from MPA were neither significantly different in males nor females (χ2 test; P > 0.5) and presented well-separated modal groups (SI > 2), except values found in November 2003, October 2004 and January 2004 (Table 2). Growth estimates for females are less reliable than those for males, as a smaller number of females were sampled (Table 2).
Modal progression analysis for males and females of Hemigrapsus crenulatus collected between October 2003 and October 2004 (except July 2004) from Tubul estuary, central Chile

Ch, identified cohorts; CL, carapace length mean (in mm); SD, standard deviation of the mean length; N, number de specimens in each cohort; SI, separation index; r 2, determination coefficient. Numbers in bold represent not representatives distributions (SI < 2). n.a. = data not available. Expected and observed frequencies of the normal distributions were always not significant different (χ2 test; P > 0.5).
The IRG ranged from 2.13–30.5% mm CL mo−1 for males and from 3.45–11% mm CL mo−1 for females (Table 3). The IRG estimates varied within cohorts, particularly in males (Table 3). The average IRG values for the study months for males and females were significantly different, showing a higher growth rate in males than in females during the study period. There were also sex-specific seasonal differences in growth (±3.66 SD for males and ±1.96 SD for females, Table 3).
Instantaneous relative growth rate (IRG, in % mm CL mo−1) for each sub-annual cohort for males and females of Hemigrapsus crenulatus collected between October 2003 and October 2004 (except July 2004) from Tubul estuary, central Chile

The asymptotic length (CL∞), growth rates (k) and performance index (Φ) differed based on sex and study area, i.e. Lenga (Retamal, Reference Retamal1969) and Tubul estuaries (this study) (Table 4). The maximum observed lengths (CLmax) were similar for males but different in females from each study area. The values of t 0 were similar, except those calculated by Retamal (Reference Retamal1969) for females (Table 4). The lifespan (t max) was similar between study areas, ranging between 4.16 (50 months) and 4.37 years (52 months) for males and 2.16 (26 months) and 3.29 years (39 months) for females (Retamal, Reference Retamal1969 and this study, respectively).
Growth parameters and performance index of Hemigrapsus crenulatus

In Retamal (Reference Retamal1969) calculated from MPA. In this work: tmax = 3/k (modified from Botter-Carvalho et al., Reference Botter-Carvalho, Santos and Carvalho2007).
a Maximum length observed in the sample.
b Maximum age (lifespan or longevity) calculated in the sample.
Annual patterns and environmental relationships
Generalized linear models (GLM) were applied to establish what environmental variables had better predicted the annual structure of H. crenulatus. Sea temperature and salinity were correlated with H. crenulatus CL, with no difference between sex, and Chl-a correlated with per cent increments in H. crenulatus IGR (Table 5). Additionally, when analysing the annual cycle of sea temperature, this physical variable showed the same temporal pattern as observed in average carapace lengths (Figure 9a), and both variables revealed a significant correlation (r 2 = 0.45; P < 0.024; Figure 9b).
(a) Temporal variation in Hemigrapsus crenulatus carapace length (CL) and sea temperature from October 2003 to October 2004 (except July 2004) in the Tubul estuary; (b) Linear regression between sea temperature and H. crenulatus CL (segmented line) showing 95% confidence intervals (continuous line). Regression equation and statistics are shown.

Generalized linear models performed on Carapace length (CL) and Instantaneous Growth Rate (IGR) as response variables in H. crenulatus and sea temperature (Temp), salinity (Sal) and chlorophyll-a (Chl-a) as predictor variables

For CL, normal distribution and identity-link function were used. For IGR, normal distribution and log-link function were used.
a Only could be computed for CL as categorical predictor variable.
Discussion
We have described the dynamics of size structure, sex ratio and growth of the H. crenulatus population at the Tubul estuary during a one-year period. The relatively low abundance of ovigerous females and small juveniles (<7 mm CL; Retamal, Reference Retamal1969) limits the scope of inference that can be drawn from this study, likely showing that a portion of the population was missed in the sampling.
Differences in the abundance and sex ratio between Lenga and Tubul estuaries can be explained by the different sampling methodology used by the authors and/or environmental differences of the study sites and consequently, exposure of the crabs to the sampling (e.g. juvenile and ovigerous females) (e.g. Johnson, Reference Johnson2003). However, given the time and frequency of sampling, the data suggest a seasonal pattern in the population structure of this species, in terms of its abundance, SFD, sex ratio and growth parameters in the Tubul estuary. The Lenga and Tubul estuaries present similar physico-chemical characteristics (e.g. sea temperature and salinity) in seawater with predominance of fine sand (Díaz-Jaramillo et al., Reference Díaz-Jaramillo, Ferreira, Amado, Ventura-Lima, Martins, Retamal, Urrutia, Bertran, Barra and Monserrat2010). On the other hand, the Lenga estuary has a higher content of organic matter than Tubul does, which has been suggested as an enrichment associated with hydrological dynamics (Moscoso et al., Reference Moscoso, Rudolph, Sepúlveda and Suárez2006; Pozo et al., Reference Pozo, Perra, Menchi, Urrutia, Parra, Rudolph and Focardi2011).
A clear sexual dimorphism was observed in H. crenulatus, with males attaining larger sizes than females. Retamal (Reference Retamal1969) has previously reported this for this species in the Lenga estuary. In addition, the data trend towards males having greater size than that of females in summer months. Size differences may be a result of sexual selection, which has been proposed in other Grapsidae and Varunidae crabs, where the requirement of males to maximize the probability of success when obtaining a mate has been proposed (Wenner, Reference Wenner1972; Hartnoll, Reference Hartnoll2001; Miyajima & Wada, Reference Miyajima and Wada2017). Growth rates in males showed a seasonal pattern, supporting the idea of a temperature-sensitive size increment (see Table 5 and Figure 9); however, data for females do not clearly exhibit such a pattern, because of a probable trade-off between growth and reproduction (Adiyodi, Reference Adiyodi, Burggren and McMahon1988; Nelson, Reference Nelson1991). Several authors have described a lower growth rate in females of several decapod species, and it has been argued to be the result of shorter periods of somatic growth, lower increases in body size, and females not moulting once matured and reducing feeding during ovigerous stages (Schultz & Shirley, Reference Schultz and Shirley1997; Johnson, Reference Johnson2003; Luppi et al., Reference Luppi, Spivak, Bas and Anger2004; Silva et al., Reference Silva, Schwamborn and Oliveira2014). In nature, this lower feeding rate of ovigerous females is the result of an escape behaviour, as they remain hidden to avoid predation (Christy, Reference Christy, Emmett Duffy and Theil2007). Therefore, lower energy consumption and higher metabolic expenditure necessary during reproduction may directly impact the amount of energy available for body growth.
Seasonal migration is a natural process significantly influencing population dynamics (Chen et al., Reference Chen, Yang and Barnes2014; Sicurella et al., Reference Sicurella, Musitelli, Rubolini, Saino and Ambrosini2016). The absence of ovigerous females and spatial segregation of sexes and sizes might be explained by these phenomena. During summer, females and their embryos are exposed to temperature-induced physiological stress. Females try to avoid this stress by migrating towards deeper waters such as the river mouth, outside of the estuary or areas having food available in order to breed and/or release larvae (Warman et al., Reference Warman, Reid and Naylor1993; Tankersley et al., Reference Tankersley, Wieber, Sigala and Kachurak1998; Eggleston et al., Reference Eggleston, Millstein and Plaia2015). Moreover, monthly SFD shows a polymodal pattern, suggesting the presence of several age groups in the population. The observed pattern of spatial segregation by sex and size with marked seasonality has been attributed in other crabs to migratory movements, associated with food availability and refuge; reproductive biology; and environmental factors (Spivak et al., Reference Spivak, Anger, Luppi, Bas and Ismael1994; Bas & Spivak, Reference Bas and Spivak2003; Bas et al., Reference Bas, Luppi and Spivak2005; Luppi et al., Reference Luppi, Bas, Méndez-Casariego, Albano, Lancia, Kittlein, Rosenthal, Farías, Spivak and Iribarne2013).
The lack of juvenile crabs was unusual in our study. Retamal (Reference Retamal1969) reported juvenile stages during austral spring, summer and autumn. For Tubul, SFD analyses suggested that juvenile crabs might appear in austral autumn (April–May) when they accumulate, having a higher proportion in the population. Although unlikely, cannibalism has also been frequently observed by Retamal (Reference Retamal1969), and it could be a factor here, as cannibals can regulate the recruitment of new cohorts within days of settlement (Moksnes, Reference Moksnes2004). The most likely explanation, however, is the spatial segregation of this life history stage with megalopae settling in deeper waters or outside of the estuary and slowly migrating up the estuary as their osmoregulatory ability increases (Urzua & Urbina, Reference Urzua and Urbina2017). Also, probably settling and growth of these stages occur under more favourable conditions present among algae, mussel beds or codgrass located in the subtidal zone until the juvenile stage to avoid intra- and inter-specific attacks (e.g. Larus dominicanus Retamal, Reference Retamal1969; Riquelme-Bugueño, Reference Riquelme-Bugueño2006). Such a distribution would limit their vulnerability to the survey gear used here. Ontogenetic changes in habitat use during the species' life cycle of crabs such as nocturnal behaviour patterns or crypsis are alternative explanations (Carvalho-Batista et al., Reference Carvalho-Batista, Pescinelli, Garcia, Guerra, Pardo and Mantelatto2015).
Retamal (Reference Retamal1969) did find significant deviations from a 1:1 sex ratio for populations of H. crenulatus (i.e. overall sex ratio of 1.9) from the Lenga estuary. Our study, on a different estuary, is in agreement with a similar overall sex ratio of 1.8. Percentages for males and females were very similar (i.e. 65.5 and 63.6% for males in the Lenga and Tubul estuaries, respectively) although with remarkable differences in abundances. However, our results indicate sex ratios favouring males from February–June 2004 and favouring females in the remaining period. Retamal (Reference Retamal1969) did not find at any time sex ratios <1. Stocking density and the fact that various males court more than one female in the reproductive period can certainly affect the sex ratio in the field (Brockerhoff & McLay, Reference Brockerhoff and McLay2005; Waiho et al., Reference Waiho, Mustaqim, Fazhan, Norfaizza, Megat and Ikhwanuddin2015). Sex ratio without significant deviations from 1:1 can indicate that such a population is sexually active or has the same probability of finding mates, making that segment of the population more stable (Wenner, Reference Wenner1972; Leme & Negreiros-Fransozo, Reference Leme and Negreiros-Fransozo1998). In the Lenga estuary, Retamal (Reference Retamal1969) sampled 2822 individuals at the mouth of the estuary during low tide. The H. crenulatus collection was 2.8 times higher in the Lenga than in our study, and the sampling methodology was also different.
Values of maximum length observed were very similar to those presented by Retamal (Reference Retamal1969). However, different values of L ∞, k and t 0 can be explained by differences in the abundance of individuals found in the study areas and for the methodology used by the authors (see Table 4). Differences in the index Φ can be explained, among other factors, by pollution, mortality, agent stressors and differences in the environmental conditions of the study site (Munro & Pauly, Reference Munro and Pauly1983). Despite these differences, the index Φ has been largely accepted to be of great use to compare populations of a particular species from different regions. The Lenga estuary has been historically environmentally polluted (Díaz-Jaramillo et al., Reference Díaz-Jaramillo, Ferreira, Amado, Ventura-Lima, Martins, Retamal, Urrutia, Bertran, Barra and Monserrat2010), supporting the use and comparison of the index Φ.
Differences in abiotic conditions between the Lenga and Tubul estuaries during sampling were found at the same temporal scale (i.e. annual cycle) of sampling. For example, in the Lenga, sea temperature varied between 12.2–21.7°C (mean: 16.1 ± 3.6°C) while in the Tubul it ranged from 10.5–22°C (mean: 15.5 ± 3.3°C). Salinity ranged from 21–33.6 (mean: 29.6 ± 3.3) and 31.1–35.4 (mean: 33.7 ± 1.5) in the Lenga and Tubul, respectively. Rainfall ranged from 0.1–400.5 mm (mean: 127.5 ± 133.9 mm) in the Lenga and from 0.1–255 mm (mean: 92.5 ± 76.5 mm) in the Tubul. Statistical differences were found between estuaries in paired-records of salinity (t-test: 3.4; P < 0.01). This difference agrees with the fact that the Tubul estuary receives freshwater inputs only in the rainy season (Constabel, Reference Constabel1993) in contrast to the Lenga estuary.
Hemigrapsus crenulatus is a good osmoregulator, able to regulate and balance water and ions over a wide range of environmental salinities (Urzua & Urbina, Reference Urzua and Urbina2017). Urzua et al. (Reference Urzua, Bascur, Guzman and Urbina2018) pointed out that H. crenulatus larvae were larger from eggs incubated at high salinity rather than at intermediate salinity. These authors, among others, suggested that salinity during early ontogeny could strongly influence postsettlement-early growth stages (Bas & Spivak, Reference Bas and Spivak2000; Bianchini et al., Reference Bianchini, Lauer, Nery, Colares, Monserrat and dos Santos Filho2008; Urzua et al., Reference Urzua, Bascur, Guzman and Urbina2018).
On the other hand, the higher proportion of larger crabs during the austral summer could be correlated with sea temperature and salinity (Brylawski & Miller, Reference Brylawski and Miller2006; Urzua & Urbina, Reference Urzua and Urbina2017), which may suggest higher capacity to adapt and exploit areas of the estuary than that of smaller crabs. Nevertheless, this correlation of larger crabs (i.e. average size) with sea temperature commonly reflects the proportion of the population sampled in the austral summer, which suggests a faster growth of younger crabs, producing a lower representation of small classes.
Conclusion
Acknowledging that our sampling method might have missed a proportion of the population, we find that our results show a highly dynamic population structure of H. crenulatus in the Tubul estuary, with variations in their abundances, SFD, sex ratios and growth patterns. Data suggest at least one recruitment pulse during the austral autumn and probably occurring over the year. Growth patterns showed a correlation with sea temperature, salinity and Chl-a, suggesting that these environmental factors directly and indirectly modulate the annual cycle of the population. Other factors such as food availability and refuge need to be studied to understand the influence of biotic factors such as competition and predation on the population.
Acknowledgements
This study is dedicated to the loving memory of Professor Marco A. Retamal (1941–2019), who enormously contributed to the knowledge of the taxonomy, biology and ecology of the decapod crustaceans of Chile. He will be remembered for his human qualities by his colleagues and students. We thank Dr Eduardo Spivak for his valuable comments, contributions and suggestions for the first version of the manuscript; Carlos Saldías and Cesar Vera for their collaboration in the fieldwork, Dr Daniel Pincheira-Donoso and Rode Mussiett Gajardo for their enthusiastic support during the entirety of this work.
Financial support
Additional funding was granted by Agencia Nacional de Investigación y Desarrollo (ANID) –Millennium Science Initiative Program – Millennium Institute of Oceanography (IMO) ICN12_019, Fondecyt 3180013 (M.E.L.) and Fondecyt 11160019 and 1210071 (M.A.U.). G.S. was partially supported by Fondecyt 1190805 and the Millennium Institute for Coastal Socio-ecology (SECOS), Millenium Science Initiative Program – ICN2019_015.