Implications
Developing methodologies to assess the nutrition of grazing herbivores is crucial for sustainable grazing management. Studies have attempted to estimate the feed intake of herbivores by administering controlled amounts of supplements labelled with external alkanes. However, the practical application of this remains challenging due to labelling procedure complexities and associated varying faecal recoveries. Our study firstly reports the utilization of alfalfa, which is characterized by distinct marker patterns in comparison to common plant species in steppe grassland, to accurately estimate the feed intake of indoor sheep. This study provides a potential method for monitoring the nutrition of grazing herbivores.
Introduction
Estimating the feed intake of grazing herbivores is critical for determining their nutrition, overall productivity and utilization of grassland resources. Various techniques, such as the cage technique, behavioural observations and indigestible markers (e.g. TiO2 and Cr2O3; Holechek et al., Reference Holechek, Vavra and Pieper1982; Gordon, Reference Gordon1995), have been developed for estimating feed intake. However, assessing feed intake under grazing conditions remains a challenge, and these earlier methods were not always considered reliable due to the inherent complexity of grassland conditions or other numerous sources of errors (Dove and Mayes, Reference Dove and Mayes2005; Smit et al., Reference Smit, Taweel, Tas, Tamminga and Elgersma2005).
By the late 1990s, a plant wax marker technique was developed to estimate feed intake and dietary composition by dosing animals with a known amount of even-chain synthetic alkanes and relating the marker pattern in the faeces to marker patterns found in herbivorous forage (Dove and Mayes, Reference Dove and Mayes1991; Undi et al., Reference Undi, Wilson, Ominski and Wittenberg2008). Based on this technique, Dove and Oliván (Reference Dove and Oliván1998) proposed that total feed intake could be estimated if animals were fed with a controlled amount of a dietary supplement. This method followed the logic that if (a) the amount of the supplement fed to the animals was known and (b) the proportion of this supplement in the diet could be estimated using the plant wax marker technique, then total feed intake could possibly be estimated (Dove and Oliván, Reference Dove and Oliván1998). However, many previously used supplements, such as solvent-extracted oilseed meal and wheat, contained little or no alkanes, and therefore beeswax, as one plant wax marker, was added to these supplements for estimating their dietary proportions (Dove and Oliván, Reference Dove and Oliván1998; Elwert et al., Reference Elwert, Kluth and Rodehutscord2004). Faecal recovery values from diets containing different dietary proportions of beeswax-labelled supplements varied due to the weaker bonds between the surface of the supplements and beeswax alkanes, while a stronger bond exists between roughages and their native cuticular alkanes (Elwert and Dove, Reference Elwert and Dove2005). This may lead to poor estimation of diet composition (Morais et al., Reference Morais, Berchielli, de Vega, Queiroz, Keli, Reis, Bertipaglia and Souza2011; Ferreira et al., Reference Ferreira, López López, Celaya, Osoro and Rodrigues2018) and subsequently, feed intake. Therefore, in order to avoid adding beeswax to the supplements and to decrease the variation in faecal recovery values, it is necessary that other supplements containing high concentrations of natural plant wax markers are developed for estimating feed intake.
The estimation of dietary composition using the plant wax marker technique relies on the hypothesis that the profiles of the plant wax markers differ markedly among the other forage species in the diet (Dove and Mayes, Reference Dove and Mayes1991). Therefore, according to this hypothesis, using a supplement that exhibits distinguishable marker patterns among dietary forage species could increase the accuracy of diet composition estimation. Leymus chinensis grassland is the most important grazing land in northern China where livestock farming contributes predominantly to the livelihood of the local people (Ma et al., Reference Ma, Yuan, Liang and Rong2014). Accordingly, studying the intake and dietary composition of the grazing livestock is of essential economic importance for the sustainable development of local animal husbandry. In this grassland, Lin et al. (Reference Lin, Zhu, Jiang, Luo, Wang, Zhang and Hong2012) found that the majority of consumed forage species by grazing sheep showed distinctly different long-chain alcohol (LCOH) patterns as compared to Medicago sativa. Specifically, C26-alcohol or C28-alcohol was the most abundant LCOH of these forage species, while C30-alcohol was the predominant LCOH of M. sativa. Medicago sativa is widely used as a supplemental protein feed for herbivores (Horney et al., Reference Horney, Delcurto, Stamm, Bailey and Brandyberry1996) and supports a high level of performance (Turner et al., Reference Turner, Wildeus and Collins2005). Hence, it seems that M. sativa has potential use as a natural supplement for estimating the dietary components of herbivores and thus their total intake.
In this study, a 17-day indoor feeding experiment was carried out in northern China. We tested whether the dietary proportion of M. sativa and subsequently, total feed intake, could be accurately estimated in diets containing other plant species that commonly appear in typical steppes. We hypothesized that M. sativa could be used as a tool for estimating feed intake because it exhibits a distinct plant wax marker pattern in comparison to other forage species present in the diets. If the method works well, this study could possibly provide a basis for estimating total feed intake under field conditions.
Material and methods
This study was performed at the National Grassland Ecosystem Research Station (longitude 115°46′N, latitude 41°44′N) in Hebei province China. This area is characterized as a typical temperate zone where L. chinensis is the dominant grassland species. Phragmites australis, Puccinellia distans and Artemisia scoparia also appear frequently in the grasslands.
Animals and diets
A total of 16 Mongolian sheep (6 to 8 months old, BW 30 ± 0.7 kg (mean ± standard error)) were randomly selected and housed separately in metabolism cages in a 17-day experiment. The sheep were randomly allocated to four diets (four sheep per diet) containing between two and four types of forage, that is, Gramineae (L. chinensis, P. distans, P. australis and Elymus sibiricus), Leguminosae (M. sativa), Chenopodiaceae (Chenopodium album) and Asteraceae (A. scoparia and Artemisia tanacetifolia). The forage species selected for the experimental diets followed the advice of local herdsmen; thus they were regarded as the typical dietary components of sheep in this region. Considering that M. sativa exhibits a distinguished plant wax marker pattern and is also rare in the local experimental area, it was thus used as the supplement in this study.
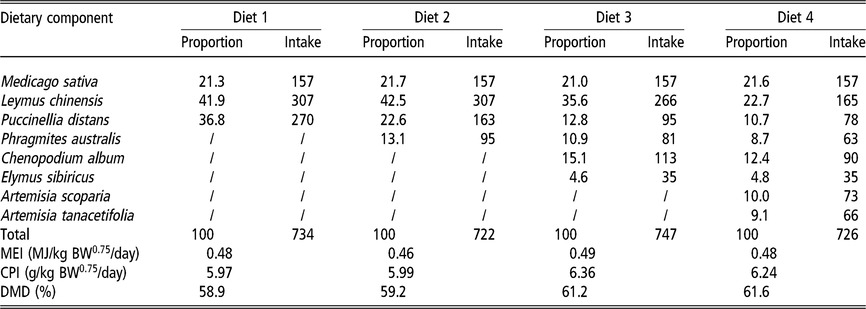
Medicago sativa was harvested within a day at the initial bloom stage from the local monoculture grassland. It was then naturally air-dried, ground, mixed with water and then processed into pellet feed, which was made prior to the feeding experiment. During the entire process, we ensured that no impurities were added into the pellets. Fresh forages were separately collected daily from local natural grasslands and chopped into particles of less than 2 cm length to avoid that sheep would select particular forage species or leaves or stems (Lin et al., Reference Lin, Luo, Zhang and Shu2007). All the dietary components were weighed separately according to the required dietary composition and their water contents, which were determined before the feeding experiment. The fresh forages were then mixed thoroughly and prepared for feeding to the sheep the following day. The proportion and actual intake of each forage and the nutritive value and DM digestibility of each diet are presented in Table 1. Gross energy of each diet and faecal energy of each sheep were measured by adiabatic bomb calorimetry (Parr 6400, USA) and metabolizable energy (ME) in each diet was calculated by the equation (National Research Council (NRC), 2007): ME = 0.82 × (gross energy – faecal energy). ME intake in each diet could meet the maintenance requirements of sheep for energy (0.45 MJ/kg BW0.75/day; NRC, 2007).
Proportion (%) and actual intake (g DM/day) of each component, nutritive value and dry matter digestibility in diets 1, 2, 3 and 4 that offered to sheep

MEI=metabolizable energy intake; CPI=crude protein intake; DMD=dry matter digestibility.
Metabolizable energy (ME)=0.82×(gross energy – faecal energy), gross energy and faecal energy were measured by adiabatic bomb calorimetry.
/ indicates no data.
During the 10-day adaptation period, we adjusted the amount of dried M. sativa pellets and fresh forages offered to the sheep according to the residues to ensure that the residual feed amount was less than 5% (Brosh et al., Reference Brosh, Henkin, Rothman, Aharoni, Orlov and Arieli2003). During the 7-day sampling period, a given amount (156 g DM/day) of M. sativa pellets were supplied to the sheep in each diet twice a day (at 0900 h and 1600 h), and after the offered pellets were consumed entirely, sheep were fed the mixed fresh forages. They had free access to water and mineral blocks during the experimental period. Fixed plastic feed containers were placed in front of the metabolism cages to supply the feed, and the containers were large enough to minimize the spoilage and spilling of the rations. Moreover, supervising technicians were present all day to collect the spilled feed and return it to the corresponding container. This process ensured minimal forage residue (Lin et al., Reference Lin, Zhu, Jiang, Luo, Wang, Zhang and Hong2012). Residues were therefore not evaluated for their botanical compositions or chemical compositions. Nylon mesh was placed under each metabolism cage to collect all the faeces of each sheep.
Sample collection and preparation
Forage samples of each species were separately collected daily when weighing the dietary components, following which they were immediately dried at 65°C for 48 h in a forced-air oven to measure their water content. Total faecal output was collected from the nylon mesh daily at 0800 h. Fresh faeces were weighed and a representative sample (20% of the total) was collected. Residues were also recorded daily at 1900 h when the sheep had finished eating. After collection, the faeces and residue samples were immediately dried at 65°C for 48 h in a forced-air oven to measure their water content and subsequently compute the actual intake and faecal output (in unit of DM). Furthermore, subsamples of plants and faeces were pooled per forage species and sheep, respectively, and then ground through a 1 mm mesh for alkane and LCOH analysis.
Extraction and analysis of alkanes and alcohols
Alkane and LCOH concentrations of the individual plant species and faecal samples were extracted and analysed according to the methods of Lin et al. (Reference Lin, Luo, Zhang and Shu2007 and Reference Lin, Luo, Wang, Zhang and Shu2009). Briefly, the method involved saponification (KOH), followed by solvent separation, purification through silica-gel columns and analysis by gas chromatography. The details are provided in Supplementary Material S1.
Calibration
Standard solutions, containing a combination of synthetic alkanes (C22-, C23-, C25-, C27-, C29-, C31-, C33- and C34-alkanes) dissolved in heptane, or alcohols (C20-, C22-, C24-, C26-, C27-, C28- and C30-alcohols) (Dr Ehrenstorfer GmbH, Augsburg, Germany) dissolved in heptane and ethanol at the volume ratio of 1 : 1, were made respectively at five concentrations (0.01, 0.02, 0.04, 0.08 and 0.16 mg/ml) according to Lin et al. (Reference Lin, Zhu, Jiang, Luo, Wang, Zhang and Hong2012). The response factors for the concentrations of individual alkanes and LCOHs were computed from the peak areas according to the previously built linear regression curve between peak areas and standard solutions with varying concentrations. Extraction rate was calculated from internal standards (C22- and C34-alkanes or C27-alcohol) and subsequently, the alkane and LCOH concentrations in the samples were calculated by referring to the extraction rates of C22- and C34-alkanes and C27-alcohol, respectively, as described in detail by Lin et al. (Reference Lin, Zhu, Jiang, Luo, Wang, Zhang and Hong2012).
Calculations
Considering that the average concentrations of C23-, C25- and C33-alkanes and C20-alcohols were less than 50 mg/kg DM across all diet components, these markers were thus discarded in the diet composition estimation. This processing procedure could increase the accuracy of the diet composition estimation (Brosh et al., Reference Brosh, Henkin, Rothman, Aharoni, Orlov and Arieli2003; Lin et al., Reference Lin, Luo, Zhang and Shu2007). Moreover, one marker type may be insufficient for estimating the diet composition of diets 3 and 4. Therefore, faecal concentrations of both alkanes (C27-, C29- and C31-alkanes) and LCOHs (C22-, C24-, C26-, C28- and C30-alcohols) were utilized to estimate the sheep dietary composition across the four diets.
The faecal recovery rate of each alkane or LCOH was the ratio of the amount of alkane or LCOH in the faeces to the actual amount consumed in the ration (Lin et al., Reference Lin, Zhu, Jiang, Luo, Wang, Zhang and Hong2012). Alkane and LCOH concentrations in the faeces were corrected using each of the three methods: (1) using recovery data for the individual sheep (individual sheep recovery), (2) using the mean recovery of sheep within a diet (treatment mean recovery) and (3) using the mean recovery across all dietary treatments (overall recovery). After correcting for faecal recovery, the diet composition was estimated using a non-negative least-square procedure (‘Eatwhat’ software, Dove and Moore, Reference Dove and Moore1995).
Total intake was estimated using the ‘supplement’ method (Elwert and Dove, Reference Elwert and Dove2005). Specifically, the estimated proportion of supplement (P s) in the diet and the known intake of supplement (I s) offered to sheep were used for estimating total intake. The equation was:
 $${\rm{Total \ intake}} = {{{I_{\rm s}}} \over {{P_{\rm s}}}}$$
Estimated individual intakes of forages were calculated using the estimated proportion of a given forage (P f) in the diet and the estimated total intake. The equation was:
 $${\rm{Intake \ of \ forage \ f}}=\left( {{{{I_{\rm s}}} \over {{P_{\rm s}}}}} \right) \times {P_{\rm f}}$$
The accuracy of the diet composition estimates across all diet components was evaluated using the Kulczyński similarity index (KSI, in %), and this index calculated the intersection between the observed and estimated diet composition according to different faecal recovery methods (Lin et al., Reference Lin, Zhu, Jiang, Luo, Wang, Zhang and Hong2012):
 $${\rm {KSI}} = 100 \times {{\sum {2{c_i}} } \over {\sum {({a_i} + {b_i})} }}$$
where a i and b i are the observed and estimated diet composition of component i, respectively; c i is the lesser proportion of component i in the observed and estimated diet composition (i.e. if a i > b i, then c i=b i; if a i < b i, then c i=a i); and (a i+b i) is the sum of proportions of each forage component in the observed and estimated diet composition.
The accuracy of M. sativa proportion and total intake were evaluated using the mean prediction error (MPE; Elwert and Dove, Reference Elwert and Dove2005), which was calculated by summing the square of the differences between the estimated and observed values, dividing by the replicates in the treatment and taking the square root of the quotient:
 $${\rm{MPE}}=\sqrt {(1/n \times \sum ({\rm{estimated}} − {\rm{observe}}{{\rm{d)}}^2})}$$
The accuracy of individual species intake was evaluated by the mean relative prediction error (MRPE, in %; Elwert and Dove, Reference Elwert and Dove2005):
 $${\rm {MRPE}} = \sqrt {\bigg(1/n \times \sum {{\left( {{{{\rm {estimated}} - {\rm {observed}}} \over {{\rm {observed}}}}} \right)}^2}} \bigg)$$
Statistical analysis
Statistical analysis was conducted using SAS (V. 8.1) (SAS Institute Inc., Cary, NC, USA). To assess differences among forage species according to their alkane and LCOH concentration profiles, log-transformed [log (1+x)] concentrations of individual alkanes and LCOHs of each species were subjected to principal component analysis (PCA). Most of the between-species variance in alkane and LCOH profiles was explained by the first two principal components. The correlation matrix was used to calculate PCA scores. In the graph, principal component score 1 (PC1) was plotted against principal component score 2 (PC2), and different plant species are represented by the points on the graph. One-way ANOVA followed by Duncan’s method was used to assess the effect of diet composition on the faecal recovery rates of alkanes and LCOH. Paired t-tests were used to compare the differences between the observed and estimated values of the proportions of M. sativa and total intake. Moreover, the influence of diet and method for faecal recovery, and their interactions, on KSI values were assessed by two-way ANOVA.
Results
Marker profiles of the plant species
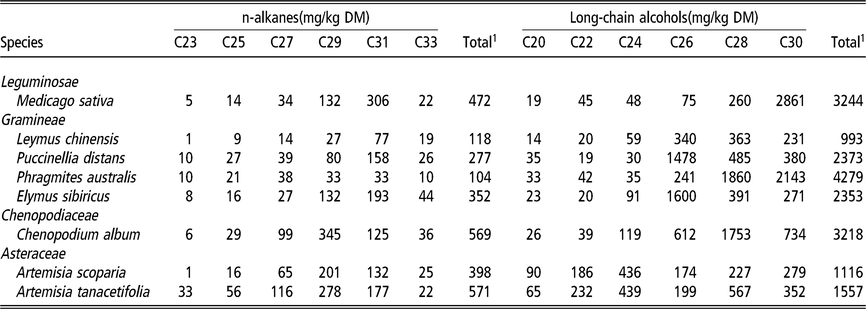
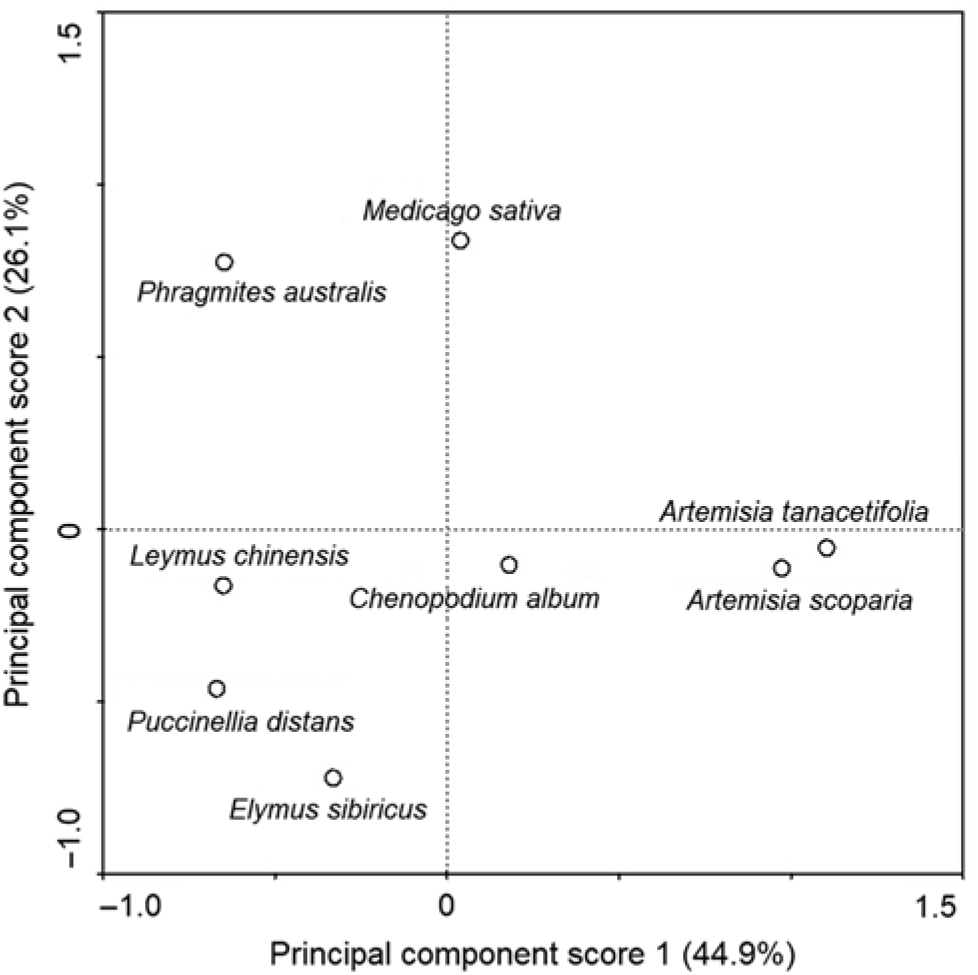
Medicago sativa contained the highest concentration of C31-alkanes and C30-alcohols, while the concentrations of C26- and C28-alcohols were generally lower than in all the other forages (Table 2). PCA revealed that the first two principal components accounted for the largest differences between forages, explaining 71% (PC1 and PC2 explained 44.9% and 26.1%, respectively) of the total variance among forage species. Furthermore, M. sativa was separated from most of the forages in the diet in both PC1 and PC2 (Figure 1).
Concentration (mg/kg DM) of individual n-alkanes and long-chain alcohols within each forage species consumed by sheep

1 Total concentration of alkanes was calculated from C27-alkane, C29-alkane and C31-alkane and total concentration of long-chain alcohols was calculated from C22-alcohol, C24-alcohol, C26-alcohol, C28-alcohol and C30-alcohol. These above-mentioned markers were used in the estimation of diet composition.
Biplots of the first and second principal component scores from the principal component analysis using the concentrations of C27, C29 and C31 alkane markers and C22, C24, C26, C28 and C30 long-chain alcohol markers in eight forage species in the sheep diets.

Recovery of alkanes and long-chain alcohols in sheep faeces
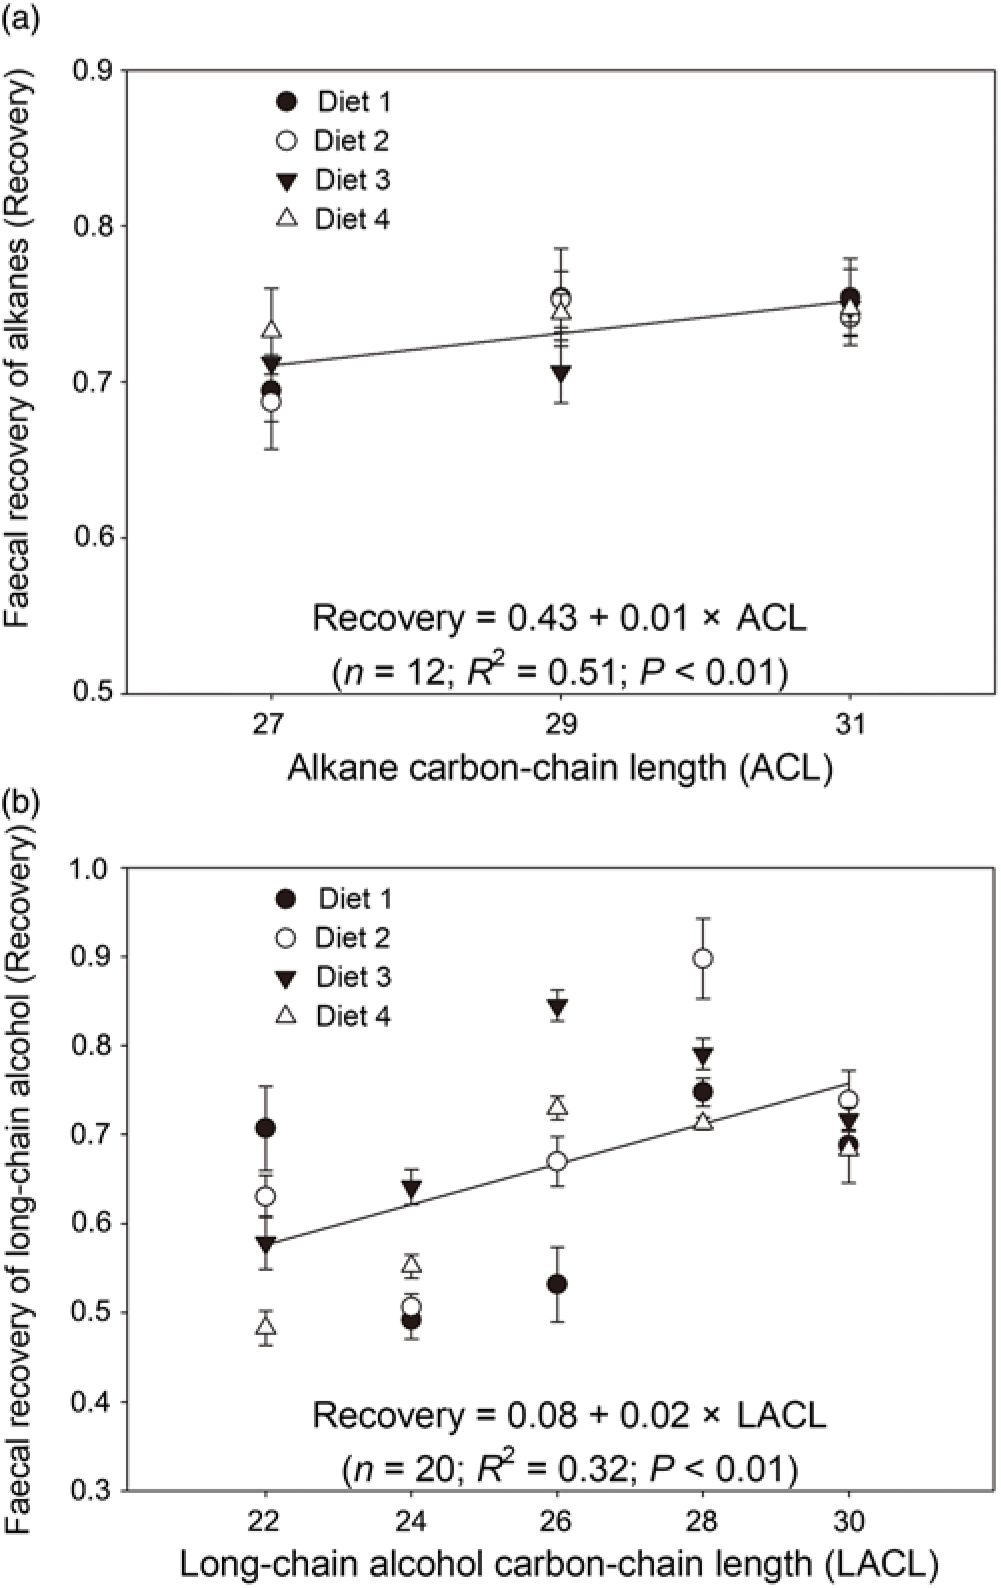
Alkane recovery rates, ranging from 0.71 (C27-alkane) to 0.75 (C31-alkane, Figure 2a), were not significantly influenced by diet composition and increased with increasing alkane carbon-chain length. However, with the exception of C30-alcohol, the faecal recovery values of all other LCOHs were significantly (P < 0.05) influenced by diet composition. Faecal recovery values of the LCOHs, ranging from 0.55 to 0.79, exhibited an increasing tendency with increasing carbon-chain length (Figure 2b).
Relationships between (a) alkane carbon-chain length (ACL) or (b) long-chain alcohol carbon-chain length (LACL) and their faecal recovery (Recovery, mean ± standard error) of sheep fed diets 1, 2, 3 and 4.

Estimation of diet composition, total feed intake and individual component intake
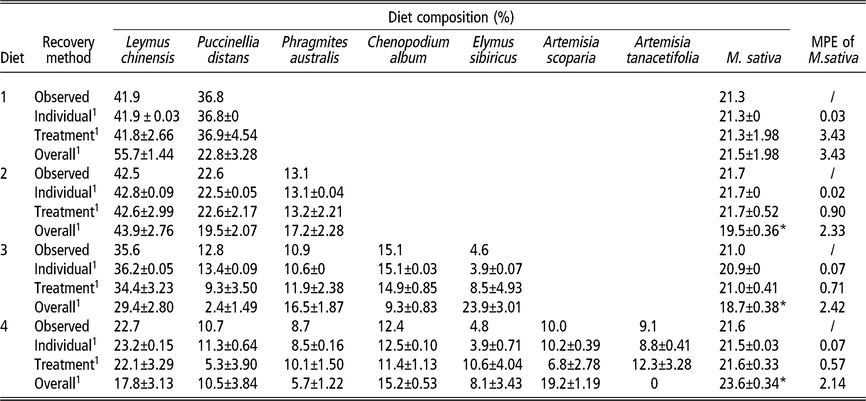
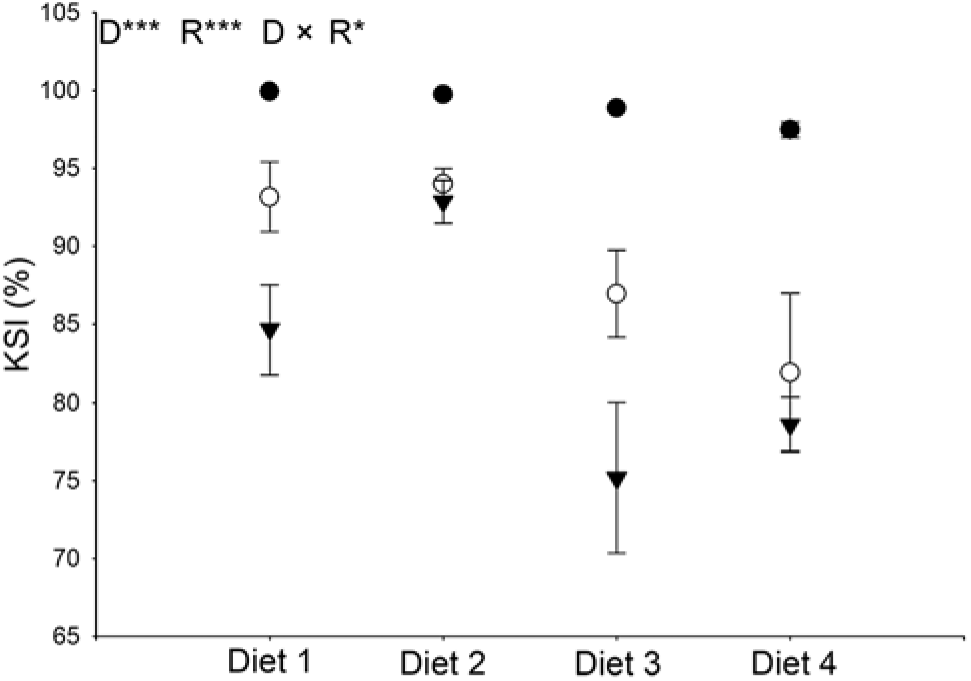
When the diet composition was estimated using individual sheep recovery, the differences between the observed and estimated proportions were negligible (0% to 0.8%, Table 3). Using the treatment mean recovery method, the differences between the observed and estimated diet composition were larger (≤5.8%, Table 3) than that using individual sheep recovery. When the diet composition estimates were based on overall recovery, the differences between the observed and estimated proportions increased further (≤19.2%, Table 3). The results of the two-way ANOVA showed that diet, faecal recovery method and their interactions significantly (P < 0.05) affected KSI values (Figure 3). The overall KSI values of diet 1 (92.6%) and diet 2 (95.5%) were significantly (P < 0.001) larger than that of diet 3 (87.0%) and diet 4 (86.0%). Kulczyński similarity index values decreased significantly (P < 0.001) from individual sheep recovery (99.0%), to treatment mean recovery (89.0%) and to overall recovery (82.8%).
Observed and estimated proportions of dietary component (mean ± standard error) in diets 1, 2, 3 and 4 using faecal recovery methods based on individual sheep recovery, treatment mean recovery and overall recovery as well as the mean prediction error (MPE) of Medicago sativa

1 Diet compositions were estimated using individual sheep recovery, treatment mean recovery and overall recovery methods.
* The estimated proportion of M. sativa differed significantly (P<0.05) from the observed value;
/ indicates no data
Kulczyński similarity index (KSI, %, mean ± standard error) between the observed and estimated diet composition of diets 1, 2, 3 and 4 using faecal recovery based on the recovery of individual sheep (closed circles), treatment mean (open circles) and overall diets (closed triangle). D: diet; R: faecal recovery correction; D × R: the interaction of diet and faecal recovery correction. Asterisks * and *** indicate significant differences at the levels of P < 0.05 and 0.001, respectively.

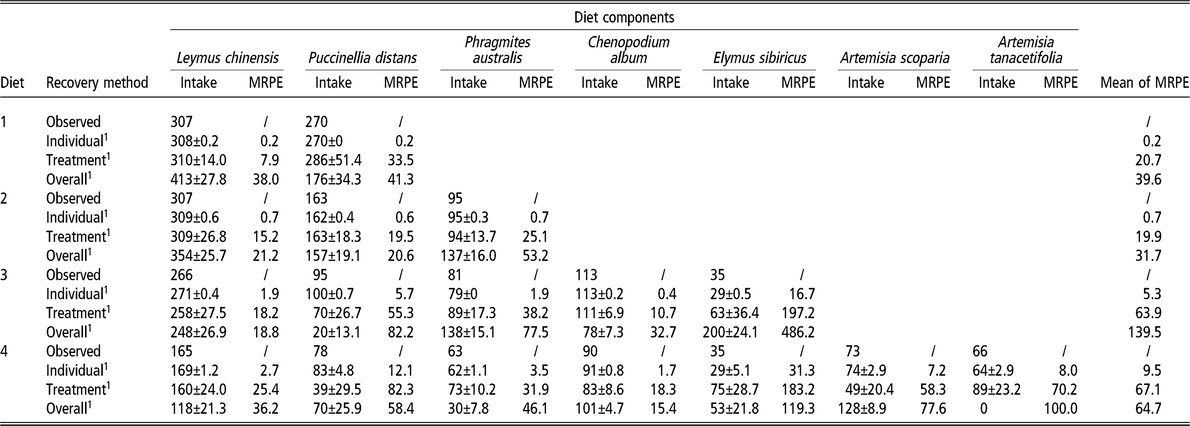
When the diet composition was estimated using individual sheep or treatment mean recovery, the differences between the estimated and observed proportions of M. sativa and total intake were not significant (P > 0.05; Tables 3 and 4). Moreover, the greatest differences between estimated and observed total intake based on individual sheep recovery and treatment mean recovery across all diets were 2.6 g and 19.2 g, respectively, representing only 0.4% and 2.6% of the total intake, respectively (Table 4). However, when overall recovery was used, three of four estimated proportions of M. sativa and total intake differed significantly (P < 0.05) from the observed values. Except for diet 1, the MPE values of total intake estimated by overall recovery were greater than the corresponding values obtained using individual sheep or treatment mean recovery.
Observed and estimated total intake (g DM/day; mean±standard error) and mean prediction error (MPE) in diets 1, 2, 3 and 4 using faecal recovery methods based on individual sheep recovery, treatment mean recovery and overall recovery

* The estimated total intake that differed significantly (P<0.05) from the observed value.
/ indicates no data.
For individual component intake within a diet, MRPE values increased generally from individual sheep recovery to treatment mean recovery, and to overall recovery (Table 5). According to the treatment mean or overall recovery estimates, the mean MRPE values of diet 3 or 4 were two- to four-fold higher than the corresponding values of diet 1 or 2. The MRPE values for the estimated intake of E. sibiricus, P. distans, A. scoparia and A. tanacetifolia were always larger than the corresponding values of the other dietary components.
Observed and estimated individual component intake (g DM/day; mean±standard error), mean relative prediction error (MRPE, %) and the mean of MRPE (%, averaged across dietary components within a diet except for Medicago sativa) in diets 1, 2, 3 and 4 using faecal recovery methods based on individual sheep recovery, treatment mean recovery and overall recovery

1 Diet compositions were estimated using individual sheep recovery, treatment mean recovery and overall recovery methods.
/ indicates no data.
Discussion
In the present study, M. sativa showed distinct patterns from the other forage species across all diets (Figure 1). Our study demonstrated that accurate estimations of M. sativa proportions as well as total feed intake based on individual sheep or treatment mean recovery could be obtained across all diets. However, considering that individual sheep recovery is challenging under field conditions, treatment mean recovery is thus more preferable (Charmley and Dove, Reference Charmley and Dove2007; Elwert et al., Reference Elwert, Dove and Rodehutscord2008). Overall, our study showed that M. sativa may be used as a natural supplement for accurately estimating total feed intake under grazing conditions.
Alkanes and long-chain alcohols concentrations of Medicago sativa
Compared to the other dietary components, M. sativa contained the highest concentration of C31-alkanes and C30-alcohols, but generally lower concentrations of C26- and C28-alcohols (Table 2), which was also observed by Lin et al. (Reference Lin, Zhu, Jiang, Luo, Wang, Zhang and Hong2012) and may explain the separation of M. sativa from most of the dietary components in the PCA (Figure 1). Furthermore, the estimation of diet composition using the alkane technique relies on the hypothesis that the profiles of the markers differ markedly among forage species (Dove and Mayes, Reference Dove and Mayes1991). Therefore, M. sativa has the potential to be successfully distinguished from other species in the diet.
Recovery of alkanes and long-chain alcohols in the faeces
Mean faecal recovery rates of alkanes (0.71 to 0.75) and LCOHs (0.55 to 0.79) were within the ranges (0.58 to 0.90 and 0.37 to 0.90 for alkanes and LCOHs, respectively) of those observed in the previous studies (Dove and Mayes, Reference Dove and Mayes2005; Charmley and Dove, Reference Charmley and Dove2007; Lin et al., Reference Lin, Zhu, Jiang, Luo, Wang, Zhang and Hong2012). Our results also confirmed the previous findings that the faecal recovery rates of alkanes or LCOHs increase with increasing carbon-chain lengths in sheep (Lin et al., Reference Lin, Luo, Zhang and Shu2007; Dove and Charmley, Reference Dove and Charmley2008; Ferreira et al., Reference Ferreira, López López, Celaya, Osoro and Rodrigues2018).
In our study, faecal alkane recovery rates were not affected by diet composition, as reported previously (Dove and Mayes, Reference Dove and Mayes1991; Elwert et al., Reference Elwert, Kluth and Rodehutscord2004; Dove and Charmley, Reference Dove and Charmley2008). However, except for C30-alcohols, the effect of diet composition on the faecal recovery rates of other LCOHs was significant (P < 0.05), which contradicted earlier studies (Dove and Charmley, Reference Dove and Charmley2008; Lin et al., Reference Lin, Zhu, Jiang, Luo, Wang, Zhang and Hong2012). A possible explanation is that there were substantial differences between these studies in terms of diet composition, such as forage species, number of diet components and the proportion of each component, as earlier studies reported that faecal marker recovery was significantly influenced by forage species (Lin et al., Reference Lin, Luo, Zhang and Shu2007; Elwert et al., Reference Elwert, Dove and Rodehutscord2008) and diet digestibility (Ferreira et al., Reference Ferreira, Celaya, Santos, Mayes, Rodrigues and Osoro2015 and Reference Ferreira, López López, Celaya, Osoro and Rodrigues2018). In our study, the digestibility among the four diets did not differ significantly (P = 0.24, Table 1), and thus, the forage species consumed by the animals might be the primary factor accounting for the variations in faecal marker recoveries for LCOHs (Lin et al., Reference Lin, Zhu, Jiang, Luo, Wang, Zhang and Hong2012). Introducing new forages to the existing diet could obviously modify the proportion of markers contributed by each forage (Elwert et al., Reference Elwert, Kluth and Rodehutscord2004). Our results highlighted that diet composition exerted a significant impact on faecal recovery for LCOHs.
Estimation of diet composition, total feed intake and individual component intake
The variance in faecal marker recovery increased progressively from individual sheep to treatment mean, and to overall recovery (Charmley and Dove, Reference Charmley and Dove2007), and a more accurate estimation of dietary composition could be obtained using faecal recovery values with less variance (Ferreira et al., Reference Ferreira, López López, Celaya, Osoro and Rodrigues2018). Therefore, the accuracy of the estimated diet composition and dietary proportions of M. sativa decreased significantly from individual sheep recovery to treatment mean recovery, and to overall recovery. The accurate estimation of M. sativa proportion and feed intake relies on accurate diet composition estimates, which did require the correction of faecal marker concentrations for their incomplete faecal recovery (Dove and Charmley, Reference Dove and Charmley2008). Our results showed that total feed intake could be accurately estimated by using individual sheep recovery or the treatment mean recovery method (Table 4). However, as dietary composition significantly affected the faecal recovery values for LCOHs, the overall recovery of LCOHs containing the variances in recovery attributable to diet deviated largely from the treatment mean recovery. Therefore, overall recovery only accurately estimated one of the four diets. Estimations based on individual sheep recovery were most accurate; however, this is difficult to determine under field conditions (Charmley and Dove, Reference Charmley and Dove2007; Elwert et al., Reference Elwert, Dove and Rodehutscord2008). Although treatment mean recovery led to a small reduction in accuracy in comparison to individual sheep recovery, this had a negligible effect, as the largest difference between estimated and observed total intake across all diets was only 19.2 g, representing only 2.6% of total intake. Treatment mean recovery is thus recommended.
In this study, the accuracy of both diet composition and individual component intake estimates in diets 3 and 4 declined markedly in comparison to diets 1 and 2, which was possibly explained by the increasing similarity in wax marker patterns among forage species with more forage species in the diet (Dove and Mayes, Reference Dove and Mayes2005). In diet 3, a strong correlation (r = 0.99) was found between the marker patterns of P. distans and E. sibiricus, which might explain why the KSI values of diet 3 were lower in comparison to diet 2. This trend is similar to that reported by Dove and Charmley (Reference Dove and Charmley2008) in a study that differentiated Phalaris from ryegrass with similar LCOH patterns and thus reduced KSI values. Additionally, A. scoparia and A. tanacetifolia shared similar marker profiles as they belong to the same genus (Lin et al., Reference Lin, Luo, Zhang and Shu2007), which further decreased the KSI values of diet 4. In contrast to the above-mentioned species, M. sativa could be clearly distinguished from other species in the diet, and subsequently, its dietary proportion could be accurately estimated using the treatment mean recovery method despite seven other forages being present in the diet. This indicates that M. sativa can be recommended as a natural supplement for accurately estimating total feed intake, exhibiting potential use in naturally grazed grasslands. Additionally, the estimated intakes of E. sibiricus and P. distans deviated largely from the observed values, but the estimated total intakes of E. sibiricus and P. distans were similar to the corresponding observed values. A similar phenomenon was also observed for A. scoparia and A. tanacetifolia in diet 4 (Table 4). From this aspect, when species with similar marker profiles are present in one diet, the total intake of these species rather than individual species intake could be accurately estimated (Lin et al., Reference Lin, Luo, Zhang and Shu2007).
This study describes a first step towards the establishment of a field-based method for estimating feed intake. Medicago sativa may be used for estimating grazing animal intake using the following guidelines: (a) M. sativa is fed individually and quantitatively, (b) the faecal marker concentrations of grazing animals should be corrected according to the faecal marker recoveries of indoor animals given similar diets and (c) rectal grab samples should be obtained from individual animals twice daily (Ma et al., Reference Ma, Yuan, Liang and Rong2014) as the faecal marker concentration in the grab sample is representative of the total faecal output (Morais et al., Reference Morais, Berchielli, de Vega, Queiroz, Keli, Reis, Bertipaglia and Souza2011). Moreover, our study suggested that not only M. sativa but also other forage species could be used for accurately estimating herbivore intake provided that the supplemented forage is characterized by distinct patterns of plant wax markers.
As similar dietary proportions of M. sativa were utilized in this study, it is unknown whether faecal recovery values would vary in diets containing different proportions of M. sativa. Meanwhile, the ultimate aim of this study is to apply this method to the field. Therefore, further studies, such as those utilizing various dietary proportions of natural supplements and comparing the method using even-chain synthetic alkanes under field conditions, are required to validate the reliability of this method.
In summary, our results revealed that M. sativa, a natural roughage instead of a labelled concentrate, demonstrates potential use as a dietary supplement for accurately estimating the total feed intake of indoor sheep using the plant wax marker technique. The treatment mean recovery method could be used as a reliable tool for estimating sheep feed intake, and this technique has potential to be applied in steppe grassland of northern China where the marker patterns of M. sativa and commonly occurring plant species are markedly different.
Acknowledgements
We thank Gail W.T. Wilson and Adam B. Cobb for their linguistic assistance during the preparation of this manuscript. This study was supported by the earmarked fund for Modern Agro-industry Technology Research System (No. CARS-34) and research and demonstration on key technologies of efficient utilization of modern artificial grassland (2017BY082).
Declaration of interest
None.
Ethics statement
This experiment obtained permission from the China Agricultural University Laboratory Animal Care Advisory Committee.
Software and data repository resources
Data were not deposited in an official repository.
Supplementary material
To view supplementary material for this article, please visit https://doi.org/10.1017/S1751731119001381.