



No CrossRef data available.
Article contents
Long-term epidemiology, effect on body condition and interspecific interactions of concomitant infection by nasopharyngeal bot fly larvae (Cephenemyia auribarbis and Pharyngomyia picta, Oestridae) in a population of Iberian red deer (Cervus elaphus hispanicus)
Published online by Cambridge University Press: 23 August 2004
Abstract
We studied the pattern of infection and the inter-annual variation and individual factors affecting the infection of 2 species of nasopharyngeal bot flies, Cephenemyia auribarbis and Pharyngomyia picta (Diptera: Oestridae), in a population of Iberian red deer (Cervus elaphus hispanicus) from south central Spain (10 annual periods between 1990 and 2003). Mean prevalence±S.E.95%CI of infection was 35·19±4·24% (n=486). The frequency distribution of the parasites was markedly aggregated (K: 0·213, mean abundance±S.D.: 5·49±12·12). Parasite load of Oestridae peaked at calf and subadult age groups and declined thereafter, which suggests that acquired immunity may be acting. In common with other host–parasite relationships, male hosts were found to have higher prevalence and abundance levels than females. The prevalence of P. picta was positively affected by the presence of C. auribarbis whereas the intensity of infection of P. picta was negatively affected by the presence of C. auribarbis. Intensity of P. picta in concomitant infections with C. auribarbis was lower than in pure P. picta infections, whilst the intensity of C. auribarbis infections did not change. This provides good evidence of interspecific competence, which could be dealt with by parasites by means of asynchronous life-cycles and different maturation periods. Weather also affects the dynamics and transmission rates of these parasites. Previous annual rainfalls positively affected the level of infection with oestrids. Yearly autumn rainfalls affected positively P. picta, possibly due to an effect on the pupal stage survival. Infection of Oestridae affected body condition in calves and subadults, suggesting that oestrids could have sublethal effects on Iberian red deer. Future research is needed to investigate the effect of parasites on the dynamics of the Iberian red deer.
Keywords
Information
- Type
- Research Article
- Information
- Copyright
- © 2004 Cambridge University Press
INTRODUCTION
Anderson & May (1978) theoretically demonstrated that parasites could regulate host populations if they reduce host survival and/or fecundity in a density-dependent manner. In spite of evidence from laboratory studies (Scott, 1987), there are few data available on the role of parasites in the population dynamics of wild vertebrate populations (Hudson & Dobson, 1995). The first experimental study that definitively demonstrated that parasites can regulate wildlife was recently published by Hudson, Dobson & Newborn (1998) with Trichostrongylus tenuis-red grouse (Lagopus lagopus scotticus) as the parasite–host system in northern England. Further evidence in two ungulate herbivore species in the natural environment have been reported by Gulland et al. (1993) and Albon et al. (2002). Parasites lead to mortality and affect host dynamics in a density-dependent manner in the Soay sheep population from St Kilda (Gulland, 1992), even with mass mortality events. Macroparasites frequently also have an important sublethal impact on their hosts (Gulland, 1995). These kinds of findings often go undetected in empirical correlational studies of natural infections in wild animal populations and, consequently, also the potential effects on the dynamics of both the parasite and the host populations (Stien et al. 2002).
In general, increasing parasite aggregation enhances the stabilizing effects of parasite-induced host mortality (Anderson & May, 1978). Different sources are involved in generating heterogeneity in the distribution of parasites across host populations: climate changes, host behavioural or physiological (age, sex) differences, variation in the number of infectious stages encountered per infection event or in genetic susceptibility to disease between hosts (Shaw & Dobson, 1995).
Particularly, there is a lack of long-term studies which could highlight the role of inter-annual variations (climatic changes) in parasite infections across wild large mammal populations. The evaluation of parasite effects on hosts, especially those considered as ‘benign’, could be dealed across the study of individual body condition of the animals since a negative correlation is generally expected between body condition and parasite load (Festa-Bianchet, 1989).
We describe a parasite–host system based on oestrid larvae–Iberian red deer observations over a long period of time. Myiasis is caused by the invasion of Diptera larvae in tissues or tissue spaces in animals (Zumpt, 1965). The larvae of oestrids (Diptera: Oestridae) are widespread parasitic arthropods causing myiasis in live domestic and wild ungulates. Pharyngeal bot fly larvae are commonly found in Cervidae in the Holarctic region (Zumpt, 1965). Cephenemyia auribarbis (Meigen, 1824) and Pharyngomyia picta (Meigen, 1824) cause nasopharyngeal myiasis in the red deer (Cervus elaphus), the main host, although both species also infect the fallow deer (Dama dama) (Ruiz, Soriguer & Perez, 1993) and P. picta is present in the roe deer (Capreolus capreolous) (Sugár, 1974). Concomitant infection of both species has been commonly reported in Europe (Sugár, 1974, 1976) and, to date, they both are the only species reported in Iberian red deer (Cervus elaphus hispanicus) (Gil Collado, Valls & Fierro, 1985). After the first instar larvae are deposited, nasopharyngeal bot flies develop in the nasal and pharyngeal cavities, larynx, trachea and bronchi. Finally they complete their development mainly in the retropharyngeal recesses. Once the larvae have matured, they leave the host, and search for an adequate environment to pupate. Pathological lesions of nasopharyngeal bot flies are the mechanical disruption of tissues, hypertrophy and enlargement of the retropharyngeal recesses. Subsequent clinical manifestations are rarely reported and, only under extremely stressful conditions, may bot fly larvae cause harm to their host (Cogley, 1987; Foreyt, Leathers & Hattan, 1994).
Work on the epidemiology of the nasopharyngeal myiasis in red deer has mainly been carried out during hunting seasons (Ruiz Martinez & Palomares, 1993; Ruiz et al. 1993; Bueno-de la Fuente et al. 1998) and only one refered to an entire annual period (De la Fuente et al. 2000).
Our goal was to investigate the host–parasite interactions between the oestrids C. auribarbis and P. picta larvae, entering their host actively and causing nasopharyngeal myiasis in the Iberian red deer. This study system represents an excellent opportunity for three reasons: (i) we have long-term data on the hosts, parasites and environmental conditions in this system, (ii) we have detailed data from marked animals which allows analysis at the individual host level and (iii) the data allow analysis of the interactions between coexisting species. In this study we attempted to elucidate the role of individual and climatological factors generating heterogeneity in infection across hosts. Furthermore, we investigated the relationship between climate, parasite load and body condition.
MATERIALS AND METHODS
Study area
The study was conducted in a 900 ha hunting estate in the province of Ciudad Real, Southcentral Spain (38 °55′N; 0 °36′E; 600–850 m above sea level). The major species present are the Iberian red deer (Cervus elaphus hispanicus) and the European wild boar (Sus scrofa), but low numbers of both the introduced Barbary sheep (Ammotragus lervia) and mouflon (Ovis ammon) also inhabit the study area. The range is fenced in order to enclose the wild ruminants. The habitat is Mediterranean and characterized by evergreen oak (Quercus ilex), scrubland with scattered pastures and small crops. Seasonal streams cross the estate, but water is retained and available all year around in several water holes. The climate is Mediterranean. The wet season typically starts in September. Most yearly rains are concentrated in this season, peaking in Autumn (from October to December) with considerable variations until May, with mild temperatures (the annual minimum mean temperature during the study period was in 1991: 7·3 °C). Then the dry season starts and lasts until September. It is characterized by high temperatures (the annual maximum mean temperature during the study period was in 1995: 21·6 °C).
Host population
The Iberian red deer is one of the most important game species in Spain and deer hunting has a great economic relevance in southern Spain (Fierro et al. 2002). In this estate, a hunting regulated population of red deer has been monitored since 1989. The population shows a persistent stability and no die-off has been reported to date. Deer counts at the mating season in the estate between 1990 and 2002 ranged from 248 to 466 (mean 306±27), and the annual number of deer harvested ranged from 13 to 149 (mean 80±13). Sex ratio was equilibrated, with a mean female to male ratio of 1·08.
Sampling
From September 1990 to February 2003, except for the period from 1997 to 1999, we obtained data from 486 hunter-harvested red deer spread across the year. Nevertheless the hunting season was from September to March, thus, the majority of animals were sampled through this period of the year. Hosts were distributed across seasons and months as Table 1 indicates. A complete necropsy was performed immediately after shooting in the estate facilities. To examine the presence of pharyngeal bot fly larvae, the head, trachea and lungs were dissected as described by Gil Collado et al. (1985). Larvae were collected and counted. The specimens from 113 of the 173 positive animals across the study period were preserved in 70% ethanol and could be morphologically examined. The different instars of nasopharyngeal bot flies were identified according to previous descriptions (Cameron, 1932; Gil Collado, 1955; Zumpt, 1965) and are stored and available in the parasitology laboratory of the Instituto de Investigación de Recursos Cinegéticos (IREC), Ciudad Real, Spain. We accurately assessed the host age-structure. Incisor-1 was collected and age was determined from tooth sections at Matson's laboratory (P.O. Box 308, 8140 Flagler Road, Milltown, MT 59851, USA) as described by Klevezal' & Kleinenberg (1967). From the age of 5 years the deer are adults. Thus, for statistical purposes, animals where grouped in age classes as follows: (1) calves (<1 year), n=91; (2) subadults, including yearlings and subadults up to 4 years, n=261; (3) adults ([ges ]5 years), n=134. These classes are of biological meaning since the subadult class includes growing deers which, in the case of males, are usually excluded from mating. Since considerable variations in the climate of different years could affect the annual infection rates, we grouped the animals in yearly natural periods (from 1 June to 31 May of the next year). This period has biological meaning since it starts with the dry season, it ends when the wet season does and, moreover it overlaps with the phenology of the Iberian red deer and pharyngeal bot flies. We were able to study 10 periods between 1990 and 2003 as follows: (1) 1990–91, (2) 1991–92, (3) 1992–93, (4) 1993–94, (5) 1994–95, (6) 1995–96, (7) 1996–97, (8) 2000–01, (9) 2001–02 and (10) 2002–03 (the latter until March 2003). Climatological data were obtained from the official station of the National Institute of Meteorology no 317-E, which is located just in the estate. Climatological data were read regularly each day. Annual rainfall data (mm, from May to June next year) along the study periods is shown in Table 1. A priori, this groupment made biological sense since previous rainfall could affect the development of pupae to adult and subsequent infection levels in the host population (e.g. McMahon & Bunch, 1989). We tested if overall yearly rainfall or intra-annual periods that could affect free stages of bot flies (such as that of autumn from September to December according to our results of infection across months) affected posterior parasite loads.
Table 1. Distribution of hosts across seasons and months along the study period (Each cell represents the positive animals for the parasite in relation to the sample size of shot animals.)

Statistical analyses
Prevalence is defined as the number of individuals infected with bot fly larvae related to all deer examined. Mean abundance describes the mean number of parasites related to all deer examined. Mean intensity of infection describes the mean abundance of infection for infected hosts only (Margolis et al. 1982) refering to total bot fly larvae or to a particular species. Confidence intervals for standard errors of prevalences were estimated with the expression S.E.95%CI=1·96[p(1−p)/n]1/2 (Martin, Meek & Willeberg, 1987). The degree of parasite aggregation was measured by the corrected k value of the negative binomial distribution and by the variance to mean ratio (Shaw, Grenfell & Dobson, 1998).
For both analysis of annual variations and the effect of parasites on body condition, since the sampling was concentrated in hunting seasons and most of the annual cases of infection occur during this time, we selected the sampled animals from December to March in each year. We will refer to this period in the paper as ‘hunting season’. We used years where we had most data spread across the mentioned period, thus rejecting the 1991 season (Table 1). For seasonal variations within years, we divided animals into 2 groups belonging to summer (from June to October) or winter (from November to May).
To test for significant differences in parasite prevalence between age-classes, sex and annual periods, and interactions, log-linear analysis of contingency tables was employed reporting the partial χ2 values from a saturated model. We treated age as a categorical variable with 3 classes as described above. In this model, to study the effect of the rainfall of the previous year (for example, for animals hunted in 1990–1991, the corresponding rainfall of 1989–1990 was taken), we grouped the samples in a categorical variable: (1) dry years with rainfall <300 mm: 1990–91, 1993–94 and 1994–95, n=91, (2) years with rainfall between 300 and 500 mm: 1991–92, 1992–93, 1999–2000, 2001–02, n=260 and (3) years with rainfall over 500 mm: 1989–90, 1995–96, 2000–01, n=135.
Generalized linear models (GLMs) are generalizations of classical linear models which allow the underlying statistical distribution of the data and offer a powerful alternative to logarithmic transformation and conventional parametric methods (Crawley, 1993), especially when the distribution is aggregated or the mean parasite load is low (Wilson & Grenfell, 1997). We used GLM analysis to search for sources of variation in parasite rates and body condition. The resulting saturated models were reduced to their simplest form by eliminating in a backward stepwise manner any independent variables or interactions that failed to explain significant variation in the dependent. We conducted a GLM to test the relationship of intensity and abundance of infection with the age classes (as described above) and sex as factors and interactions. We also included ‘year’ in the model as a factor. We considered a negative binomial error distribution and a log link function (Wilson, Grenfell & Shaw, 1996). We controlled for overdispersion when neccesary.
For intra-annual variations in parasite loads, we conducted a mixel model with a a Poisson error distribution and a logarithmic link function and year as a random effect to allow sampling size problems in some years to be taken into account. The model included the cycle of infection (summer or winter) and also the sex as factors. We did the analysis for each age class separately. The prevalence of both intra-annual cycles was compared by means of a logistic regression.
To test the effect of concomitant infection of both species, we explained the prevalence of P. picta depending on the presence of C. auribarbis by means of a logistic regression. We considered the period where both species overlapped (from December to February). The analysis of the effect of C. auribarbis (explanatory variable) on the intensity of infection with P. picta (dependent variable) was carried out using a GLM and also was refered to the same period of overlapping. We considered a binomial error distribution and a log link function.
Climatological data were compared with annual prevalence and intensity of both species infection using Spearman rank-correlation coefficients (r). We employed infection data along the concomitant infection period (from December to February).
We tested the effect of the abundance and intensity of parasites (explanatory variable) on body condition by conducting a GLM that fitted body (carcass) mass (dependent variable) for skeletal size (jaw length). The model also included sex and season as factors. We analysed each age class separately. The analysis was based on animals from December to March over the 9 years. Since the response variable fitted to the normal distribution in calves (n=40, mean carcass weight=34·07±8·52 kg., k=27·56; Lilliefors test, D=0·086, P>0·2), we considered a normal error distribution and an identity link for this age class. Body mass of subadult (n=87, mean carcass weight=58·71±13·38 kg., k=31·74; Lilliefors test, D=0·151, P<0·01) and adult age (n=65, mean carcass weight=65·06±0·64 kg., k=23·86; Lilliefors test, D=0·127, P<0·01) classes data fitted to Poisson distribution. Thus, we conducted GLMs with Poisson errors and logarithmic link functions separately in both groups of age. The level of significance was established at the 5% level. All P-values refer to two tailed tests. We employed SPSS 10.0.6 program (SPSS Inc., 1999) statistical software packages.
RESULTS
Identification of the parasite
The morphological characteristics of the 2 species of Oestridae from the analysed subset of samples (n=113) were consistent with those of Cephememyia auribarbis and Pharyngomyia picta. We identified the 3 instars of C. auribarbis and P. picta.
Prevalence and intensity
Mean prevalence±S.E.95%CI of infection by Oestridae was 35·19±4·24% (n=486). The distribution of Oestridae was overdispersed. The frequency distribution of the parasite in the hosts showed a markedly aggregated pattern with a corrected k of the binomial distribution=0·213, mean abundance±S.D.: 5·49±12·12 and variance to mean ratio=26·74. About 10% of individuals harboured 70% of the bot flies. For C. auribarbis the mean intensity±S.D. was 10·73±8·86 and for P. picta the mean intensity±S.D. was 12·98±16·53 (n=113).
The effect of sex, age and year
The age profile of overall Oestridae infection during the hunting season is shown in Fig. 1. A general decreasing profile was found. Considering the age classes during the hunting season, the lowest prevalence of Oestridae infection was found in adult deer: 56·86±13·72%, 65·09±9·21% and 45·45±11·17% for calves (n=51), subadults (n=106) and adults (n=77) respectively (Fig. 2). Regarding the intensity of infection, a peak was detected in calves, with adult individuals similarly showing the lowest values: 25·82±20·70, 17·60±15·19 and 13·60±14·55 for calves (n=29), subadults (n=69) and adults (n=33) respectively. The frequency distribution of the parasite in the hosts across the age classes during the hunting season showed a markedly aggregated pattern with corrected k parameters of the binomial distribution: 0·58, 0·98 and 0·52 for calves, subadults and adults respectively. Oestridae prevalence and intensity differed significantly between age classes (prevalence: log-linear partial χ2=17·86, P<0·001; intensity: GLM partial χ2=9·01, P<0·05). Chi square tests stated that there was a significant drop in prevalence from subadults to adults (χ2=7·01, P<0·05, D.F.=1, Fig. 2). If we compared species (Fig. 2), a decreasing intensity pattern was evident, mainly in P. picta, with values peaking at calf age class in both species.

Fig. 1. Age-prevalence and age-intensity patterns of bot fly larvae infection in red deer during the main infection period (from December to February). Vertical lines indicate 95% confidence limits for prevalence (Martin, 1987) and S.E. (95% confidence intervals) for intensity. Sampling size is indicated at the top of the bars.

Fig. 2. Age-prevalence of overall bot fly larvae and age-intensity pattern of Cephenemyia auribarbis (n=55) and Pharyngomyia picta (n=87) infection in red deer across age classes. Age-classes are classified as follows: (1) calves (less than 1 year); (2) subadults up to 4 years; (3) over 5 years (adults). Vertical lines indicate 95% confidence limits for prevalence (Martin, 1987) and 1·96 S.E. (95% confidence intervals) for intensity.
Higher infection rates were found in males than in females during the hunting season. Mean prevalence was higher in males than females (68·60±9·8%, n=86 and 50·00±8·23%, n=144 respectively, χ2=28·82, P<0·001). Mean intensity of infection was also higher in males than in females (21·52±16·26, n=59 and 14·81±15·87, n=72 respectively, GLM partial χ2=4·39, P<0·05).
Yearly variations of infection (prevalence and intensity) with reference to hunting seasons (from December to March) are shown in Table 2. Abundance and intensity of infection differed statistically between years (abundance: GLM partial χ2=27·65, P<0·001; intensity: GLM partial χ2=18·01, P<0·05) with lowest values in the central and at the latter years of the study. Also, there were statistical differences in the prevalence between classes of annual rainfall-grouped hosts (partial χ2=47·72, P<0·001, Fig. 3) with higher values in wet years. Interestingly, a correlational relationship was found when analysing the effect of rainfall in each species (thus, only during the overlapping period, from December to February). The autumnal rainfall immediately preceding (from October to December) correlated positively with P. picta mean intensities (r=0·82, P<0·001, n=9, Fig. 3) and P. picta to C. auribarbis intensity ratio (r=0·83, P<0·01, n=9), but no relation of climatological data with C. auribarbis intensity was statistically evident.
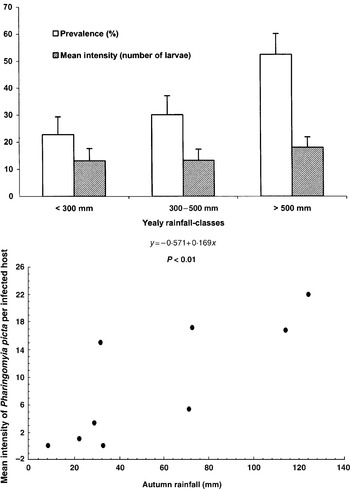
Fig. 3. Observed prevalences and intensities in relation to rainfall grouped as annual periods and relationship between autumnal rainfall and mean intensity of Pharyngomyia picta. Vertical lines indicate 95% confidence limits for prevalences (Martin, 1987) and 1·96 S.E. for intensities.

Monthly variations of infection
Monthly variations of prevalence and intensity of Oestridae larvae throughout the year are shown in Fig. 4. Prevalence and intensity showed similar seasonal profiles. Bot fly larvae were present all year round except for May, with maximum infection rates throughout the hunting season, peaking in January and February. A milder peak was detected in summer. Minimum infection rates preceded both annual peaks, in October–November and May respectively. We found that intensity of infection differed between both winter and summer cycles of infection for both subadult (8·79±2·28 and 0·34±0·22 respectively, F1,70=6·03, P<0·05) and adult age classes (5·56±2·40 and 1·22±1·04 respectively, F1,72=7·28, P<0·01). No differences were found at calf age (4·46±4·28 and 3·14±3·95 respectively, F1,29=1·86, P=0·183). Similarly, the prevalence of Oestridae differed between winter and summer cycles for subadults (54·28±8·29 and 9·91±5·34 respectively, B=0·69, Wald=27·86, P<0·0001) and adults (42·35±10·48 and 18·36±10·95 respectively, B=0·69, Wald=14·41, P<0·001) but not for calves (50·0±11·79 and 28·57±19·79 respectively, B=0·19, Wald=0·89, P=0·35).
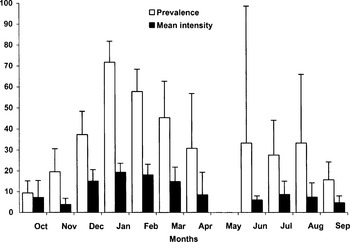
Fig. 4. Monthly prevalence and intensity of Oestridae larvae throughout the year. Vertical lines indicate 95% confidence limits for prevalence (Martin, 1987) and 1·96 S.E. (95% confidence intervals) for intensity.
Monthly variations of intensities of C. auribarbis and P. picta are represented in Fig. 5. C. auribarbis presence was restricted from December to February while P. picta was present almost all year round, therefore causing most myiasis outside the overlapping period. Instars of the two species inhabiting the same hosts overlapped in 42·70% of the cases of Oestridae infection (n=96) from December to February, with a maximum in January: 60% overlap.
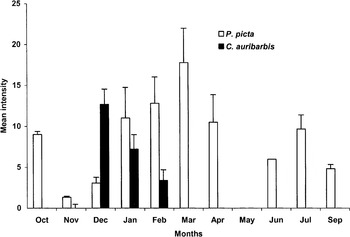
Fig. 5. Monthly intensity of Cephenemyia auribarbis and Pharyngomyia picta throughout the year. Vertical lines indicate 1·96 S.E. (95% confidence intervals).
The effect of concomitant infection
As mentioned above, C. auribarbis and P. picta overlapped from December to February. Thus, the following results refer to 91 identified samples across this period only. The mean intensity of C. auribarbis was 10·85 larvae/animal (n=55) and the intensity of P. picta was 13·48 larvae/animal (n=68); 32 out of 91 (35·16%) samples presented a single infection. Mean oestrid larvae intensity±S.D. in concomitant infections was 16·13±12·94 (n=32) and mean intensity±S.D. in single infections was 19·35±19·14 (n=59). Over the period that both species overlapped, as Fig. 6 shows, the intensity of P. picta in concomitant infections with C. auribarbis was lower than in infections exclusively with P. picta (5·84±6·90 vs. 20·91±21·25 respectively, n=32 and n=36 respectively) while the intensity of C. auribarbis infections did not show apparent differences in the case of co-parasitism (10·28±9·61 vs. 11·65±8·16 respectively, n=32 and n=23 respectively). The prevalence of P. picta was positively affected by the presence of C. auribarbis (logistic regression coefficient B=2·69, Wald=12·07, P>0·0001). Nevertheless, the intensity of infection of P. picta was negatively affected by the presence of C. auribarbis (GLM χ2=33·35, estimate for a positive presence of C. auribarbis=−1·799, P<0·001).
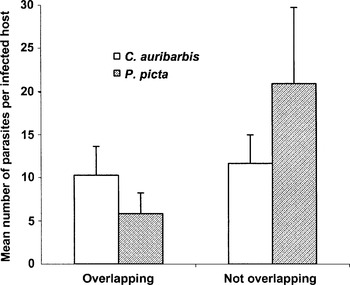
Fig. 6. Comparison of the mean intensities of Cephenemyia auribarbis and Pharyngomyia picta during the period of possible larvae concomitant infection with and without overlapping. Vertical lines indicate 1·96 S.E. (95% confidence intervals).
The relationship between bot flies and body condition
After controlling for body length, sex and season, the best significant GLM obtained included Oestridae abundance as significant at calf age (GLM partial χ2=7·83, P<0·01) and subadult age (GLM partial χ2=4·32, P<0·05). At adult age stage, Oestridae abundance was not statistically significant (GLM partial χ2=3·57, P>0·05). Oestridae intensity was significant at subadult age (F1,54=4·50, P<0·05). We display the relative body condition indexes in Fig. 7 as the mean residuals of a linear regression of body mass (carcass weight) on jaw length (R=0·463, P<0·01, n=40; R=0·880, P<0·001, n=87; R=0·808, P<0·001, n=65; for calves, subadults and adults respectively).

Fig. 7. Standardized residuals of linear regressions of body mass on jaw length for individuals across age-classes. Age-classes are classified as follows: (1) calves (less than 1 year); (2) subadults up to 4 years; (3) over 5 years (adults). Vertical lines indicate 1·96 S.E. (95% confidence intervals). The symbol * indicates significant differences between infected and uninfected individuals (P<0·05).
DISCUSSION
Oestridae intensity of infection affected body condition (body mass) in both calf and subadult deer, but not in adults. Increasing resistance to establishment and development of the parasite due to acquired immunity, and consequently lower parasite loads, may cause a limited effect of the parasite on adult host body condition. Stien et al. (2002) described the effect of gastrointestinal parasites on female reindeer back fat. The main effect of Oestridae larvae infection in Iberian red deer could be on the growth and development of young deer, which include subadult females, animals already contributing to breeding. Subsequently, this could result in a delayed effect on the fitness of these animals since adult fitness depends on juvenile ‘quality’. Although not reported, nasopharyngeal bot flies could reduce the body weight and fat reserves of affected animals by limiting the intake of forage, especially in those young animals, where parasites (the highest intensities we reported) coexist in spaces (areas close to oropharynx) smaller than those of adults. As Hudson & Dobson (1995) reviewed, the host's competitive ability also may be reduced by the effect of infection on predation, accident or infection with other parasites. Also, parasitism and nutritional status may interact to affect breeding production since parasites work through an effect on host condition (Stien et al. 2002).
Another of the main findings in this study was the evidence for parasite competition. The biological cycles of the two oestrids did not overlap completely across the year. We suggest that these asynchronous life-cycles may be a mechanism to reduce inter-specific competition between these parasites, avoiding concomitant infection. The most important difference in the phenology of both species is the earlier development of larvae instars of C. auribarbis, with subsequent implications in the relationship between both species in concomitant infections. First, the presence of C. auribarbis and P. picta was positively associated across the hosts from which we identified the species. This finding may be explained by a different susceptibility of hosts being infected by nasopharyngeal bot fly larvae (we will discuss the heterogeneity of infection by oestrids in this population below). So, assuming that the aggregated distributions of different parasite species are independent of one another, there may be few opportunities for two species to co-occur in the same individual. We suggest that the infected animals are probably the individuals most susceptible to infection by nasopharyngeal bot fly larvae, including both species, explaining this positive presence relationship. Thus, it seems that similar mechanisms may operate in relation to susceptibility of infection to both species of bot flies. Nevertheless, once infection occurs, interspecific competence interactions may also develop. Any C. auribarbis presence seems to reduce P. picta load in cases of co-occurrence. The number of parasites compared with that observed in single infections changes, providing good evidence that the species involved are interacting. The interactions involved in concomitant infections are complex. In this case, where parasites with a similar nature of infection interact, such interactions may be mainly ecological, e.g. competition for space or resources while immunological mechanisms seem not to apply here (Cox, 2001). It has been reported that there are no differences in the predilection of larvae location sites of these two species (Ruiz et al. 1993; Bueno-de la Fuente et al. 1998). Our results suggest a domination of C. auribarbis, operating the hypothesis that niche restriction leads to higher interspecific competence (Cox, 2001). This dominance relationship is possibly due to an earlier and shorter maturation period of C. auribarbis larvae, which reach larger size and heavier weight than P. picta in spite of instar 1 of the latter being larger (Cameron, 1932; Gil Collado et al. 1985; De la Fuente et al. 2000). The more rapid and seasonally restricted presence of C. auribarbis larvae may be compensated by a larger survival in pupal diapause in the environment. An alternative strategy of P. picta could consist of the development of a second generation in summer.
We found that previous annual rainfall affected positively the level of infection in the population. A yearly response to climatological variables suggests the strong influence of climate on the life-cycle of these parasites. Annual rainfall positively affected the prevalence rather than intensity of Oestridae infection. Climatological factors possibly affect the pupal stage, which, after dropping on the ground, develop in the soil. The period of pupation of Oestridae varies with the species and with climatic conditions (e.g. Nilssen, 1997). The Mediterranean climate is characterized by considerable inter-annual variations in rainfall. Favourable years or favourable seasonal periods for Oestridae pupae stages of the study area, may be reflected in the following abundance of adults and subsequent increased possibilities of infecting hosts. A decline in the number of larvae of oestrids was related to a drought year, possibly due to low soil moisture in a mule deer population (Odocoilus hemionus) (McMahon & Bunch, 1989). Breyev (1973) reported that soil moisture, through affecting the pupal stage, may cause mortality of oestrids. The summer climate during infection affected the differences of the reindeer nose bot fly infection between years in reindeer in Norway (Nilssen & Haegerud, 1995). In this subarctic region the infection period occurs earlier than in nasopharyngeal bot flies in Mediterranean areas from Spain. Particularly, we identified that autumn rainfall could be critical for P. picta development. C. auribarbis, which is able to undergo a longer pupal diapause than P. picta, seems less affected than the other sympatric oestrid. Environmental factors could also influence the behaviour, such as mating activity in both sexes, survival and consequent larviposition of adult bot fly females (Anderson, Nilssen & Folstad, 1994).
We found a relatively high degree of aggregation in nasopharyngeal bot flies. In contrast to our results, however, Diptera parasites of large mammals, which enter the host after active searching by winged and very mobile females, may show a low degree of aggregation, for example Hipoderma infection in reindeer (Folstad et al. 1989). However, the general trend is that macroparasites occur in aggregated patterns across wild vertebrate populations (Wilson et al. 2001), stabilizing fluctuations of hosts (Anderson & May, 1978). Nilssen & Haugerud (1995) found a similar aggregated distribution of Cephenemyia trompe in reindeer in Norway. Since in the interaction between oestrids and red deer, host mortality and morbidity are expected to be dose dependent, the highly aggregated pattern makes it difficult for parasites to affect the population, thus resulting in an important regulating factor. No clinical sign of nasopharyngeal infection was ever found in any deer in this study. Nevertheless, the impact of parasites may be subclinical and parasite infection at the rates observed in this study may be sufficient to cause a reduction in body condition, which could reduce fitness through its effects on fecundity and survival (Albon et al. 1983, 2002).
The few reference values on the infection by oestrids in Iberian red deer have usually been restricted to the hunting season, which is coincident with the highest bot fly infection levels across the year. Prevalence of Oestridae larvae in our report reaches the maximum in January (71·79%), and is slightly lower than those maxima reported in central and southern Spain, over 80% (Ruiz et al. 1993; Bueno-de la Fuente et al. 1998; De la Fuente et al. 2000). In the same way, our maximum oestrid larvae intensity levels, obtained in January (19·36 larvae/animal) and February (18·11 larvae animal) are slightly lower than those reported in central Spain in the same months, 21·27 larvae/animal and 30·58 larvae/animal respectively (De la Fuente et al. 2000) and in southern Spain in two different reports during hunting periods (from October to February), 28·12 larvae/animal (Ruiz et al. 1993) and 26·85 larvae/animal (Ruiz & Palomares, 1993). The overall prevalence and intensity detected in this research (35·19% and 15·61 larvae per infected host) are close to those reported in the only previous research involving year-long sampling: 41·89% and 14·52 larvae per infected animal (De la Fuente et al. 2000). The overall intensity of P. picta (12·98 larvae/animal) was similar to that of C. auribarbis (10·73 larvae/animal). Nevertheless, it is more common to observe lower relative values for C. auribarbis than for P. picta (Ruiz et al. 1993; Ruiz & Palomares, 1993; De la Fuente et al. 2000).
The pattern of occurrence of both species is coincident with that already described for nasopharyngeal bot flies in Central Spain. The low infection rates found previously in summer and winter peaks may be related to dropping of mature larvae from the deer. Thus, the dynamics of both species showed a winter profile and additionally a second summer parasite generation of P. picta larvae was described. Our findings are in agreement with De la Fuente et al. (2000), who showed for the first time that two generations of P. picta were apparently present in red deer in Central Spain. Sugár (1976) reported that P. picta is able to maintain apparently a continous infection across the year in central Europe (Hungary) due to a very long maturation period of larvae. In the same research, C. auribarbis, with a sorther maturation period, was more seasonaly restricted. Both species showed low levels of infection in early summer in central Europe, but data were not available for autumn, where we also found low infection levels. The general pattern of infection decribed by Súgar (1976) peaked in March–April, just after the peak reported in this paper. Our findings were in agreement regarding the earlier development of larvae instars of C. auribarbis.
There were sex-related differences in prevalence and intensity of infection, not interacting in any case with age classes. In vertebrate species, it is predictable that males tend to harbour more parasites than females (e.g. Alexander & Stimson, 1988; Poulin, 1996). This pattern may be due to ecological differences between sexes. In mammals, males are usually larger than females. Large deer may be larger targets to infective stages or ingest more (Wilson et al. 2001). The different sizes of the retropharyngeal recesses could also be a source of variation between sexes at similar ages (Bueno-de la Fuente et al. 1998). Another possible explanation or contribution is that individuals of both sexes simply differ in their exposure to parasites because of their different feeding habits or habitat use. Physiological differences may also contribute to generate sex differences in the susceptibility to parasites, mainly caused by the different roles of males and females in any activities related to sexual selection (Alexander & Stimson, 1988). Steroid hormones are known to have direct or indirect effects on the immune system and/or parasite development (Zuk & McKean, 1996, reviewed by Wilson et al. 2001). The immunocompetence handicap hypothesis proposed that males may have higher parasite loads than females due to the immunosuppressive effects of testosterone (Hamilton & Zuk, 1982). Immunity parameters have been found to be negatively affected in polygynous males but not in monogamous ones (Klein, 2000) but little evidence is available from large mammals, including cervids (Folstad et al. 1989; Folstad & Karter, 1992). The red deer, a polygynous ungulate species, could be an example that this hypothesis operates in the wild, but this model must be tested in the future. Neither previous literature nor our monitoring of this population suggests parasite-induced mortality by Oestridae that could affect the age-infection profile. Exposure to the parasite does not seem to be affected by age except for calves and, in this case, they would be less exposed to infective stages of the parasite. The peak of the calving season occurs between May and June in the study area, and the calves possibly are not a target for oestrids since in early life, they are kept most of the day hidden from predators (Clutton-Brock, Albon & Guinness, 1987). Moreover, deer social groups include a pool of age classes with presumably similar exposure to the parasite. Finally, calves offer the smallest niche for the development of parasites. In spite of the previous issues, calves showed the highest infection rates, suggesting that immunological processes could be operating.
Age class was an important factor generating differences of infection rates (prevalence and intensity) across the deer. Infection peaked at calf age, generating decreasing prevalence-age and intensity-age curves with a slight trend to decrease in adults. The majority of macroparasite systems show age-intensity curves with an initial increase after the age at which an animal is first susceptible to infection (Hudson & Dobson, 1995). Mechanisms which may generate different age-infection profiles in the hosts include parasite-induced mortality, age-dependent changes in exposure to parasites, acquired immunity and age-related changes in predisposition to infection (Hudson & Dobson, 1995; Wilson et al. 2001).
Acquired immunity could generate a degree of heterogeneity in susceptibility to Oestridae infection within this host population (Wilson et al. 2001). Acquired immunity is difficult to demonstrate in macroparasite infections, but we can infer it from the age-infection pattern. Oestrid larvae have a seasonal life-span in the host and recurrent infection could occur along the life of the hosts. An early high transmission rate of bot flies in the population could generate the peak infection at early ages (nearly 50% of deer were infected in their first year of life). As a result of accumulated experience to parasite antigens, the level of parasite infections declines due to a protective response (Lloyd, 1995). The number of exposures to oestrids or the level and length of protective immunity that oestrid infections confere is unknown, but a milder decreasing age-pattern seems to occur in the infection by nasopharyngeal Oestridae larvae in the Iberian red deer, both in intensity and in prevalence. This suggests that reinfection in deer occurs through its life with partial protective acquired immunity. Little is known about immune regulation of the number of nasopharyngeal bot flies in the host, but it has been hypothesized for the warble fly (Hipoderma tarandi) infection in reindeer that first-instar larvae are subject to high mortality (Folstad et al. 1989).
We reported the first long-term study of bot fly larvae infection in a wild mammal population and the interactions of the involved parasitic species in concomitant infections. As described above, this study has shown that both individual factors, sex and age, possibly related with differences in the ability to mount an effective immunological response, contribute to generate overdispersion among parasites. On the other hand, weather could affect the population dynamics of parasites, affecting the overall transmission rate. We correlated measures of infection and host fitness, showing a negative impact of oestrids on the body condition of young animals. The red deer and its parasites could be an excellent model to study host–parasite interactions. Future research is needed to elucidate the impact of parasites on the condition and survival of this wild ungulate species, and the ability of parasites to regulate the host populations.
We thank P. Acevedo for his help in the figure design, J. Lucientes for assisting in the identification of larvae and J. Martínez, J. A. Blanco and G. Blanco for statistical analysis. We are very grateful to the gamekeepers for their help in the fieldwork. J. Vicente was supported by a predoctoral grant from Junta de Comunidades de Castilla-La Mancha. This is a contribution to CICYT AGL 2001-3947 project. This is a result of the agreement between Yolanda Fierro and Universidad de Castilla-La Mancha.
References
REFERENCES
ALBON, S. D.,
MITCHELL, B. &
STAINES, B. W.
(
1983).
Fertility and body-weight in female red deer. A density-dependent relationship.
Journal of Animal Ecology
52, 969–980.Google Scholar
ALBON, S. D.,
STIEN, A., IRVINE, R. J.,
LANGVATN, R.,
ROPSTAD, E. &
HALVORSEN, O.
(
2002).
The role of parasites in the dynamics of a reindeer population.
Proceedings of the Royal Society of London, B
269, 1625–1632.CrossRefGoogle Scholar
ALEXANDER, J. &
STIMSON, W. H.
(
1988).
Sex hormones and the course of parasitic infection. Parasitology Today
4, 189–193.CrossRefGoogle Scholar
ANDERSON, J. R.,
NILSSEN, A. C. &
FOLSTAD, I.
(
1994).
Mating behavior and thermoregulation of the reindeer warble fly, Hypoderma tarandi (Diptera, Oestridae).
Journal of Insect Behavior
7, 679–706.CrossRefGoogle Scholar
ANDERSON, R. C. &
MAY, R. M.
(
1978).
Regulation and stability of host–parasite population interactions. I. Regulatory processes.
Journal of Animal Ecology
47, 219–247.Google Scholar
BREYEV, K. A.
(
1973).
Some general principles of the control of parasitic arthropods as exemplified by the control of warble flies.
Entomological Review
52, 142–151.Google Scholar
BUENO-DE LA FUENTE, M. L.,
MORENO, V.,
PEREZ, J. M.,
RUIZ-MARTÍNEZ, I. &
SORIGUER, R. C.
(
1998).
Oestrosis in red deer from Spain.
Journal of Wildlife Diseases
34, 820–824.CrossRefGoogle Scholar
CAMERON, A. E.
(
1932).
The nasal bot fly, Cephenemyia auribarbis Meig. (Diptera: Tachinidae) of the red deer, Cevus elaphus L.
Parasitology
24, 185–195.Google Scholar
CLUTTON-BROCK, T. H.,
ALBON, S. D. &
GUINNESS, F. E.
(
1987).
Interactions between population density and maternal characteristics affecting fecundity and juvenile survival in red deer.
Journal of Animal Ecology
56, 857–871.CrossRefGoogle Scholar
CRAWLEY, M. J.
(
1993).
GLIM for Ecologists. Blackwell, London.
COGLEY, T. P.
(
1987).
Effects of Cephenemyia spp. (Diptera: Oestridae) on the nasopharynx of black-tailed deer (Odocoileus hemionus columbianus).
Journal of Wildlife Diseases
23, 596–605.Google Scholar
COX, F. E.
(
2001).
Concomitant infections, parasites and immune responses.
Parasitology 122, S23–S38.CrossRefGoogle Scholar
DE LA FUENTE, C.,
SAN MIGUEL, J. M.,
SANTIN, M., ALUNDA, J. M.,
DOMINGUEZ, I.,
LOPEZ, A., CARBALLO, M. &
GONZALEZ, A.
(
2000).
Pharyngeal bot flies in Cervus elaphus in central Spain: prevalence and population dynamics.
Journal of Parasitology
86, 33–37.CrossRefGoogle Scholar
FESTA-BIANCHET, M.
(
1989).
Individual differences, parasites and the costs of reproduction for bighorn ewes (Ovis canadensis).
Journal of Animal Ecology
58, 785–795.CrossRefGoogle Scholar
FIERRO, Y., GORTAZAR, C.,
LANDETE-CASTILLEJOS, T.,
VICENTE, J., GARCÍA, A. &
GALLEGO, L.
(
2002).
Baseline values for cast antlers of Iberian red deer (Cervus elaphus hispanicus).
Zeitschrift für Jagdwissenschaft
48, 244–251.CrossRefGoogle Scholar
FOLSTAD, I. &
KARTER, A. J.
(
1992).
Parasites, bright males, and the immunocompetence handicap.
American Naturalist
139, 603–622.CrossRefGoogle Scholar
FOLSTAD, I., NILSSEN, A. C.,
HALVORSEN, O. &
ANDERSEN, J.
(
1989).
Why do male reindeer (Rangifer tarandus) have higher abundance of 2nd and 3rd instar larvae of Hypoderma tarandi than females?
Oikos
55, 87–92.Google Scholar
FOREYT, W. J.,
LEATHERS, C. W. &
HATTAN, G.
(
1994).
Bot fly larvae (Cephenemyia jellisoni) as a cause of neurologic signs in an elk.
Journal of Wildlife Diseases
30, 470–471.CrossRefGoogle Scholar
GIL COLLADO, J.
(
1955).
Las especies españolas de estridos (sensu latu). Revista Ibérica de Parasitología. Vol. (ext.), 411–420.Google Scholar
GIL COLLADO, J.,
VALLS, J. L. &
FIERRO, Y.
(
1985).
Estudio de las larvas de Oestridae parasitas de Cervidae en España.
Boletim de la Sociedade Portuguesa de Entomología
1, 467–475.Google Scholar
GULLAND, F. M.
(
1992).
The role of nematode parasites in Soay sheep (Ovis aries L.) mortality during a population crash. Parasitology
105, 493–503.Google Scholar
GULLAND, F. M. D.
(
1995).
Impact of infectious diseases on wild animals. In Ecology of Infectious Diseases in Natural Populations (
ed. Grenfell, B. T. &
Dobson, A. P.
), pp. 20–51. Cambridge University Press,
Cambridge.CrossRef
GULLAND, F. M. D.,
ALBON, S. D.,
PEMBERTON, J. M.,
MOOREIOJT, P. R. &
CLUTTON-BLOCK, T. H.
(
1993).
Parasite-associated polymorphism in a cyclic ungulate population.
Proceedings of the Royal Society of London, B
254, 7–13.CrossRefGoogle Scholar
HAMILTON, W. D. &
ZUK, M.
(
1982).
Heritable true fitness and bright birds: a role for parasites?
Science
218, 383–387.Google Scholar
HUDSON, P. J. &
DOBSON, A. P.
(
1995).
Macroparasites: observed patterns. In Ecology of Infectious Diseases in Natural Populations (
ed. Grenfell, B. T. &
Dobson, A. P.
), pp. 144–176. Cambridge University Press,
Cambridge.CrossRef
HUDSON, P. J.,
DOBSON, A. P. &
NEWBORN, D.
(
1985).
Cyclic and non-cyclic populations of red grouse: a role for parasitism? In
Ecology and Genetics of Hosts–parasite Interactions (
ed. Rollinson, D. &
Anderson, R. M.
), pp. 77–90. Academic Press,
London.
HUDSON, P. J.,
DOBSON, A. P. &
NEWBORN, D.
(
1998).
Prevention of population cycles by parasite removal.
Science
282, 2256–2258.CrossRefGoogle Scholar
HUDSON, P. J.,
NEWBORN, D. &
DOBSON, A. P.
(
1992).
Regulation and stability of a free-living host–parasite system: Trichostrongylus tenuis in red grouse. I. Monitoring and parasite reduction experiments.
Journal of Animal Ecology
61, 681–692.Google Scholar
KLEIN, S. L.
(
2000).
Hormones and mating system affect sex and species differences in immune function among vertebrates.
Behavioral Processes
51, 149–166.CrossRefGoogle Scholar
KLEVEZAL', G. A. &
KLEINENBERG, S. E.
(
1967).
Age determination of mammals from annual layers in teeth and bones. USSR Academy of Sciences, Severtsov Inst. Anim. Morphol. Clearinghouse Fed. Sci. Tech. Inf. U.S. Dep. Commer, Springfield (Translated from Russian).
LLOYD, S.
(
1995).
Environmental influences on host immunity. In Ecology of Infectious Diseases in Natural Populations (
ed. Grenfell, B. T. &
Dobson, A. P.
), pp. 327–361.
Cambridge University Press,
Cambridge.CrossRef
McMAHON, D. C. &
BUNCH, T. D.
(
1989).
Bot fly larvae (Cephenemyia spp., Oestridae) in Mule Deer (Odocoilus hemionus) from Utah.
Journal of Wildlife Diseases
25, 636–638.Google Scholar
MARGOLIS, L.,
ESCH, G. W.,
HOLMES, J. C.,
KURIS, A. M. &
SCHAD, G. A.
(
1982).
The use of ecological terms in parasitology (report of an ad hoc Committee of the American Society of Parasitologists).
Journal of Parasitology
68, 131–133.CrossRefGoogle Scholar
MARTIN, S. W.,
MEEK, A. H. &
WILLEBERG, P.
(
1987).
Veterinary Epidemiology.
Iowa State University Press,
Ames.
NILSSEN, A. C. &
HAUGERUD, R. E.
(
1995).
Epizootiology of the reindeer nose bot fly, Cephenemyia trompe (Modeer) (Diptera: Oestridae), in reindeer, Rangifer tarandus (L.), in Norway.
Canadian Journal of Zoology
73, 1024–1036.CrossRefGoogle Scholar
NILSSEN, A. C.
(
1997).
Effect of temperature on pupal development and eclosion dates in the reindeer oestrids Hypoderma tarandi and Cephenemyia trompe (Diptera: Oestridae).
Physiological and Chemical Ecology 26, 296–306.CrossRefGoogle Scholar
POULIN, R.
(
1996).
Sexual inequalities in helminth infection: a cost of being male?
American Naturalist
147, 287–295.Google Scholar
RUIZ MARTINEZ, I. &
PALOMARES, F.
(
1993).
Occurrence and overlapping of pharyngeal bot flies Pharyngomyia picta and Cephenemyia auribarbis (Oestridae) in red deer of southern Spain.
Veterinary Parasitology
47, 119–127.CrossRefGoogle Scholar
RUIZ, I., SORIGUER, R. C. &
PEREZ, J. M.
(
1993).
Pharyngeal bot flies (Oestridae) from sympatric wild cervids in southern Spain.
Journal of Parasitology
79, 623–626.CrossRefGoogle Scholar
SCOTT, M. E.
(
1987).
Regulation of mouse colony abundance by Heligmosomoides polygyrus. Parasitology 95, 111–124.CrossRefGoogle Scholar
SHAW, D. J.,
GRENFELL, B. T. &
DOBSON, A. P.
(
1998).
Patterns of macroparasite aggregation in wildlife host populations.
Parasitology
117, 597–610.CrossRefGoogle Scholar
SHAW, D. J. &
DOBSON, A. P.
(
1995).
Patterns of macroparasite abundance and aggregation in wildlife populations: a quantitative review.
Parasitology 111, S111–S133.CrossRefGoogle Scholar
STIEN, A, IRVINE, R. J.,
ROPSTAD, E.,
HALVORSEN, O.,
LANGVATN, R. &
ALBON, D.
(
2002).
The impact of gastrointestinal nematodes on wild reindeer: experimental and cross-sectional studies.
Journal of Animal Ecology
71, 937–945.CrossRefGoogle Scholar
SUGÁR, L.
(
1974).
The occurrence of nasal throat bot flies (Oestridae) in wild ruminants in Hungary.
Parasitologia Hungarica
7, 181–189.Google Scholar
SUGÁR, L.
(
1976).
Seasonal incidence of larvae of Pharyngomyia picta (Meigen) 1824 and Cephenemyia auribarbis (Meigen) 1824 (Oestridae) in red deer (Cervus elaphus hippelaphus) in Hungary.
Parasitologia Hungarica
9, 73–84.Google Scholar
WILSON, K., GRENFELL, B. T. &
SHAW, D. J.
(
1996).
Analysis of aggregated parasite distributions: a comparison of methods.
Functional Ecology
10, 592–601.CrossRefGoogle Scholar
WILSON, K. & GRENFELL, B. T.
(
1997).
Generalised linear modelling for parasitologists. Parasitology Today
13, 33–38.CrossRefGoogle Scholar
WILSON, K., BJORNSTAD, O. N.,
DOBSON, A. P.,
MERLER, S., POGLAYEN, G.,
RANDOLPH, S. E.,
READ, A. F. &
SKORPING, A.
(
2001).
Heterogeneities in macroparasite infections: patterns and processes. In
The Ecology of Wildlife Diseases (
ed. Hudson, P. J.,
Rizzoli, A.,
Grenfell, B. T., Heesterbeek, H. &
Dobson, A. P.
), pp. 6–44. Oxford University Press,
Oxford.
ZUK, M. & McKEAN, K. A.
(
1996).
Sex differences in parasite infections: patterns and processes.
International Journal for Parasitology
26, 1009–1023.CrossRefGoogle Scholar
ZUMPT, F.
(
1965).
Myiasis in man and animals in the old world. Butterworths, London.
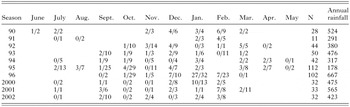
Table 1. Distribution of hosts across seasons and months along the study period

Fig. 1. Age-prevalence and age-intensity patterns of bot fly larvae infection in red deer during the main infection period (from December to February). Vertical lines indicate 95% confidence limits for prevalence (Martin, 1987) and S.E. (95% confidence intervals) for intensity. Sampling size is indicated at the top of the bars.
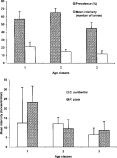
Fig. 2. Age-prevalence of overall bot fly larvae and age-intensity pattern of Cephenemyia auribarbis (n=55) and Pharyngomyia picta (n=87) infection in red deer across age classes. Age-classes are classified as follows: (1) calves (less than 1 year); (2) subadults up to 4 years; (3) over 5 years (adults). Vertical lines indicate 95% confidence limits for prevalence (Martin, 1987) and 1·96 S.E. (95% confidence intervals) for intensity.
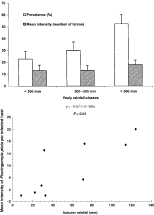
Fig. 3. Observed prevalences and intensities in relation to rainfall grouped as annual periods and relationship between autumnal rainfall and mean intensity of Pharyngomyia picta. Vertical lines indicate 95% confidence limits for prevalences (Martin, 1987) and 1·96 S.E. for intensities.
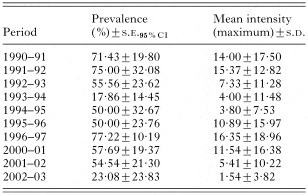
Table 2. Variations of Oestridae prevalence and intensity of infection during the hunting season (from December to March) among yearly periods
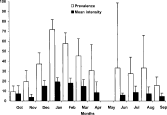
Fig. 4. Monthly prevalence and intensity of Oestridae larvae throughout the year. Vertical lines indicate 95% confidence limits for prevalence (Martin, 1987) and 1·96 S.E. (95% confidence intervals) for intensity.
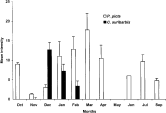
Fig. 5. Monthly intensity of Cephenemyia auribarbis and Pharyngomyia picta throughout the year. Vertical lines indicate 1·96 S.E. (95% confidence intervals).
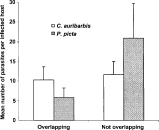
Fig. 6. Comparison of the mean intensities of Cephenemyia auribarbis and Pharyngomyia picta during the period of possible larvae concomitant infection with and without overlapping. Vertical lines indicate 1·96 S.E. (95% confidence intervals).
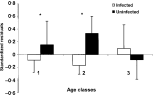
Fig. 7. Standardized residuals of linear regressions of body mass on jaw length for individuals across age-classes. Age-classes are classified as follows: (1) calves (less than 1 year); (2) subadults up to 4 years; (3) over 5 years (adults). Vertical lines indicate 1·96 S.E. (95% confidence intervals). The symbol * indicates significant differences between infected and uninfected individuals (P<0·05).
 You have
Access
- 32
- Cited by