1. Introduction
The transport of orientable microorganisms or particles in a suspension is of fundamental importance for many ecological, medical and engineering applications. For example, the non-trivial macroscopic transport of motile species of phytoplankton is responsible for the formation of an ecological hotspot (Durham, Kessler & Stocker Reference Durham, Kessler and Stocker2009; Durham et al. Reference Durham, Climent, Barry, De Lillo, Boffetta, Cencini and Stocker2013). The shape-dependent sedimentation of non-motile species in turbulent water (Voth & Soldati Reference Voth and Soldati2017) may also be a significant factor affecting the carbon sequestration process in the ocean, a crucial process in the Earth's carbon cycle. On the medical front, modelling the transport of bacteria helps us to understand how they spread or propagate collectively on surfaces through swarming (see review by Koch & Subramanian Reference Koch and Subramanian2011). In engineering, controlling the transport of bottom-heavy algal species in bioreactors may improve biofuel harvesting (Croze et al. Reference Croze, Sardina, Ahmed, Bees and Brandt2013).
The macroscopic transport of particles is a key component in modelling the complex dynamics and rich collective behaviour of a suspension. While individual particles can be modelled with the Stokes equations given their small size ( $1 - 10\,\mathrm {\mu }{\rm m}$ for bacteria and
 $10 - 100\,\mathrm {\mu }{\rm m}$ for algae), the emergent behaviour and the flow environment are often at a larger length scale than the individuals (see review by Koch & Subramanian Reference Koch and Subramanian2011; Elgeti, Winkler & Gompper Reference Elgeti, Winkler and Gompper2015; Clement et al. Reference Clement, Lindner, Douarche and Auradou2016; Bees Reference Bees2020). The difference in length scale poses a significant challenge to the modelling of their collective behaviour.
Some of these emergent behaviours are the result of many-body interactions between particles. For example, bacterial turbulence and spontaneous self-organisation of bacterial suspension in confinement (Dombrowski et al. Reference Dombrowski, Cisneros, Chatkaew, Goldstein and Kessler2004; Wioland et al. Reference Wioland, Woodhouse, Dunkel, Kessler and Goldstein2013) are usually found in dense suspension where near-field hydrodynamics and nematic alignment are the driving mechanisms (Costanzo et al. Reference Costanzo, Di Leonardo, Ruocco and Angelani2012; Wioland et al. Reference Wioland, Woodhouse, Dunkel, Kessler and Goldstein2013; Lushi, Wioland & Goldstein Reference Lushi, Wioland and Goldstein2014). Phenomenological models (e.g. Wensink et al. Reference Wensink, Dunkel, Heidenreich, Drescher, Goldstein, Löwen and Yeomans2012; Dunkel et al. Reference Dunkel, Heidenreich, Drescher, Wensink, Bär and Goldstein2013; Słomka & Dunkel Reference Słomka and Dunkel2017) are often used to describe the collective phenomenon in these dense suspensions when it is challenging to derive a model from the microscopic dynamics via a ‘bottom-up’ approach. On the other hand, in dilute or semi-dilute suspensions where interactions between particles are predominantly hydrodynamic, Stokesian dynamics (e.g. Brady & Bossis Reference Brady and Bossis1988; Sierou & Brady Reference Sierou and Brady2001) or other Stokesian-based simulations (e.g. Ishikawa, Locsei & Pedley Reference Ishikawa, Locsei and Pedley2008; Delmotte et al. Reference Delmotte, Keaveny, Plouraboué and Climent2015; Schoeller & Keaveny Reference Schoeller and Keaveny2018) are often used to model the collective dynamics of self-propelling particles. However, these numerical tools do not apply to large-scale fluid systems where the inertial force becomes important in the dynamics (e.g. bioconvection and turbulence).
This work focuses on the collective phenomena in the dilute limit, i.e. when the length scale of a particle is much smaller than the distance between particles such that the volume fraction is vanishing. Emergent behaviours in dilute suspensions are usually the result of the non-trivial transport caused by the biased motility (e.g. ‘taxis’ for microorganisms) or sedimentation of orientable particles stemming from the flow-field-dependent orientation of individual particles. For example, bioconvection (see review by Bees Reference Bees2020), unmixing (Durham et al. Reference Durham, Climent, Barry, De Lillo, Boffetta, Cencini and Stocker2013) and gyrotactic shear trapping (Durham et al. Reference Durham, Kessler and Stocker2009) are the results of the balancing influence of external fields (e.g. gravity, light or chemical gradient) and the flow field on the particles’ orientation. Other phenomena such as shear trapping (Bearon & Hazel Reference Bearon and Hazel2015; Ezhilan & Saintillan Reference Ezhilan and Saintillan2015; Vennamneni, Nambiar & Subramanian Reference Vennamneni, Nambiar and Subramanian2020) and enhanced sedimentation (Clifton, Bearon & Bees Reference Clifton, Bearon and Bees2018) are the results of the alignment of elongated particles with the flow field. These macroscopic phenomena in the dilute limit can be derived from the microscopic trajectories of particles. Here, a ‘bottom-up’ derivation is preferred because it offers an explicit link between the micro- and macroscale phenomena, helping us to better understand the physics behind the phenomena.
Microscopically, a Langevin equation is often used to describe a particle's positional and rotational dynamics in the presence of thermal and/or biochemical noise. The typical approach to model the rotational dynamics of particles is to combine Jeffery's orbit (Jeffery Reference Jeffery1922; Bretherton Reference Bretherton1962; Hinch & Leal Reference Hinch and Leal1972a,Reference Hinch and Lealb), which governs how the local vorticity and strain rate orient a particle, with other orientational biases responsible for taxes such as gyrotaxis (e.g. Pedley & Kessler Reference Pedley and Kessler1990), phototaxis (e.g. Drescher, Goldstein & Tuval Reference Drescher, Goldstein and Tuval2010) and chemotaxis (e.g. Alt Reference Alt1980). If the suspension is dilute enough, the hydrodynamic stresses and forces from the particles to the flow and the hydrodynamic interactions between them are negligible and can be foregone. In that case, one may simulate them as (biased) active Brownian particles (ABPs): i.e. simulating an individual particle's positional and rotational trajectory through the Langevin equation while prescribing a flow field that is assumed to be not affected by the presence of other particles (Brownian dynamics simulation).
Alternatively, one can employ the statistical (continuum) equation which describes the probability density function of the ABPs governed by the Langevin equation (Doi & Edwards Reference Doi and Edwards1988). Some (e.g. Saintillan Reference Saintillan2018) refer to the equation as the Fokker–Planck equation, but in this work, this equation is referred to as the Smoluchowski equation so as not to be confused with the Fokker–Planck (FP) model introduced only for the particle orientation dynamics in earlier studies (Pedley & Kessler Reference Pedley and Kessler1990). While the Smoluchowski equation captures how the local flow field affects the trajectories of the particles, the hydrodynamic contribution of the particles can be later coupled with the flow equation through some averaged description of the bulk stresses and forces the particles exert on the flow (e.g. Batchelor Reference Batchelor1970; Hinch & Leal Reference Hinch and Leal1972a,Reference Hinch and Lealb; Pedley & Kessler Reference Pedley and Kessler1990). This approach was detailed in Saintillan & Shelley (Reference Saintillan and Shelley2015).
The continuum approach has several advantages over the individual-based approach. Firstly, the continuum approach is computationally more scalable as the cost of the individual-based method scales with the number of particles while the continuum method does not. Secondly, individual-based methods such as the Brownian dynamics simulation neglect the hydrodynamic contribution of the particles to the flow. For example, in bioconvection, buoyancy force from the particles is important even when the suspension is dilute, but it is difficult to capture the buoyancy force through individual-based simulations (see Bees Reference Bees2020). While a particle-laden approach can be used to incorporate the hydrodynamic presence of the particles, the method comes with a significantly higher computational cost. Thirdly, it is easier to analyse the continuum solutions than their individual-based counterparts. For example, it is difficult to perform a more formal analysis for the instability generated by the pusher stresslets in an active suspension without a continuum description (see Saintillan & Shelley Reference Saintillan and Shelley2008).
Despite the descriptive merit of the Smoluchowski-based continuum model, there are only a handful of works that utilise a direct numerical simulation of this equation (e.g. Chen & Jiang Reference Chen and Jiang1999; Saintillan & Shelley Reference Saintillan and Shelley2008; Saintillan Reference Saintillan2010; Jiang & Chen Reference Jiang and Chen2020). Instead, many resort to the equivalent Brownian dynamics simulations. This is because the equation has a high number of dimensions (spatial, orientational and temporal), which renders the individual-based simulations more computationally attractive than the numerical simulations of the continuum equation. However, as mentioned, the computational advantage of individual-based simulations is restricted to suspensions with a prescribed flow field. If the particles are exerting non-negligible forces or stresses on the flow, such as in the case of bioconvection, a continuum model is more attractive from both analytical and computational perspectives.
Several past works attempted to further reduce the computational cost of the Smoluchowski equation by modelling it with an approximated transport equation for motile particles. For example, the FP model attempted to postulate the effective transport coefficients (i.e. drift and diffusivity) through the quasi-steady orientational distribution of particles at each location in the flow field (Pedley & Kessler Reference Pedley and Kessler1990; Pedley Reference Pedley2010). Others attempted to employ the results from the generalised Taylor dispersion (GTD) theory in an unbounded homogeneous shear flow (Frankel & Brenner Reference Frankel and Brenner1991, Reference Frankel and Brenner1993; Hill & Bees Reference Hill and Bees2002; Bearon Reference Bearon2003; Manela & Frankel Reference Manela and Frankel2003) to approximate the local behaviour of the particles suspended in a more general flow field (e.g. Bearon, Hazel & Thorn Reference Bearon, Hazel and Thorn2011; Bearon, Bees & Croze Reference Bearon, Bees and Croze2012; Croze et al. Reference Croze, Sardina, Ahmed, Bees and Brandt2013; Croze, Bearon & Bees Reference Croze, Bearon and Bees2017; Fung & Hwang Reference Fung and Hwang2020; Fung, Bearon & Hwang Reference Fung, Bearon and Hwang2020), although the original GTD theory is not meant to be used for such a purpose. These past works attempted to reduce the Smoluchowski equation by reducing the number of dimensions resolved simultaneously while keeping intact the dependency of transport properties on the flow field. The present work is formulated to achieve a similar goal by seeking a model equation for the transport of biased or non-biased ABPs. In particular, we propose a new transport equation that approximates the number density directly from the higher-dimensional Smoluchowski equation.
Recent works such as Croze et al. (Reference Croze, Sardina, Ahmed, Bees and Brandt2013, Reference Croze, Bearon and Bees2017) and Fung et al. (Reference Fung, Bearon and Hwang2020) showed that the FP model of Pedley & Kessler (Reference Pedley and Kessler1990) is not as accurate as the GTD-based model utilising the local flow information in a unidirectional flow, especially at high shear rates. This is because the effective diffusion in the FP model is a phenomenological postulation with an ad hoc constant for unknown diffusion time scale. Also, it is based on the FP equation for orientational distribution only, not the Smoluchowski equation like in the GTD-based model. Despite this merit, the application of the GTD theory in Hill & Bees (Reference Hill and Bees2002) and Manela & Frankel (Reference Manela and Frankel2003) was for unbounded homogeneous shear flows only. When these models were applied to a bounded inhomogeneous shear flow by Bearon et al. (Reference Bearon, Bees and Croze2012), they implicitly assumed a quasi-homogeneity of the given flow field. Therefore, this approach is more precisely a quasi-homogeneous approximation of the GTD theory developed for homogeneous shear flow. Jiang & Chen (Reference Jiang and Chen2019, Reference Jiang and Chen2020) later demonstrated the rigorous applications of the GTD theory in both unbiased and biased ABP suspensions with inhomogeneous shear. In their works, the cross-stream direction was solved simultaneously with the orientation (local variables) while only the averaged streamwise dispersion was obtained in the streamwise direction (global variables). While Jiang and Chen had demonstrated the correct application of the GTD theory, their application remained specific to the parallel flow field of the problem.
Alternatively, Brady and colleagues have established procedures to obtain the drift and dispersion of passive colloids (Zia & Brady Reference Zia and Brady2010) and non-biased ABPs (Takatori & Brady Reference Takatori and Brady2014, Reference Takatori and Brady2017; Peng & Brady Reference Peng and Brady2020) in the Fourier space. In the small-wavenumber limit, their works have demonstrated an alternative route to derive an advection–diffusion equation equivalent to that of GTD in the Fourier space (compare Takatori & Brady (Reference Takatori and Brady2017) with Hill & Bees (Reference Hill and Bees2002) or Manela & Frankel (Reference Manela and Frankel2003)).
This work aims to propose a new transport model for biased or non-biased ABPs that is independent of the nature of the global flow field. In particular, we seek a model that can approximate the effective transport properties, such as the effective drift and dispersion, as a function of the local flow field. By writing the coefficients of the transport equation as a function of the local flow field, we aim to develop an approach that is generally applicable to any complex flow field, instead of re-evaluating such coefficients in each specific type of global flow field (e.g. Jiang & Chen Reference Jiang and Chen2019). We show that the Smoluchowski equation admits an exact transformation into a transport equation. Combining this transformation with the method of multiple scales, we propose a novel transport equation, in which the orientation dynamics is determined only by the local flow information in the physical space. Note that there is an important distinction between the GTD theory and the present model. In the GTD theory, one seeks effective drift and diffusion coefficients that are constant at macroscopic scale or in the homogeneous directions, while in the present method, we relax such requirement and seek effective drift and dispersion as a local variable that depends on the local flow field. More discussion on the difference between the present method and the GTD theory follows in § 2.2.
This work is organised as follows. In § 2, the Smoluchowski equation is presented with the equations governing the motion of active (or swimming) Brownian particles. We also briefly introduce the GTD model and how it differs from the present work. In § 3, the exact transformation of the Smoluchowski equation into a transport equation is introduced. While the transformed equation cannot be directly used as a model, it sets up the mathematical platform for a further approximation. In § 4, the local approximation is presented for the development of a novel transport equation model. In § 5, we present several examples using gyrotactic particle suspensions. We also demonstrate the accuracy of the newly introduced model by comparing the approximation with the full solution of the Smoluchowski equations in both one-dimensional shear flows and two-dimensional convective cells. In § 6, we further dissect the physical interpretation of the transformation and discuss the physical origin of the many drifts and dispersions from the transformation. Lastly, in § 7, we briefly outline the potential application of the local approximation and the remaining challenges in the proposed model.
2. Background
2.1. The Smoluchowski equation
We consider a dilute suspension of ABPs, where there is randomness in both the physical space  $\boldsymbol {x}^*$ and orientational space
 $\boldsymbol {p}$. In this study, the term ABP is used to refer to a self-propelling particle (or microswimmer) subject to a translational and/or rotational random walk. Given the stochastic nature of the trajectory, we consider the probability density function
 $\varPsi (\boldsymbol {x}^*,\boldsymbol {p},t^*)$ for particles located at
 $\boldsymbol {x}^*$ with orientation
 $\boldsymbol {p}$ at time
 $t^*$. The equation for
 $\varPsi (\boldsymbol {x}^*,\boldsymbol {p},t^*)$ is governed by the Smoluchowski equation (Doi & Edwards Reference Doi and Edwards1988):
 \begin{equation} \frac{\partial \varPsi}{\partial t^*}+\boldsymbol{\nabla}^*_{\boldsymbol{x}} \boldsymbol{\cdot} \left[ \dot{\boldsymbol{x}}^* \varPsi - D_T^* \boldsymbol{\nabla}^*_{\boldsymbol{x}} \varPsi \right] + \boldsymbol{\nabla}_{\boldsymbol{p}} \boldsymbol{\cdot} \left[ \dot{\boldsymbol{p}}^* \varPsi - d_r^* \boldsymbol{\nabla}_{\boldsymbol{p}} \varPsi \right] =0, \end{equation}
where the deterministic motion for  $\dot {\boldsymbol {x}}^*$ is governed by
 \begin{equation} \dot{\boldsymbol{x}}^*= \boldsymbol{u}^*+ V_c^*\boldsymbol{p}. \end{equation}
Here, the superscript ( $\cdot )^*$ represents dimensional variables or parameters,
 $\boldsymbol {u}^*$ is the prescribed flow velocity and
 $V_c^*\boldsymbol {p}$ the velocity of particles by active motion (swimming/motility). Meanwhile, the deterministic form of orientational dynamics for
 $\dot {\boldsymbol {p}}^*$ is governed by
 \begin{equation} \dot{\boldsymbol{p}}^*=\left(\frac{\boldsymbol{{\varOmega}}^*(\boldsymbol{x})}{2} \wedge \boldsymbol{p}+\alpha_0 \boldsymbol{p} \boldsymbol{\cdot} \boldsymbol{\mathsf{E}}^* \boldsymbol{\cdot} (\boldsymbol{\mathsf{I}} - \boldsymbol{pp}) \right) + \frac{1}{2B^*} \left[ \boldsymbol{k} - (\boldsymbol{k} \boldsymbol{\cdot} \boldsymbol{p})\boldsymbol{p} \right]. \end{equation}
Here, we assume that the particle is oriented by the local flow through the Jeffery equation (Jeffery Reference Jeffery1922; Bretherton Reference Bretherton1962), where  $\boldsymbol {{\varOmega }}^* = \boldsymbol {\nabla }^*_{\boldsymbol {x}} \wedge \boldsymbol {u}^*$ is the vorticity,
 $\boldsymbol{\mathsf{E}}^*=(\boldsymbol {\nabla }^*_{\boldsymbol {x}} \boldsymbol {u}^*+\boldsymbol {\nabla }^*_{\boldsymbol {x}} {\boldsymbol {u}^*}^T)/2$ the rate-of-strain tensor and
 $\alpha _0$ the Bretherton constant. In this work, we also consider gyrotaxis of the given particles (Pedley & Kessler Reference Pedley and Kessler1990), as they will be used in the flow examples in § 5. Gyrotaxis is given by the second term on the right-hand side of (2.3), where
 $\boldsymbol {k}$ is the unit vector pointing upwards (against gravity) and
 $B^*$ the gyrotactic time scale.
In (2.1), we have also assumed that the random motions in  $\boldsymbol {x}$ and
 $\boldsymbol {p}$ space can be modelled as translational diffusion with the corresponding diffusivity
 $D_T^*$ and rotational diffusion with the diffusivity
 $d_r^*$, respectively. The translational diffusion
 $D_T^*$ often originates from thermal fluctuation especially for small particles. However, it is often negligible for many microorganisms (e.g. microalgae), given their relatively large size. In this study, we keep this term without loss of generality, so that the proposed framework can be extended to other types of particles.
Equation (2.1) is subsequently non-dimensionalised with a suitable length scale and time scale. In this work, the characteristic length  $h^*$ is chosen from the given flow field, and the inverse of rotational diffusivity
 $1/d_r^*$ is selected as the time scale. For convenience, we also use the characteristic speed
 $U^*$ of the flow for the non-dimensionalisation. Hence,
 \begin{equation} \boldsymbol{x}=\frac{\boldsymbol{x}^*}{h^*}, \quad t={t^* d_r^*}\quad \mbox{and} \quad \boldsymbol{u}=\frac{\boldsymbol{u}^*}{U^*}. \end{equation}
The dimensionless parameters for the speed of motility (swimming)  $V_s^*$, the flow speed
 $U^*$, the translational diffusivity
 ${D}_T^*$ and the gyrotactic time scale
 $B^*$ are
 \begin{equation} Pe_s=\frac{V_s^* }{h^*d_r^*}, \quad Pe_f=\frac{U^* }{h^*d_r^*}, \quad {D}_T=\frac{{D}_T^*}{(h^*)^{2} d_r^*} \quad \mbox{and} \quad \beta=\frac{1}{2 d_r^* B^*}, \end{equation}
respectively, in which  $Pe_f$ and
 $ {\textit {Pe}}_s$ are the ambient flow and motility Péclet numbers. The dimensionless form of (2.1) is then given by
 \begin{equation} \frac{\partial \varPsi}{\partial t}+\boldsymbol{\nabla}_{\boldsymbol{x}} \boldsymbol{\cdot} \left[ (Pe_f \boldsymbol{u}+Pe_s \boldsymbol{p}) \varPsi \right] + \mathcal{L}_p(\boldsymbol{x},t) \varPsi= {D}_T {\nabla}^2_x \varPsi, \end{equation}
where
 \begin{align} \mathcal{L}_p(\boldsymbol{x},t)\varPsi =\boldsymbol{\nabla}_{\boldsymbol{p}} \boldsymbol{\cdot} \left[ \left(\frac{Pe_f}{2} \boldsymbol{\varOmega} \wedge \boldsymbol{p}+Pe_f \alpha_0 \boldsymbol{p} \boldsymbol{\cdot} \boldsymbol{\mathsf{E}} \boldsymbol{\cdot} (\boldsymbol{\mathsf{I}} - \boldsymbol{pp}) + \beta \left[ \boldsymbol{k} - (\boldsymbol{k} \boldsymbol{\cdot} \boldsymbol{p})\boldsymbol{p} \right] \right) \varPsi \right]-{\nabla}^2_{\boldsymbol{p}} \varPsi. \end{align}
By the divergence theorem, the integration over  $\boldsymbol {p}$ space of the operator
 $\mathcal {L}_p(\boldsymbol {x},t)$ acting on any arbitrary continuously differentiable function
 $a(\boldsymbol {p})$ satisfies
 \begin{equation} \int_{S_p} \mathcal{L}_p(\boldsymbol{x},t) \, a(\boldsymbol{p}) \, {\rm d}^2 \boldsymbol{p}=0, \end{equation}
where  $S_p$ is the unit sphere, i.e. the
 $\boldsymbol {p}$ space subject to
 $\|\boldsymbol {p}\|=1$. We note that this is used as a solvability condition for inversion of the operator later (see (3.6)). Physically, it is related to the conservation of probability in
 $\boldsymbol {p}$ space. We also note that (2.7) may be modified to account for other taxes by including the relevant modelling terms, e.g. the run-and-tumble dynamics and chemotaxis (Subramanian & Koch Reference Subramanian and Koch2009) or phototaxis (Williams & Bees Reference Williams and Bees2011). Therefore, we expect that many deterministic models for the orientation dynamics in
 $\boldsymbol {p}$ space would be given as a linear operator
 $\mathcal {L}_p(\boldsymbol {x},t)$ that satisfies (2.8). In the following sections, we use the linear operator
 $\mathcal {L}_p(\boldsymbol {x},t)$ to represent the orientation dynamics in
 $\boldsymbol {p}$ space to maintain this level of abstraction in the orientation dynamics.
2.2. Comparison with the GTD theory
The GTD theory was originally derived by Brenner (Reference Brenner1980) as a generalisation of the seminal work by Aris & Taylor (Reference Aris and Taylor1956) on the axial dispersion of cross-sectional mean solute concentration in a flowing pipe. The same framework was later extended by Frankel & Brenner (Reference Frankel and Brenner1989, Reference Frankel and Brenner1991, Reference Frankel and Brenner1993) to homogeneous shear flow and more kinds of colloids. This framework approximates the underlying high-dimensional microscopic transport equation, such as (2.1), with a lower-dimensional macroscopic transport equation, such as an effective advection–diffusion equation for the active particles. The key step in the GTD theory is in the identification of the local and global variables, in which the macroscopic transport equation only spans the global space while the local space and its interaction with the global space are approximated through the Aris method of moments in the global space in a long-time limit.
However, the GTD theory was developed under the notion that at the macroscopic scale, there is a homogeneity in the global space when the transport properties by local flow are averaged out. Hence, the theory only seeks constant macrotransport coefficients in the global space. By comparison, this work aims to relax the requirement of constant transport coefficients in the physical space  $\boldsymbol {x}$. Instead, we seek drift and dispersion coefficients that can be written as a function of the local flow field, which may not be homogeneous in
 $\boldsymbol {x}$. Although both theories would yield some form of a transport equation for the ABPs in a dilute suspension, the scope of this work is different from that of the GTD theory. By providing spatially varying transport coefficients, the transport model from the present method is applicable to any scales at which the flow may be inhomogeneous, while the GTD theory only gives effective transport properties (or coefficients) at macroscopic scale after coarse-graining the transport by local flows at smaller scales. Moreover, by approximating the transport coefficients as a function of the local flow field (i.e. the local spatial derivatives of the flow velocity), the present approach offers a universal model independent of the global flow configuration for given ABPs. Therefore, the model derived from this work is applicable to any continuous flow fields. This is in contrast to the GTD theory, where the coefficients of macroscopic transport equation have to be re-derived whenever the flow configuration changes (e.g. Jiang & Chen Reference Jiang and Chen2019).
3. Exact transformation into a transport equation
The purpose of this work is to obtain a new transport model for biased or non-biased ABPs in a suspension only using the local flow information. In particular, the transport properties (drift and dispersion coefficients) are given at each position of  $\boldsymbol {x}$, unlike in previous work such as Jiang & Chen (Reference Jiang and Chen2019, Reference Jiang and Chen2020) and Peng & Brady (Reference Peng and Brady2020). We start by seeking an exact mathematical transformation of (2.6) into a transport equation that may well be subjected to a complex flow field. The resulting equation will remain exact, but dependent on the exact probability density function
 $\varPsi (\boldsymbol {x},\boldsymbol {p},t)$ in both orientational and spatial spaces. Then, based on the same transformation, in § 4 we further approximate the transport equation, so that the orientational distribution can be obtained using only the local flow information given at the spatial location
 $\boldsymbol {x}$.
We define  $n(\boldsymbol {x},t)$ and
 $f(\boldsymbol {x},\boldsymbol {p},t)$ as
 $\varPsi (\boldsymbol {x},\boldsymbol {p},t)= n(\boldsymbol {x},t)f(\boldsymbol {x},\boldsymbol {p},t)$, so that
 $f(\boldsymbol {x},\boldsymbol {p},t)$ at each
 $\boldsymbol {x}$ becomes the probability density function in
 $\boldsymbol {p}$ space satisfying
 $\int _{S_p} f(\boldsymbol {p}) \,{\rm d}^2 \boldsymbol {p}=1$. Now, from (2.8), integration of (2.6) over
 $\boldsymbol {p}$ space gives the following equation in the
 $(\boldsymbol {x},t)$ space:
 \begin{equation} \partial_t n(\boldsymbol{x},t)+ \boldsymbol{\nabla}_{\boldsymbol{x}} \boldsymbol{\cdot} [ (Pe_s \langle \boldsymbol{p} \rangle_f(\boldsymbol{x},t) + Pe_f \boldsymbol{u}(\boldsymbol{x},t)) n(\boldsymbol{x},t)] = {D}_T {\nabla}^2_x n(\boldsymbol{x},t), \end{equation}
where
 \begin{equation} \langle \boldsymbol{p} \rangle_f(\boldsymbol{x},t) \equiv \int_{S_p} \boldsymbol{p} f(\boldsymbol{x},\boldsymbol{p},t) \,{\rm d}^2 \boldsymbol{p}. \end{equation}
Here, we are effectively taking the zeroth-order moment of the Smoluchowski equation. Although (3.1) appears as a standard advection–diffusion equation, it is not solvable in the absence of the full information of  $\varPsi (\boldsymbol {x},\boldsymbol {p},t)$ because
 $\langle \boldsymbol {p} \rangle _f(\boldsymbol {x},t)$ is still unknown. The term
 $\langle \boldsymbol {p} \rangle _f(\boldsymbol {x},t)$ can be interpreted as the normalised polar-order parameter. Its time evolution can be obtained by taking the first-order moment of (2.6). However, the equation again involves the second-order moment (or the nematic-order parameter) of the probability density function, which requires a closure model for the problem to be solved (Saintillan & Shelley Reference Saintillan and Shelley2015). This is a general limitation in this type of approach (the tensor-harmonic expansion).
Instead of utilising the equations for higher-order moments, here we take a different approach based on an exact transformation of (2.6) into a different form of transport equation. In the following, we transform the Smoluchowski equation by taking the inverse of operator  $\mathcal {L}_p$. However, in order to ensure each term in the equation satisfies the solvability condition in (2.8), we must first multiply (3.1) by
 $f(\boldsymbol {x},\boldsymbol {p},t)$ and subtract it from the Smoluchowski equation (2.6), which gives
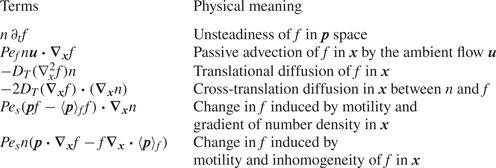
 \begin{align} &n \, \partial_t f + (Pe_f \boldsymbol{u} \boldsymbol{\cdot} \boldsymbol{\nabla}_{\boldsymbol{x}} f - {D}_T \nabla_x^2 f) n - 2 {D}_T (\boldsymbol{\nabla}_{\boldsymbol{x}} f) \boldsymbol{\cdot} (\boldsymbol{\nabla}_{\boldsymbol{x}} n) \nonumber\\ &\quad + Pe_s (\boldsymbol{p}f - \langle \boldsymbol{p} \rangle_f f) \boldsymbol{\cdot} \boldsymbol{\nabla}_{\boldsymbol{x}} n +Pe_s n (\boldsymbol{p}\boldsymbol{\cdot} \boldsymbol{\nabla}_{\boldsymbol{x}} f - f \boldsymbol{\nabla}_{\boldsymbol{x}}\boldsymbol{\cdot} \langle \boldsymbol{p} \rangle_f) \nonumber\\ &\quad + n \mathcal{L}_p(\boldsymbol{x},t) f =0. \end{align}
Now, each term in (3.3) satisfies the solvability condition (2.8), and may be interpreted physically as described in table 1. Note that (3.3) is the real-space equivalent of (13) in Peng & Brady (Reference Peng and Brady2020) before they applied the small-wavenumber approximation. Up to this point, the Fourier-based method of Peng & Brady (Reference Peng and Brady2020) is somewhat similar to the transformation in this study. However, the two methods diverge from this point onwards.
Physical meaning of each term in (3.3).

Next, we introduce a new set of variables  $f_\star$ and
 $\boldsymbol {b}_\star$, with
 $(\cdot )_\star$ indicating any subscript below, by the following set of linear equations:
 $$\begin{gather} \mathcal{L}_p(\boldsymbol{x},t) f_u(\boldsymbol{x},\boldsymbol{p},t) = Pe_f \boldsymbol{u} \boldsymbol{\cdot} \boldsymbol{\nabla}_{\boldsymbol{x}} f, \end{gather}$$
 $$\begin{gather}\mathcal{L}_p(\boldsymbol{x},t) f_{D_T}(\boldsymbol{x},\boldsymbol{p},t) ={-} {D}_T \nabla_x^2 f, \end{gather}$$
 $$\begin{gather}\mathcal{L}_p(\boldsymbol{x},t) \boldsymbol{b}_{D_T}(\boldsymbol{x},\boldsymbol{p},t) ={-} 2 {D}_T \boldsymbol{\nabla}_{\boldsymbol{x}} f, \end{gather}$$
 $$\begin{gather}\mathcal{L}_p(\boldsymbol{x},t) \boldsymbol{b}_c(\boldsymbol{x},\boldsymbol{p},t) = {\textit{Pe}}_s(\boldsymbol{p} - \langle \boldsymbol{p} \rangle_f) f, \end{gather}$$
 $$\begin{gather}\mathcal{L}_p(\boldsymbol{x},t) f_c(\boldsymbol{x},\boldsymbol{p},t) = {\textit{Pe}}_s ( \boldsymbol{p} \boldsymbol{\cdot} \boldsymbol{\nabla}_{\boldsymbol{x}} f - f \boldsymbol{\nabla}_{\boldsymbol{x}} \boldsymbol{\cdot} \langle \boldsymbol{p} \rangle_f), \end{gather}$$
 $$\begin{gather}\mathcal{L}_p(\boldsymbol{x},t) f_{\partial t}(\boldsymbol{x},\boldsymbol{p},t) = \partial_t f . \end{gather}$$
Each new variable  $f_\star$ and
 $\boldsymbol {b}_\star$ corresponds to a term in (3.3) or table 1. Note that the introduced variables are still functions of both
 $\boldsymbol {x}$ and
 $t$, because
 $\mathcal {L}_p$ can have coefficients varying in
 $\boldsymbol {x}$ and
 $f$ depends on both
 $\boldsymbol {x}$ and
 $t$. With the introduced variables, (3.3) can be rewritten as
 \begin{equation} \left[\mathcal{L}_p (\boldsymbol{b}_{D_T} + \boldsymbol{b}_c) \right] \boldsymbol{\cdot} \boldsymbol{\nabla}_{\boldsymbol{x}} n(\boldsymbol{x},t) + \left[\mathcal{L}_p (\,f_u+\,f_{D_T}+f_c+\,f_{\partial t} + f) \right] n(\boldsymbol{x},t) =0. \end{equation}
Now, we are ready to take the inverse of the operator  $\mathcal {L}_p$. This leads to
 \begin{equation} \left[\boldsymbol{b}_{D_T} + \boldsymbol{b}_c \right] \boldsymbol{\cdot} \boldsymbol{\nabla}_{\boldsymbol{x}} n(\boldsymbol{x},t) + \left[\,f_u+\,f_{D_T}+\,f_c+\,f_{\partial t} + f \right] n(\boldsymbol{x},t) =n(\boldsymbol{x},t) \, g, \end{equation}
where  $f_\star$ and
 $\boldsymbol {b}_\star$ are defined such that they are subject to the integral condition
 $\int _{S_p} f_\star \,{\rm d}^2 \boldsymbol {p}=0$ and
 $\int _{S_p} \boldsymbol {b}_\star \,{\rm d}^2 \boldsymbol {p}=\boldsymbol {0}$, while the homogeneous solution
 $g(\boldsymbol {x},t;\boldsymbol {p})$, defined by
 $$\begin{gather} \mathcal{L}_p(\boldsymbol{x},t) g(\boldsymbol{x},t;\boldsymbol{p}) = 0 \quad \mbox{subject to} \end{gather}$$
 $$\begin{gather}\int_{S_p} g(\boldsymbol{x},t;\boldsymbol{p}) \,{\rm d}^2 \boldsymbol{p} = 1, \end{gather}$$
is added to the equation after being multiplied by  $n(\boldsymbol {x},t)$. The multiplication factor
 $n(\boldsymbol {x},t)$ can be obtained by integrating (3.6) over
 $\boldsymbol {p}$ space.
Multiplying  $\boldsymbol {p}$ by (3.6) and integrating in
 $\boldsymbol {p}$ space then yields
 \begin{equation} (\boldsymbol{\mathsf{D}}_{D_T}+ \boldsymbol{\mathsf{D}}_c) \boldsymbol{\cdot} \boldsymbol{\nabla}_{\boldsymbol{x}} n + \left[ \boldsymbol{V}_{u}+ \boldsymbol{V}_{D_T}+\boldsymbol{V}_c + \boldsymbol{V}_{\partial t} + \langle \boldsymbol{p} \rangle_{f} \right] n =n \langle \boldsymbol{p} \rangle_{g}, \end{equation}
where
 $$\begin{gather} \langle \boldsymbol{p} \rangle_g(\boldsymbol{x},t) \equiv \int_{S_p} \boldsymbol{p} g(\boldsymbol{x},t;\boldsymbol{p}) \,{\rm d}^2 \boldsymbol{p}, \end{gather}$$
 $$\begin{gather}\boldsymbol{V}_{{\star}}(\boldsymbol{x},t) = \int_{S_p} \boldsymbol{p} f_{{\star}}(\boldsymbol{x},\boldsymbol{p},t) \,{\rm d}^2 \boldsymbol{p}, \end{gather}$$
 $$\begin{gather}\boldsymbol{\mathsf{D}}_{{\star}} (\boldsymbol{x},t) = \int_{S_p} \boldsymbol{p} \boldsymbol{b}_{{\star}}(\boldsymbol{x},\boldsymbol{p},t) \,{\rm d}^2 \boldsymbol{p}, \end{gather}$$
with  $(\cdot )_\star$ indicating any of the subscripts used in (3.4). Here, this step is equivalent to expressing
 $n \langle \boldsymbol {p} \rangle _g$ in terms of
 $n \langle \boldsymbol {p} \rangle _f$ and the other related terms, in which
 $n \langle \boldsymbol {p} \rangle _g$ and
 $n \langle \boldsymbol {p} \rangle _f$ may be interpreted as the first-order Lagrangian and Eulerian moments, respectively (see § 6 for a further discussion of their physical interpretations). However, it should be distinguished from the one with the typical tensor-harmonic expansion (e.g. Saintillan & Shelley Reference Saintillan and Shelley2015), in which the Smoluchowski equation (2.6) was used to derive the time-evolving equation for the polar or nematic order. Indeed, in such an approach, the equation for each moment has a closure problem, as it requires the information involving higher-order moments. On the contrary, an equation such as (3.6) only defines the relation between
 $n \langle \boldsymbol {p} \rangle _g$ and
 $n \langle \boldsymbol {p} \rangle _f$, and it is not a time-evolution equation that can be solved only with the information from higher-order moments.
Replacing  $n \langle \boldsymbol {p} \rangle _{f}$ in (3.1) with that of (3.8) leads to the following transport equation:
 \begin{align} & \partial_t n+ \boldsymbol{\nabla}_{\boldsymbol{x}} \boldsymbol{\cdot} \left[ ( {\textit{Pe}}_f \boldsymbol{u} + {\textit{Pe}}_s (\langle \boldsymbol{p} \rangle_{g}-\boldsymbol{V}_u-\boldsymbol{V}_{D_T}- \boldsymbol{V}_{c} -\boldsymbol{V}_{\partial t} ) ) n \right] \nonumber\\ & \quad = D_T \nabla_x^2 n + {\textit{Pe}}_s \boldsymbol{\nabla}_{\boldsymbol{x}} \boldsymbol{\cdot} (\boldsymbol{\mathsf{D}}_{D_T}+ \boldsymbol{\mathsf{D}}_c) \boldsymbol{\cdot} \boldsymbol{\nabla}_{\boldsymbol{x}} n. \end{align}
This is an exact transport equation directly obtained from (2.6) without making any approximations. Here, we note that previous studies, including the FP model (Pedley & Kessler Reference Pedley and Kessler1990), the GTD model (Hill & Bees Reference Hill and Bees2002; Manela & Frankel Reference Manela and Frankel2003) and the Fourier method for ABPs (Takatori & Brady Reference Takatori and Brady2017; Peng & Brady Reference Peng and Brady2020), used  $\langle \boldsymbol {p} \rangle _g$ to describe the average drift from the particle motility. However, it is now seen that the average motility of individual particles
 $\langle \boldsymbol {p} \rangle _g$ does not necessarily constitute all the drifts (a further discussion of this issue follows in § 6).
Lastly, it should be mentioned that (3.12) is not the only transport equation one can obtain from (2.6) – indeed, we have already retrieved a different form of transport equation from (2.6), that is, (3.1). This is essentially the consequence of reducing the dimensions of the given system (2.6) from the  $(\boldsymbol {x},\boldsymbol {p})$ space to just
 $\boldsymbol {x}$ space. However, expression (3.6) directly derived from (2.6) enables us to decompose
 $\langle \boldsymbol {p} \rangle _f$ in (3.1) into the averaged motility of individual particles
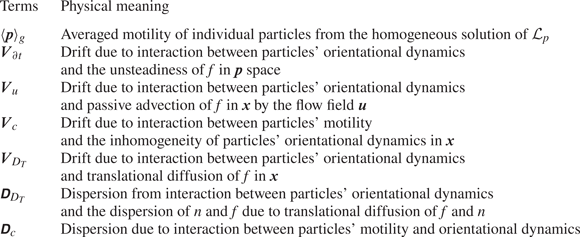
 $\langle \boldsymbol {p}\rangle _g$ and the other terms from (2.6) in a mathematically exact manner. Hence, each term in (3.12) would admit a physical interpretation, as listed in table 2. Finally, it is important to note that
 $\boldsymbol{\mathsf{D}}_{D_T}$ and
 $\boldsymbol{\mathsf{D}}_c$ in (3.12) do not necessarily describe a diffusion process, as they are not guaranteed to be either symmetric or positive definite. Therefore, one should be careful in understanding and interpreting their actual roles, and, in this sense, (3.12) may not precisely be referred to as an advection–diffusion equation.
Physical meaning of each derived term in (3.12).

4. Local approximation of the transformed transport equation
While the transport equation in (3.12) is obtained without applying any approximation to (2.6), the formulae for  $\boldsymbol {V}_\star$ and
 $\boldsymbol{\mathsf{D}}_\star$ given in (3.4) are based on
 $f=\varPsi /n$, requiring the full knowledge of
 $\varPsi$ (i.e. the solution to (2.6)). Therefore, the transformation discussed in § 3 does not alleviate the difficulty related to the computational cost of the full Smoluchowski equation (2.6). To resolve this issue, in this section, we combine the transformation technique leading to (3.8) with a multiple-time-scale asymptotic analysis. This results in an approximated form of (3.12) utilising only the local flow information (i.e. a local approximation).
First, we assume  $ {\textit {Pe}}_s (\equiv \epsilon ) \ll 1$,
 $ {\textit {Pe}}_f \lesssim O(\epsilon )$ and
 $D_T \lesssim O(\epsilon )$, and define
 $\widetilde { {\textit {Pe}}}_f= {\textit {Pe}}_f / \epsilon$ and
 $\tilde {D}_T=D_T / \epsilon$. Physically, these assumptions imply that the time scale in the orientational
 $\boldsymbol {p}$ space is much faster than that in
 $\boldsymbol {x}$ space (i.e. a quasi-steady assumption). They would be valid for most of the phenomena of interest such as gyrotactic focusing and bioconvection, where the time scale for swimmers to swim across the container width or characteristic flow length
 $h^*/V_c^*$ is longer than the orientation time scale
 $1/d_r^*$, and the flow speed is comparable to the swimming speed from
 $ {\textit {Pe}}_s \sim {\textit {Pe}}_f \sim O(\epsilon )$. An alternative but equivalent interpretation of the assumptions is that the run length of the ABPs,
 $V_h^*/d_r^*$, is much smaller than the characteristic flow length. Under these assumptions, the orientational component of
 $\varPsi$ (i.e.
 $f(\boldsymbol {x},\boldsymbol {p},t)$) will first relax to a quasi-equilibrium in
 $\boldsymbol {p}$ space while the
 $\boldsymbol {x}$ dependency of
 $\varPsi$ is still evolving slowly. This then enables us to introduce a slowly varying time scale
 $T=\epsilon t$ for the dynamics of
 $\varPsi$ in
 $\boldsymbol {x}$ space. The standard multiple-scale asymptotic analysis is subsequently applied by expanding
 $\varPsi =\varPsi ^{(0)}(t,T,\boldsymbol {x},\boldsymbol {e})+ \epsilon \varPsi ^{(1)}(t,T,\boldsymbol {x},\boldsymbol {e}) + \epsilon ^2 \varPsi ^{(2)}(t,T,\boldsymbol {x},\boldsymbol {e})+O(\epsilon ^3)$. Following a transformation similar to that in § 3 and retaining the terms up to
 $O(\epsilon ^2)$ (see Appendix A for further details), we derive an approximated transport equation given by
 \begin{align} &\partial_t n + \boldsymbol{\nabla}_{\boldsymbol{x}} \boldsymbol{\cdot} \left[ {\textit{Pe}}_s \left(\langle \boldsymbol{p} \rangle_{g}+\widetilde{ {\textit{Pe}}}_f \boldsymbol{u} \right) n- {\textit{Pe}}_s^2 \left(\boldsymbol{V}_{g,u}+\boldsymbol{V}_{g,D_T}+\boldsymbol{V}_{g,c}+\boldsymbol{V}_{g,\partial T} \right) n \right] \nonumber\\ &\quad \approx {\textit{Pe}}_s \tilde{D}_T {\nabla}^2_x n + {\textit{Pe}}_s^2 \boldsymbol{\nabla}_{\boldsymbol{x}} \boldsymbol{\cdot} \left[ (\boldsymbol{\mathsf{D}}_{g,c}+\boldsymbol{\mathsf{D}}_{g,D_T}) \boldsymbol{\cdot} \boldsymbol{\nabla}_{\boldsymbol{x}} n \right] \end{align}
for the transport of  $n(\boldsymbol {x},t)$, where the drifts and dispersion coefficients are defined by (3.10)–(3.11) with
 $$\begin{gather} \mathcal{L}_p(\boldsymbol{x},T) f_{g,u}(\boldsymbol{x},T;\boldsymbol{p}) = \widetilde{ {\textit{Pe}}}_f \boldsymbol{u} \boldsymbol{\cdot} \boldsymbol{\nabla}_{\boldsymbol{x}} g, \end{gather}$$
 $$\begin{gather}\mathcal{L}_p(\boldsymbol{x},T) f_{g,D_T}(\boldsymbol{x},T;\boldsymbol{p}) ={-} \tilde{D}_T \nabla_x^2 g, \end{gather}$$
 $$\begin{gather}\mathcal{L}_p(\boldsymbol{x},T) \boldsymbol{b}_{g,D_T}(\boldsymbol{x},T;\boldsymbol{p}) ={-} 2 \tilde{D}_T \boldsymbol{\nabla}_{\boldsymbol{x}} g, \end{gather}$$
 $$\begin{gather}\mathcal{L}_p(\boldsymbol{x},T) \boldsymbol{b}_{g,c}(\boldsymbol{x},T;\boldsymbol{p}) = (\boldsymbol{p} - \langle \boldsymbol{p} \rangle_g) g, \end{gather}$$
 $$\begin{gather}\mathcal{L}_p(\boldsymbol{x},T) f_{g,c}(\boldsymbol{x},T;\boldsymbol{p}) = ( \boldsymbol{p} \boldsymbol{\cdot} \boldsymbol{\nabla}_{\boldsymbol{x}} g - g \boldsymbol{\nabla}_{\boldsymbol{x}} \boldsymbol{\cdot} \langle \boldsymbol{p} \rangle_g). \end{gather}$$
 $$\begin{gather}\mathcal{L}_p(\boldsymbol{x},T) f_{g,\partial T}(\boldsymbol{x},T;\boldsymbol{p}) = \partial_T g, \end{gather}$$
where all  $f_{g,\star }$ and
 $\boldsymbol {b}_{g,\star }$ are subjected to the integral condition
 $\int _{S_p} \,{\rm d}^2 \boldsymbol {p}=0$. The approximated transport equation (4.1) is identical to (3.12), except that their coefficients in (4.2) are now obtained by replacing
 $f$ in (3.4) with
 $g$ in (3.7). This is a crucial advantage of (4.1) over (3.12) because
 $g$ in (3.7) can be solved pointwise at each
 $\boldsymbol {x}$ if the local flow information (i.e.
 $\boldsymbol {\varOmega }$ and
 $\boldsymbol{\mathsf{E}}$) is known. This is effectively a ‘local’ approximation of
 $f$ using
 $g$, in which (4.1) no longer requires the full solution to (2.6).
Here, the derivation above is similar to that of Bearon & Hazel (Reference Bearon and Hazel2015) and Vennamneni et al. (Reference Vennamneni, Nambiar and Subramanian2020). However, in deriving (4.1), we have assumed  $T=\epsilon t$. This time-scale separation is different from
 $T= \epsilon ^2 t$ of Bearon & Hazel (Reference Bearon and Hazel2015) and Vennamneni et al. (Reference Vennamneni, Nambiar and Subramanian2020). We note that the
 $\boldsymbol {V}_{g,\star }$ and
 $\boldsymbol{\mathsf{D}}_{g,\star }$ terms in (4.1) scale with
 $ {\textit {Pe}}_s^2$, while the rest of the equation scales with
 $ {\textit {Pe}}_s$. Therefore, the effect of these terms appears only at
 $O(\epsilon ^2)$, while the rest of the terms are still non-zero at
 $O(\epsilon )$. This contrasts with the ABP suspensions considered in Bearon & Hazel (Reference Bearon and Hazel2015) and Vennamneni et al. (Reference Vennamneni, Nambiar and Subramanian2020). In their cases, the translational diffusion was negligible (
 $D_T=0$), the averaged orientation of individual particles was not biased (
 $\langle \boldsymbol {p} \rangle _g=\boldsymbol {0}$) and the flow was parallel such that
 $\boldsymbol {u} \boldsymbol {\cdot } \boldsymbol {\nabla }_{\boldsymbol {x}}=0$. Hence, if
 $T=\epsilon t$ was assumed, the equation at
 $O(\epsilon )$ would simply be degenerate. However, in general, there is no reason that the leading-order equation has to have such a trivial solution especially in the presence of taxes, translational diffusion or a non-parallel flow field. Therefore, these leading-order effects require us to retain the scaling
 $T=\epsilon t$.
5. Flow examples
Now, we test the accuracy of the local approximation model proposed in § 4. To this end, we numerically solve the transport equation for the number density from the local approximation model and compare it with the full solution to the Smoluchowski equation (2.6). In §§ 5.2 and 5.3, we consider the suspension of bottom-heavy motile (i.e. gyrotactic) microorganisms in a one-dimensional parallel shear flow, where the number density is assumed to be uniform in the streamwise direction. This example was also considered in the recent work based on the GTD theory of Jiang & Chen (Reference Jiang and Chen2019, Reference Jiang and Chen2020) and the Fourier method in Peng & Brady (Reference Peng and Brady2020). However, it is important to mention that the scope of the local approximation model in this study is different from theirs. In their work, the cross-stream direction and the orientation were solved simultaneously, while they seek a global effective drift and dispersion of a number density that were averaged in the cross-stream direction. By contrast, the local approximation model in the present study solves the orientational space separately from the cross-streamwise direction, and the effective drifts and dispersions are defined at every cross-streamwise location from the exact transformation. It is therefore expected that the results from Jiang & Chen (Reference Jiang and Chen2019, Reference Jiang and Chen2020) and Peng & Brady (Reference Peng and Brady2020) must have a better accuracy than those from our local approximation model, as their approach is equivalent to computing the full solution of the Smoluchowski equation on the cross-streamwise plane. In essence, they are working on a coarse-graining level different from ours, and their approaches are computationally more costly.
Finally, in § 5.4, we consider a two-dimensional Taylor–Green-type vortical flow in a periodic box. Since the flow is complex and inhomogeneous, the advantage of the local approximation will be demonstrated as it provides a good prediction for the steady number density without directly solving the Smoluchowski equation.
5.1. Numerical method
Our numerical method is loosely based on the Spherefun package (Townsend, Wilber & Wright Reference Townsend, Wilber and Wright2016), which utilises the double Fourier sphere method to represent the spherical space  $\boldsymbol {p}$. The method transforms the longitude and latitude coordinates
 $(\phi,\theta ) \in [-{\rm \pi},{\rm \pi} ] \times [0,{\rm \pi} ]$ into two independent Fourier space variables. Here, we follow the definition of Townsend et al. (Reference Townsend, Wilber and Wright2016, p. C405) and define
 $\phi$ and
 $\theta$ such that each component of
 $\boldsymbol {p}=[p_x,p_y,p_z]^{\rm T}$ can be written as
 \begin{equation} p_x=\cos{\phi}\sin{\theta}, \quad p_y=\sin{\phi}\sin{\theta}, \quad p_z=\cos{\theta}. \end{equation}
Periodicity in the spherical space was maintained by enforcing the reflectional symmetry in its transformed coefficients (see Townsend et al. Reference Townsend, Wilber and Wright2016, p. C406). The  $\boldsymbol {\nabla }_{\boldsymbol {p}} \boldsymbol {\cdot } [ \dot {\boldsymbol {p}} \varPsi ]$ operation and the
 $\boldsymbol {p}$-dependent part of the
 $\boldsymbol {\nabla }_{\boldsymbol {x}} \boldsymbol {\cdot } [ \dot {\boldsymbol {x}} \varPsi ]$ operation in (2.6) were completely implemented in the spectral space. Meanwhile, based on the parallel assumption in the physical space
 $\boldsymbol {x}$, we have discretised the cross-stream direction (
 $x$ or
 $z$, depending on the prescribed flow field) by a sixth-order central difference scheme with an equispaced grid. Time integration was conducted semi-implicitly, in which the
 $\nabla ^2_{\boldsymbol {p}}$ term was advanced with the second-order Crank–Nicolson method while the rest are marched with a third-order low-storage Runge–Kutta method. The matrix inversion arising in the Crank–Nicolson method was solved using the algorithm for the Helmholtz equation in the Spherefun package. For simplicity, we have implemented a periodic boundary condition in the cross-stream direction. The method was validated by comparing the
 $\boldsymbol {p}$-space results with the previous solver used in Hwang & Pedley (Reference Hwang and Pedley2014b) and with the analytical solution of the following example.
Since the numerical solution of the Smoluchowski equation is compared with the steady results from the local approximation model, we also computed the effective drifts and dispersions of the model (4.2) by directly inverting the linear  $\mathcal {L}_{\boldsymbol {p}}$ operator in the spectral space. The resulting effective drifts and dispersions are then used in the transport equation to solve for the steady solution of
 $n$ (see (5.2)–(5.3)). The method was also validated with the previous solver used to compute the drifts and diffusivity from the FP and GTD model (Fung et al. Reference Fung, Bearon and Hwang2020).
5.2. A suspension of gyrotactic active particles in a prescribed vertical flow
In this example, we revisit the classical problem of the formation of a gyrotactic plume by bottom-heavy motile microorganisms/particles (Kessler Reference Kessler1986; Hwang & Pedley Reference Hwang and Pedley2014a; Jiang & Chen Reference Jiang and Chen2020; Fung & Hwang Reference Fung and Hwang2020; Fung et al. Reference Fung, Bearon and Hwang2020). For simplicity, we do not take into account how the particles may influence the flow via buoyancy or hydrodynamic interactions. Instead, we apply a prescribed parallel shear flow to the suspension  $\boldsymbol {u}(\boldsymbol {x})=[0,0,W(x)]^{\rm T}$, in which
 $x$ is the horizontal direction and
 $z$ is the vertical direction pointing upwards (i.e. the same direction as
 $\boldsymbol {k}$).
Four types of idealised motile microorganisms are considered: a strongly gyrotactic and spherical particle ( $\beta =2.2, \alpha _0=0$), a strongly gyrotactic but non-spherical particle (
 $\beta =2.2, \alpha _0=0.31$), a weakly gyrotactic and non-spherical particle (
 $\beta =0.21, \alpha _0=0.31$) and a non-gyrotactic and non-spherical particle (
 $\beta =0, \alpha _0=0.31$). The parameters
 $\beta =2.2$ and
 $\alpha _0=0.31$ for the strongly gyrotactic particle are based on Chlamydomonas augustae (Pedley & Kessler Reference Pedley and Kessler1990; Croze, Ashraf & Bees Reference Croze, Ashraf and Bees2010), while the gyrotactic parameter
 $\beta =0.21$ for the weakly gyrotactic particle is based on Dunaliella salina (Croze et al. Reference Croze, Bearon and Bees2017). Since we cannot find any experimental value of
 $\alpha _0$ for D. salina, we assume the weakly gyrotactic particle shares the same value of
 $\alpha _0=0.31$ for comparisons. Lastly, we also consider a suspension of non-spherical and non-gyrotactic particles for completeness.
In §§ 5.2.1 and 5.2.2, we first assume that the gyrotactic particle undergoes no translational diffusion and that the dilute suspension is well described by (2.6) with  $D_T=0$. Later in § 5.2.3, we add translational diffusion (i.e. finite
 $D_T$) to the particles to show the extra drift and dispersion that may arise from it. Also, to avoid the additional complication that may arise due to the boundary conditions in the physical space (e.g. wall accumulation of Ezhilan & Saintillan (Reference Ezhilan and Saintillan2015)), we assume a periodicity of
 $2 h^*$ in the
 $x$ direction. Therefore, the shear flow profile
 $W(x)$ is periodic in
 $x \in [-1,1]$. For convenience, we also define the shear profile
 $S(x)=-( {\textit {Pe}}_f/2) \partial _x W(x)$, with
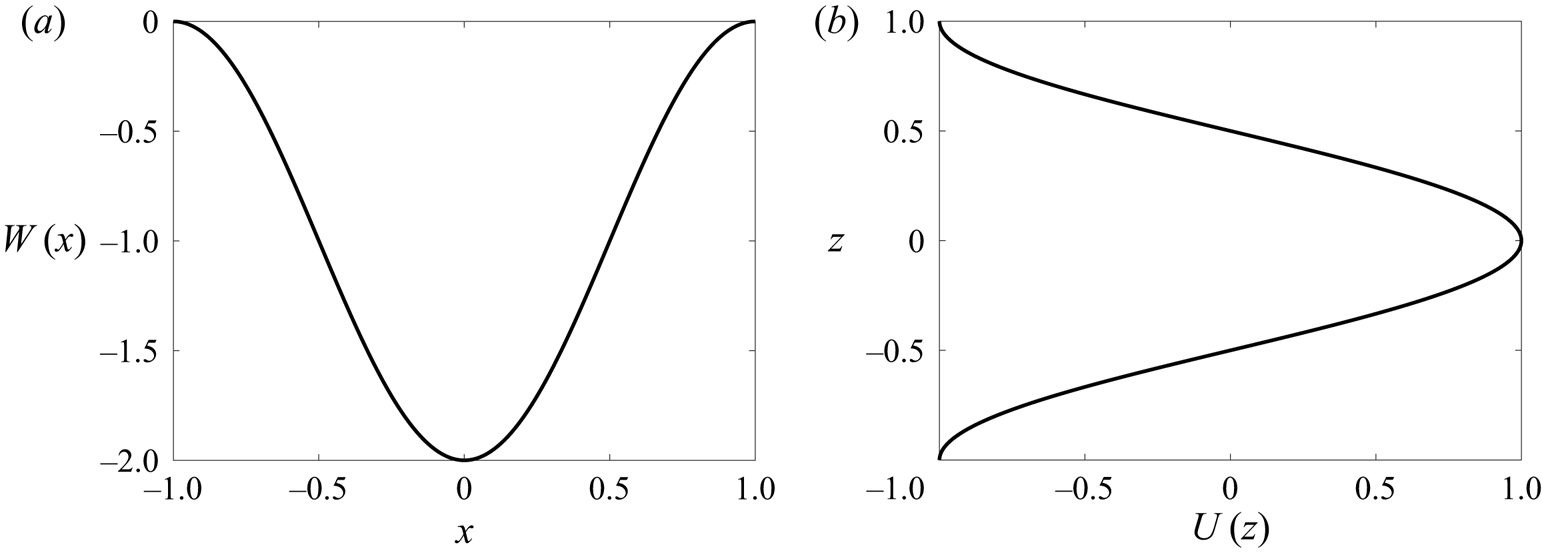
 $W(x)=-\cos ({\rm \pi} x)-1$. The flow profile is plotted in figure 1(a). The initial condition of the suspension is given to be uniform in both
 $(\boldsymbol {x},\boldsymbol {p})$ space.


5.2.1. Steady solution and shear trapping
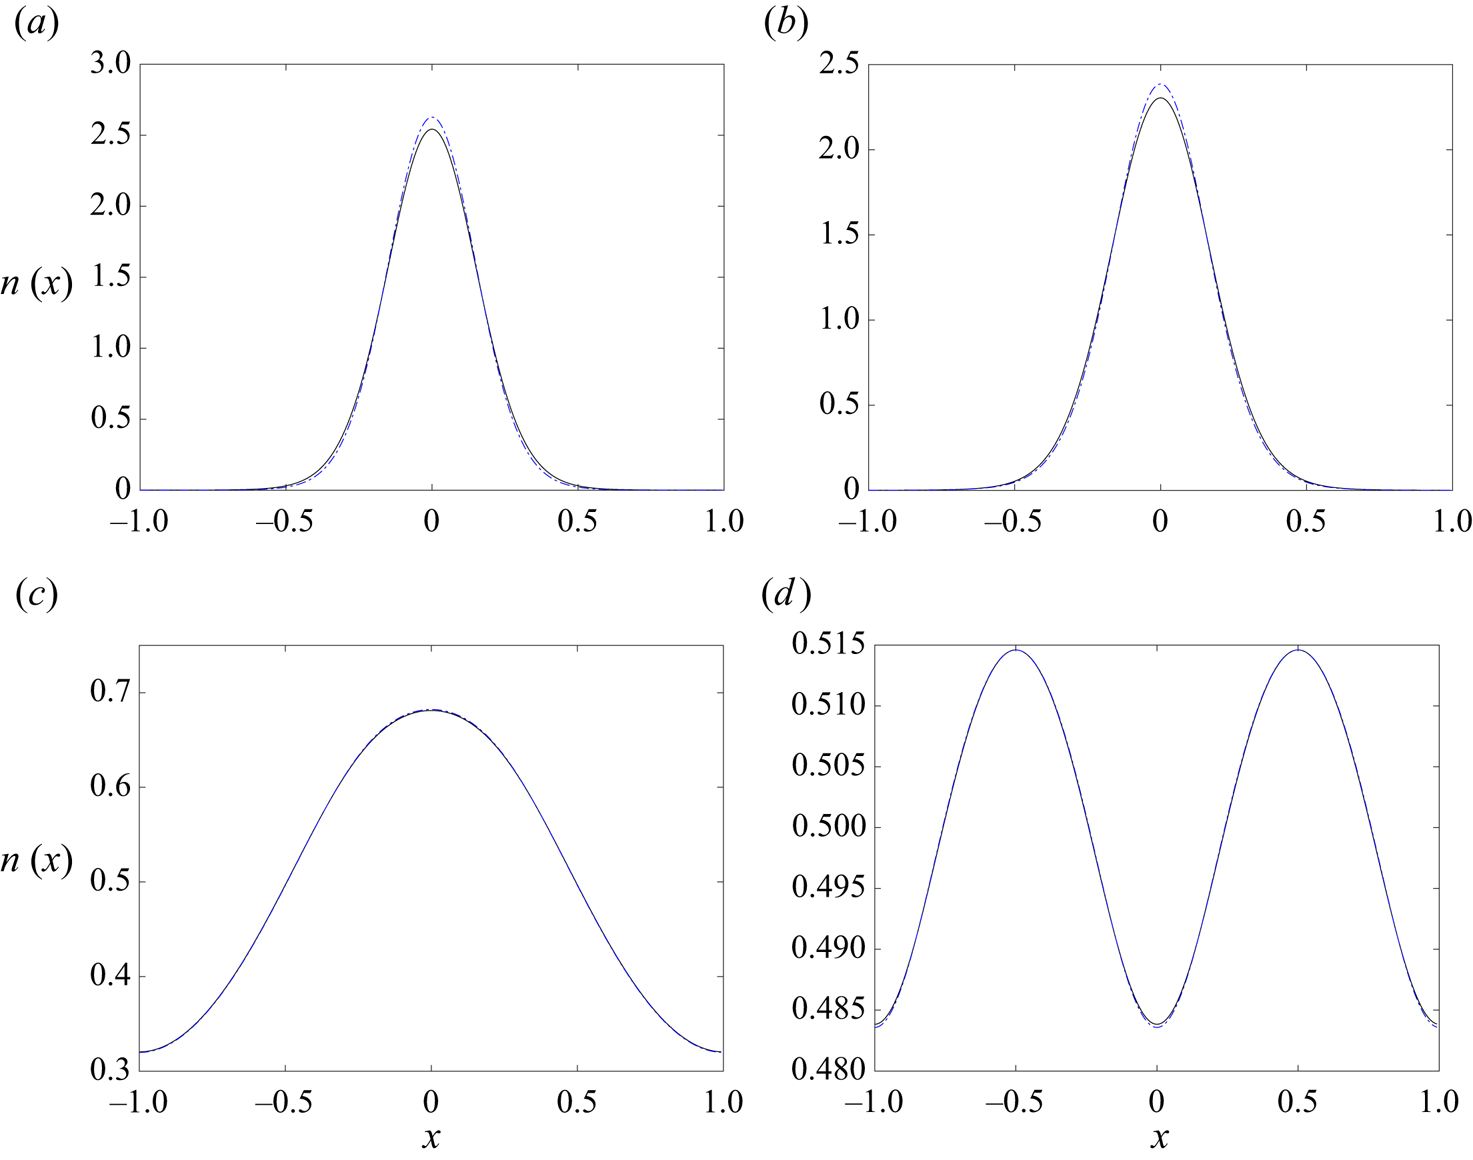
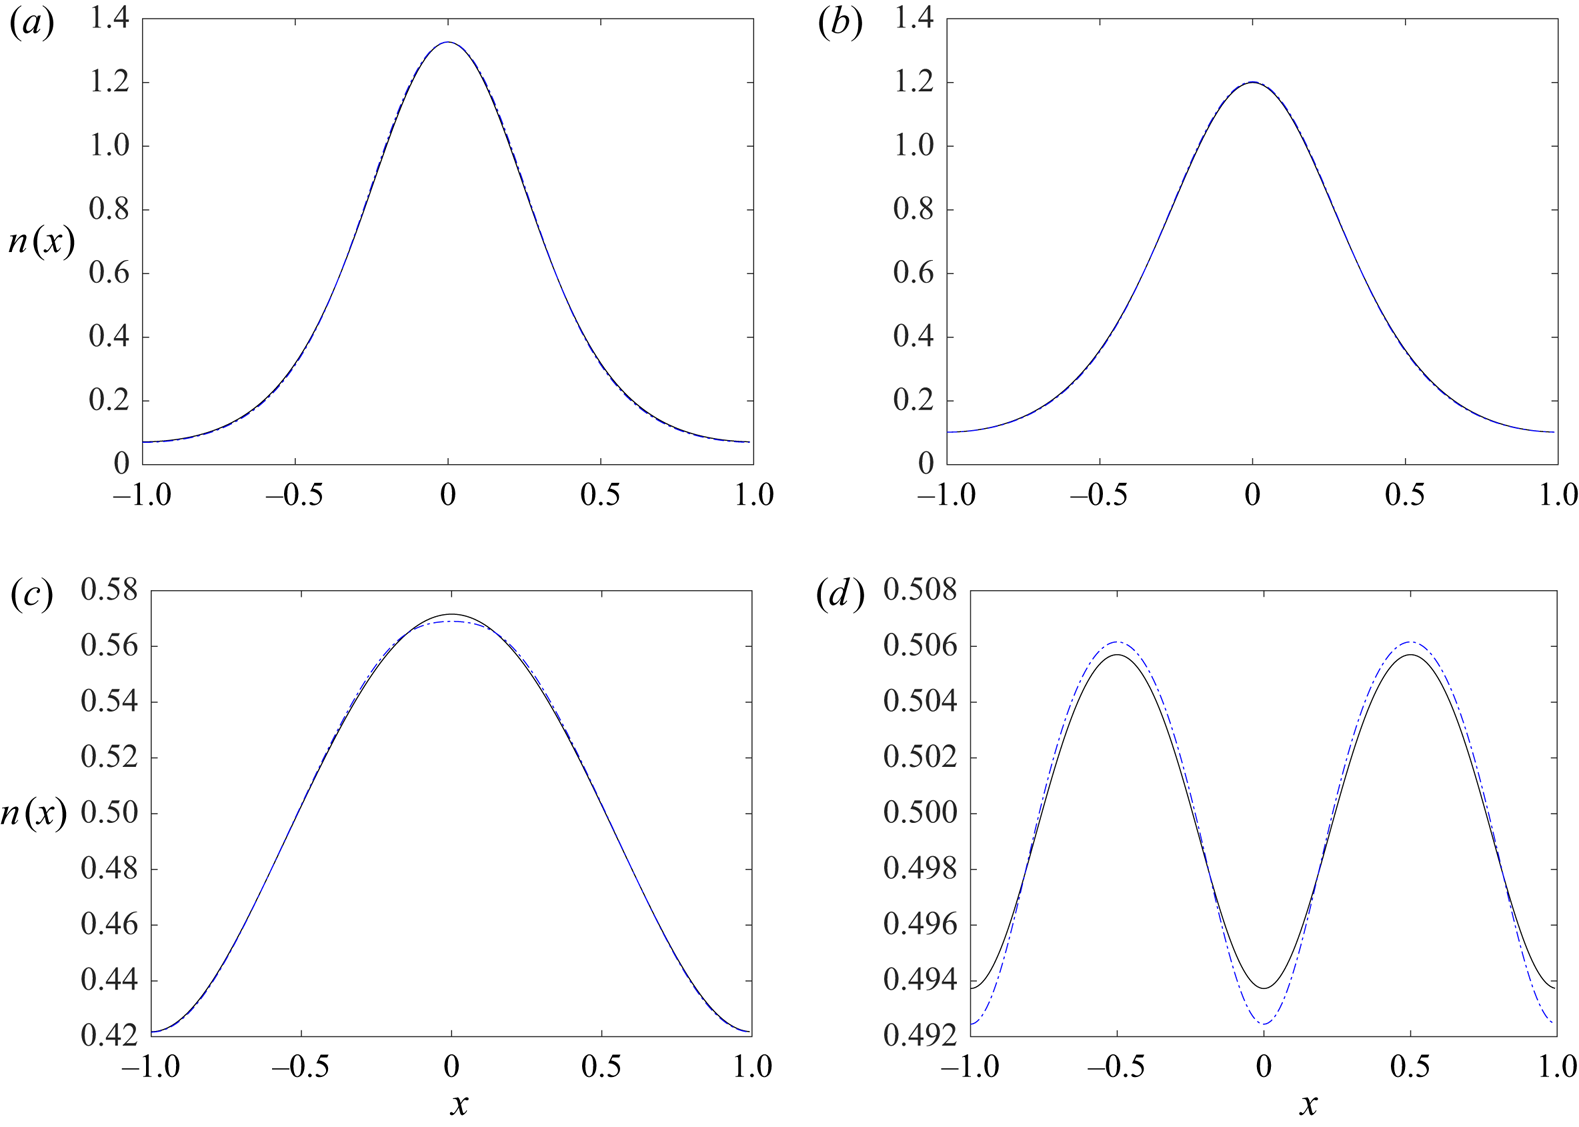
In this subsection, we first compare the converged steady state with the prediction from § 4. Figure 2 shows the number density at converged steady state  $n_{f,s}$ after the numerical integration of the Smoluchowski equation for the suspensions of the idealised particles. Here, a non-negligibly large
 $Pe_s$ (
 ${\equiv }0.25$) is deliberately chosen to highlight the deviation of the prediction by the local approximation model from the exact solution to the Smoluchowski equation. In the case of spherical gyrotactic particle suspension (figure 2a), an analytical solution (B1) has been found for the steady state of spherical gyrotactic particle suspension in a vertical flow (Appendix B). The numerical solution, in this case, agrees very well with the analytical solution. In figure 2, we have also plotted the steady-state number density given by the local approximation model in § 4 (
 $n_{g,s}$). For strongly gyrotactic particles (figure 2a,b), the model gives predictions close to the full solution. For weakly gyrotactic particles (figure 2c) and non-gyrotactic particles (figure 2d), the local approximation makes predictions almost identical to the exact result from the Smoluchowski equation. In spite of the small variation in
 $n(x)$ in the non-gyrotactic case (note the small scale variation of
 $n(x)$ in the ordinate of figure 2d), the shear trapping mechanism that causes such aggregation is the dominant effect in this case, and the aggregation can be observed in experiments (Rusconi, Guasto & Stocker Reference Rusconi, Guasto and Stocker2014). Here, we note that if the homogeneous approximation model of the GTD theory is applied here in the manner of Bearon et al. (Reference Bearon, Bees and Croze2012) and Croze et al. (Reference Croze, Bearon and Bees2017), it cannot predict the aggregation of particles due to shear trapping, resulting in a uniform distribution instead. However, if the
 $x$ direction is included as a local coordinate in the more rigorous application of GTD (Jiang & Chen Reference Jiang and Chen2019, Reference Jiang and Chen2020), the resulting number density will predict the shear trapping as it is equivalent to solving the full Smoluchowski equation in figure 2(d).
Comparison of the steady-state number density given by the direct integration of (2.6) (black solid line,  $n_{f,s}$) and the local approximation model of § 4 (blue dot-dashed line,
 $n_{g,s}$) of suspensions of (a) spherical and strongly gyrotactic (
 $\beta =2.2$,
 $\alpha _0=0$), (b) non-spherical and strongly gyrotactic (
 $\beta =2.2$,
 $\alpha _0=0.31$), (c) non-spherical and weakly gyrotactic (
 $\beta =0.21$,
 $\alpha _0=0.31$) and (d) non-spherical and non-gyrotactic (
 $\beta =0$,
 $\alpha _0=0.31$) particles. The suspensions are subjected to a vertical flow
 $W(x)=-\cos ({\rm \pi} x)-1$ with
 $ {\textit {Pe}}_s=0.25$ and
 $ {\textit {Pe}}_f=1$. Note that the vertical scale for
 $n(x)$ in (c,d) is much smaller than that in (a,b).

Now, we investigate the performance of the local approximation model in terms of the coefficients of the transport equation given by each model. For a suspension of gyrotactic particles with  $D_T=0$ in a prescribed parallel shear flow, the exact steady solution for the number density
 $n_{f,s}=n(x,\infty )$ is given from (3.12) by
 \begin{equation} \partial_x [( {\textit{Pe}}_s \langle p_{x} \rangle_g - {\textit{Pe}}_s {V}_{x,c}) n_{f,s}] = {\textit{Pe}}_s \partial_x [ {\mathsf{D}}_{xx,c} \partial_x n_{f,s} ]. \end{equation}
Similarly, the steady solution to the local approximation model in (4.1), denoted by  $n_{g,s}(x)$, is given by
 \begin{equation} \partial_x [( {\textit{Pe}}_s \langle p_{x} \rangle_g - {\textit{Pe}}_s^2 {V}_{x,g,c}) n_{g,s}] = {\textit{Pe}}_s^2 \partial_x [{\mathsf{D}}_{xx,g,c} \partial_x n_{g,s} ]. \end{equation}
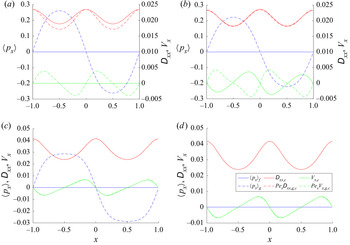
Figure 3 shows the  $x$ components of the effective drift and dispersion coefficients. First, we compare the effective dispersion from the local approximation with those from the exact transformation (see the right-hand side of (5.2)–(5.3)). In particular, when particles are spherical,
 ${\mathsf{D}}_{xx,c}$ can be directly extracted as a function of the local vertical shear rate
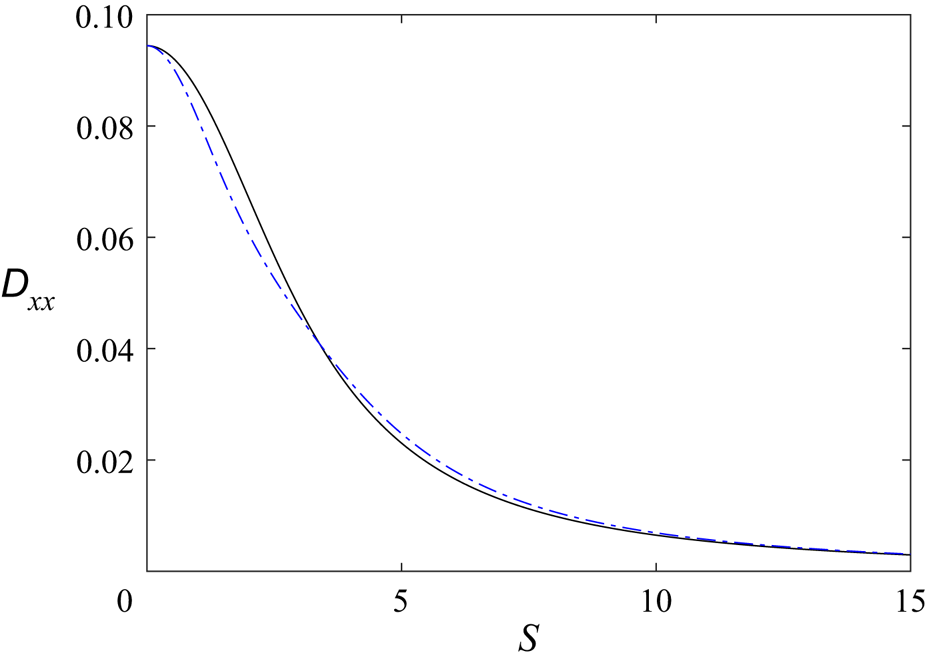
 $S$ using the analytic solution of (2.6) given in Appendix B. In figure 4,
 ${\mathsf{D}}_{xx,c}$ and
 ${\mathsf{D}}_{xx,g,c}$ are plotted as a function of the vertical shear rate
 $S$. It is found that
 $ {\textit {Pe}}_s {\mathsf{D}}_{xx,g,c}$ approximates
 ${\mathsf{D}}_{xx,c}$ quite well for all the range of
 $S$ considered. In general,
 $ {\textit {Pe}}_s {\mathsf{D}}_{xx,g,c}$ remains a good approximation for
 ${\mathsf{D}}_{xx,c}$ for all the four cases considered at all the horizontal locations
 $x$ (figure 3).
Comparison of the drifts and dispersion terms in (5.2)–(5.3), (5.5) at the steady state. The plots show the values of  $\langle p_{x} \rangle _f$ (blue, solid),
 $\langle p_{x} \rangle _g$ (blue, dashed),
 ${\mathsf{D}}_{xx,c}$ (red, solid),
 $ {\textit {Pe}}_s {\mathsf{D}}_{xx,g,c}$ (red, dashed),
 $V_{x,c}$ (green, solid) and
 $ {\textit {Pe}}_s V_{x,g,c}$ (green, dashed) in suspensions of (a) spherical and strongly gyrotactic (
 $\beta =2.2, \alpha _0=0$), (b) non-spherical and strongly gyrotactic (
 $\beta =2.2, \alpha _0=0.31$), (c) non-spherical and weakly gyrotactic (
 $\beta =0.21, \alpha _0=0.31$) and (d) non-spherical and non-gyrotactic (
 $\beta =0, \alpha _0=0.31$) particles. The suspensions are subjected to a vertical flow
 $W(x)=-\cos ({\rm \pi} x)-1$ with
 $ {\textit {Pe}}_s=0.25$ and
 $ {\textit {Pe}}_f=1$.

Comparison of the  $xx$ component of
 $\boldsymbol{\mathsf{D}}_c/ {\textit {Pe}}_s$ (black line) and
 $\boldsymbol{\mathsf{D}}_{g,c}$ (blue dot-dashed line) as a function of the local vertical shear
 $S(x)$ for spherical gyrotactic particles (
 $\beta =2.2,\alpha _0=0$), in which
 $\boldsymbol{\mathsf{D}}_c/ {\textit {Pe}}_s$ is computed from
 $f_s(\boldsymbol {p})$ of Appendix B.

As for the left-hand side of (5.2)–(5.3), the exact transformed equation and approximated model share the same  $\langle p_{x} \rangle _g$ term. However, as shown in figure 3,
 ${V}_{x,g,c}$ only follows
 ${V}_{x,c}$ closely in the weakly gyrotactic cases (figure 3c,d) but poorly in the strongly gyrotactic cases (figure 3a,b). Nevertheless, in the strongly gyrotactic cases, the left-hand sides of (5.2) and (5.3) are dominated by
 $\langle p_{x} \rangle _g$, so the poor estimation of
 ${V}_{x,c}$ does not strongly affect the overall performance of the local approximation model (figure 2c,d).
Given the observation in the weakly gyrotactic cases (figure 3c,d), the drift  $\boldsymbol {V}_{g,c}$ seems to be an important term in (4.1). Here, we further discuss the importance of this term from a physical perspective. The term
 $\boldsymbol {V}_{g,c}$ arises from the inhomogeneity of the local flow field (i.e. shear
 $S(x)$ in this example). Given its assumption, the quasi-homogeneous approximation model of the GTD theory in Bearon et al. (Reference Bearon, Bees and Croze2012) and Croze et al. (Reference Croze, Bearon and Bees2017) cannot obviously capture this effect of inhomogeneity in the shear
 $S(x)$. Hence, there is no equivalent of
 $\boldsymbol {V}_{g,c}$ in their model. On the other hand, a more rigorous application of the GTD theory will result in the equivalent of solving the Smoluchowski equation directly in this context (e.g. Jiang & Chen Reference Jiang and Chen2019, Reference Jiang and Chen2020). The form of (4.2e) for
 $\boldsymbol {V}_{g,c}$ suggests that there are two physical mechanisms at play that contribute to
 $\boldsymbol {V}_{g,c}$. One is the net flux caused by different levels of gyrotactic drift at different levels of shear at the adjacent location. The flux mainly manifests in the
 $-g \boldsymbol {\nabla }_{\boldsymbol {x}} \boldsymbol {\cdot } \langle \boldsymbol {p} \rangle _g$ term in (4.2e), which diminishes in the absence of gyrotaxis. The other is the shear trapping mechanism of Bearon & Hazel (Reference Bearon and Hazel2015) and Vennamneni et al. (Reference Vennamneni, Nambiar and Subramanian2020), which arises from the ‘eccentric shape’ of the particles and their alignment with the flow. In the presence of inhomogeneous shear, the non-spherical shape leads to some inhomogeneity of
 $g$ in the
 $\boldsymbol {x}$ space (for the detailed mechanism, see Vennamneni et al. (Reference Vennamneni, Nambiar and Subramanian2020)). Therefore, having a non-uniform shear in
 $\boldsymbol {x}$ space can lead to non-zero
 $\boldsymbol {\nabla }_{\boldsymbol {x}} g$, even if the particle does not exhibit biased motility (i.e.
 $\langle \boldsymbol {p} \rangle _g=0$). This behaviour would primarily manifest in the
 $\boldsymbol {p} \boldsymbol {\cdot } \boldsymbol {\nabla }_{\boldsymbol {x}} g$ term in (4.2e).
The importance of the drift term with  $\boldsymbol {V}_{g,c}$ can further be understood by examining the scaling of the four cases in figures 2 and 3. In the first case where the particles are spherical and strongly gyrotactic (
 $\alpha _0=0$,
 $\beta \sim O(1)$), the form of (4.1) implies
 $Pe_s^2 {V}_{x,g,c} \sim O(Pe_s^2)$, an order-of-magnitude smaller than
 $ {\textit {Pe}}_s \langle p_{x} \rangle _g$: i.e.
 $\langle \boldsymbol {p} \rangle _g \gg {\textit {Pe}}_s {V}_{x,g,c}$. This behaviour remains the same in the second case, where the particles are non-spherical and strongly gyrotactic (
 $\alpha _0 \ne 0$,
 $\beta \sim O(1)$). However, in the third case where the particles are spheroidal and weakly gyrotactic (
 $\alpha _0 \sim \beta \sim O(Pe_s)$),
 $\langle p_{x} \rangle _g \sim Pe_s {V}_{x,g,c}$ due to
 $\langle p_{x} \rangle _g \sim O(Pe_s)$ from
 $\beta \sim O(Pe_s)$. Hence, if the particles are weakly gyrotactic,
 ${V}_{x,g,c}$ is of significance. Lastly, for the spheroidal and non-gyrotactic particles (
 $\alpha _0 \neq 0$,
 $\beta =0$),
 ${V}_{x,g,c}$ becomes dominant while
 $\langle p_{x} \rangle _g=0$. In this case,
 ${V}_{x,g,c}$ is purely from the shear trapping mechanism, as explained by Bearon & Hazel (Reference Bearon and Hazel2015) and Vennamneni et al. (Reference Vennamneni, Nambiar and Subramanian2020).
5.2.2. Transient dynamics
In this subsection, we investigate the transient dynamics from the perspective of the exact transformed equation. Rewriting (3.1) for this example, we have
 \begin{equation} \partial_t n + {\textit{Pe}}_s \partial_x \left[ \langle p_{x} \rangle_f n \right] = 0, \end{equation}
in which  $\langle p_{x} \rangle _f$ can be expanded through (3.8) into
 \begin{equation} \langle p_{x} \rangle_f= \langle p_{x} \rangle_g - V_{x,c} - V_{x,\partial t} - {\mathsf{D}}_{xx,c} \frac{\partial_x n}{n}. \end{equation}
Substituting (5.5) into (5.4) yields the transport equation
 \begin{equation} \partial_t n + {\textit{Pe}}_s \partial_x \left[(\langle p_{x} \rangle_g-V_{x,c}- V_{x,\partial t}) n \right] = \partial_x {\mathsf{D}}_{xx,c} \partial_x n. \end{equation}
Supplementary movies 1–4 (available at https://doi.org/10.1017/jfm.2022.10) show how the balance in (5.5) evolves in time from a uniform suspension. In the beginning, all terms were zeros, except for  $\langle p_{x} \rangle _g$ and the unsteadiness in
 $f$ which balance out each other. Note that the unsteadiness in
 $f$ was transformed into a drift
 $V_{x,\partial t}$ in the transport equation (see (4.2f)). As the suspension starts to evolve, the
 $\boldsymbol {p}$ space evolves first in the time scale of order unity (i.e. the fast time scale in § 4) – note that the time scale in the
 $\boldsymbol {p}$ space is
 $1/d_r^*$ (see § 2). The fast-changing
 $f$ drives the drift
 $V_{x,\partial t}$ away from
 $\langle p_{x} \rangle _g$ in the beginning, resulting in non-zero
 $\langle p_{x} \rangle _f$ in (5.5), which in turn generates the unsteadiness in
 $n$ in (5.4). Therefore,
 $n(x,t)$ does not start evolving until
 $V_{x,\partial t}$ has become significantly different from
 $\langle p_{x} \rangle _g$. For
 $t \sim O(1)$,
 $V_{x,\partial t}$ is close to zero, indicating that
 $f$ has reached the quasi-steady regime, justifying the assumption of § 4. It is also in this time interval where
 $V_{x,c} \approx V_{x,g,c}$ and
 ${\mathsf{D}}_{xx,c} \approx {\mathsf{D}}_{xx,g,c}$, implying that the local approximation in § 4 would be valid after this short initial transient.
For  $t\gtrsim O(1)$,
 $n(x,t)$ evolves slowly, while
 $\langle p_{x} \rangle _f$ diminishes towards zero, mainly due to the increasing magnitude of
 $(\partial _x n/n)$ to balance
 $\langle p_{x} \rangle _g$ in (5.5). As
 $\langle p_{x} \rangle _f$ vanishes,
 $n(x,t)$ reaches a steady equilibrium. During this slow transient period,
 $f$ also evolves but slowly enough such that
 $V_{x,\partial t}$ remains insignificant. Note that, in this example, the prescribed flow field was steady, such that
 $V_{x,g,\partial T}$ vanishes. If the prescribed flow were unsteady in the long time scale
 $T$, we would also expect
 $V_{x,\partial t}$ to be significant and to be well approximated by
 $V_{x,g,\partial T}$. In all the examples considered,
 ${\mathsf{D}}_{xx,c}$ remains close to the approximation
 ${\mathsf{D}}_{xx,g,c}$. In weakly and non-gyrotactic suspensions,
 $V_{x,c}$ does not evolve far from
 $V_{x,g,c}$ either, but in strongly gyrotactic suspension,
 $V_{x,c}$ is found to change direction as
 $t\rightarrow \infty$. As mentioned in § 5.2.1,
 $V_{x,c}$ is considerably small compared with
 $\langle p_{x} \rangle _g$ in this case. Therefore, regardless of the fact that
 $V_{x,g,c}$ differs from
 $V_{x,c}$, the local approximation model still performs well.
5.2.3. Translational diffusion
Lastly, we consider a non-zero translational diffusion for the previous examples. Microalgae such as Chlamydomos and Dunaliella are often considered to have negligible thermal diffusion given their relatively large sizes (see reviews by Pedley & Kessler (Reference Pedley and Kessler1992), Saintillan (Reference Saintillan2018) and Bees (Reference Bees2020)). Their random walk is often modelled only through rotational diffusion by assuming that the intracellular biochemical noise only affects the rotational motion. However, in theory, non-zero  $D_T$ might also provide a mechanism to model some part of the randomness. The swimming mechanisms often involve sophisticated noisy beating dynamics of cilia and flagella (e.g. Wan & Goldstein Reference Wan and Goldstein2014), which might result in random translation in addition to random rotation. Given the ambiguity in choosing a biologically relevant value for
 $D_T$, here we simply consider some values of
 $D_T$ to demonstrate the role of translational diffusion in the transport equation, i.e.
 $\boldsymbol {V}_{D_T}$ and
 $\boldsymbol{\mathsf{D}}_{D_T}$.
We consider the steady-state number density at an arbitrary value of  $D_T=0.01$, which is chosen to be of magnitude similar to that of
 $ {\textit {Pe}}_s \boldsymbol{\mathsf{D}}_c$. This arbitrary choice was made to highlight the potential role of translational diffusion. Also, for biological microparticles, any
 $D_T$ value larger than
 $ {\textit {Pe}}_s \boldsymbol{\mathsf{D}}_c$ would be physically unrealistic (cf. experimental measurements of Croze et al. (Reference Croze, Bearon and Bees2017)). We have also computed the steady state at
 $D_T=0.002$, but since the results are qualitatively the same, we only present the
 $D_T=0.01$ case here.
The exact steady-state number density  $n_{f,s}({x})$ from the Smoluchowski equation (2.6) is given by
 \begin{equation} \partial_x [( {\textit{Pe}}_s \langle p_{x} \rangle_g - {\textit{Pe}}_s ({V}_{x,c} + {V}_{x,D_T})) n_{f,s}] = \partial_x [ (D_T+ {\textit{Pe}}_s ({\mathsf{D}}_{xx,c}+{\mathsf{D}}_{xx,D_T})) \partial_x n_{f,s} ], \end{equation}
and the number density from the local approximation  $n_{g,s}$ is given by
 \begin{align} \partial_x [( {\textit{Pe}}_s \langle p_{x} \rangle_g - {\textit{Pe}}_s^2 ({V}_{x,g,c}+{V}_{x,g,D_T})) n_{g,s}] = \partial_x [(D_T+ {\textit{Pe}}_s^2({\mathsf{D}}_{xx,g,c}+{\mathsf{D}}_{xx,g,D_T})) \partial_x n_{g,s} ]. \end{align}
Note that  $ {\textit {Pe}}_s^2 {V}_{x,g,D_T}$ and
 $ {\textit {Pe}}_s^2 {\mathsf{D}}_{xx,g,D_T}$ scale with
 $ {\textit {Pe}}_s D_T$ from (4.2b) and (4.2c).
Figure 5 shows the steady-state number density with  $D_T=0.01$ for the same parameters considered in figure 2. One can see that the introduction of non-zero
 $D_T$ has further smoothed out the number density in all cases considered by comparing figures 2 and 5. However,
 $D_T$ does not seem to have significantly altered most of the conclusions drawn in § 5.2.1.
Comparison of the steady-state number density given by the direct integration of (2.6) (black solid line,  $n_{f,s}$) and the local approximation of § 4 (blue dot-dashed line,
 $n_{g,s}$) of suspensions of (a) spherical and strongly gyrotactic (
 $\beta =2.2, \alpha _0=0$), (b) non-spherical and strongly gyrotactic (
 $\beta =2.2, \alpha _0=0.31$), (c) non-spherical and weakly gyrotactic (
 $\beta =0.21, \alpha _0=0.31$) and (d) non-spherical and non-gyrotactic (
 $\beta =0, \alpha _0=0.31$) particles. The particles are diffusive such that
 $D_T=0.01$. The suspensions are subjected to a vertical flow
 $W(x)=-\cos ({\rm \pi} x)-1$ with
 $ {\textit {Pe}}_s=0.25$ and
 $ {\textit {Pe}}_f=1$. Note that the vertical scale for
 $n(x)$ in (c,d) is much smaller than that in (a,b).

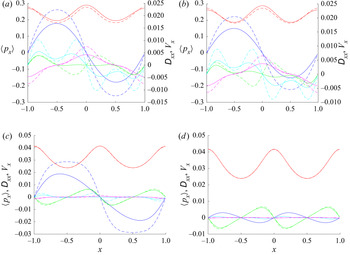
The effective drift and dispersion terms in this case are also shown in figure 6. The introduction of non-zero  $D_T$ also gives rise to an extra drift
 ${V}_{x,D_T}$ and an extra dispersion
 ${\mathsf{D}}_{xx,D_T}$. Their approximations
 ${V}_{x,g,D_T}$ and
 ${\mathsf{D}}_{xx,D_T}$ loosely follow the trend of their exact counterparts, such that the overall approximation
 $n_{g,s}$ remains an accurate prediction of the full solution. Comparing the strongly gyrotactic case (figure 6b) with the weakly gyrotactic case (figure 6c), one can also conclude that the effects of
 ${V}_{x,D_T}$ and
 ${\mathsf{D}}_{xx,D_T}$ are much stronger in strongly gyrotactic suspensions. Since
 ${V}_{x,D_T}$ and
 ${\mathsf{D}}_{xx,D_T}$ are driven by
 $\boldsymbol {\nabla }_{\boldsymbol {x}} f$ and
 $\nabla^2_{\boldsymbol {x}} f$ according to (3.4b) and (3.4c), the large
 ${V}_{x,D_T}$ and
 ${\mathsf{D}}_{xx,D_T}$ are likely driven by the larger variation of
 $f$ in
 $x$ induced by the stronger gyrotaxis. Lastly, it is worth noting that
 ${\mathsf{D}}_{xx,D_T}$ and
 ${\mathsf{D}}_{xx,g,D_T}$ can be negative for some domain in
 $x$. As mentioned in § 3, the terms with
 ${\mathsf{D}}_{xx,D_T}$ and
 ${\mathsf{D}}_{xx,g,D_T}$ do not necessarily represent diffusion – they depict the dispersive behaviour introduced by translational diffusion. Therefore, negative diagonal values in
 $\boldsymbol{\mathsf{D}}_{D_T}$ are allowed.
Comparison of the drifts and dispersion terms in (5.7)–(5.8) at the steady state. The plots show the values of  $\langle p_{x} \rangle _f$ and
 $\langle p_{x} \rangle _g$ (blue),
 ${\mathsf{D}}_{xx,c}$ and
 $ {\textit {Pe}}_s {\mathsf{D}}_{xx,g,c}$ (red),
 $V_{x,c}$ and
 $ {\textit {Pe}}_s V_{x,g,c}$ (green),
 ${\mathsf{D}}_{xx,D_T}$ and
 $ {\textit {Pe}}_s {\mathsf{D}}_{xx,g,D_T}$ (magneta),
 $V_{x,D_T}$ and
 $ {\textit {Pe}}_s V_{x,g,D_T}$ (cyan) calculated using the steady-state
 $f(\boldsymbol {x},\boldsymbol {p},\infty )$ (solid lines) and
 $g(\boldsymbol {x},\infty ;\boldsymbol {p})$ (dashed lines) of suspensions of (a) spherical and strongly gyrotactic (
 $\beta =2.2, \alpha _0=0$), (b) non-spherical and strongly gyrotactic (
 $\beta =2.2, \alpha _0=0.31$), (c) non-spherical and weakly gyrotactic (
 $\beta =0.21, \alpha _0=0.31$) and (d) non-spherical and non-gyrotactic (
 $\beta =0, \alpha _0=0.31$) particles. The particles are diffusive such that
 $D_T=0.01$. The suspensions are subjected to a vertical flow
 $W(x)=-\cos ({\rm \pi} x)-1$ with
 $ {\textit {Pe}}_s=0.25$ and
 $ {\textit {Pe}}_f=1$.

5.3. A suspension of gyrotactic active particles subjected to a prescribed horizontal flow
In this section, we consider a horizontal shear flow  $\boldsymbol {u}=[U(z),0,0]^{\rm T}$ in the gyrotactic suspension instead of a vertical shear flow. Similar to § 5.2, we first assume an infinite
 $\boldsymbol {x}$ domain with a periodicity in
 $z$ and no translational diffusion. The horizontal shear flow is prescribed as
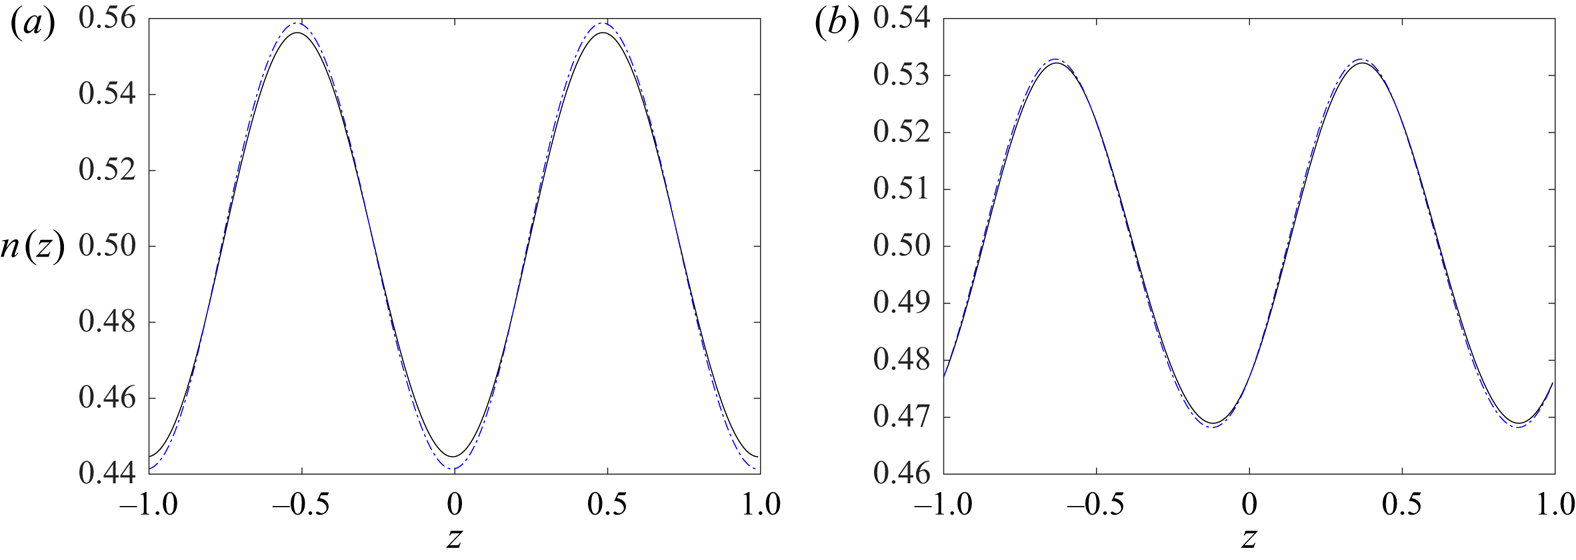
 $U(z)=\cos {({\rm \pi} z)}$, as shown in figure 1(b). Figure 7(a) shows the steady-state number density profiles
 $n(z)$ of the strongly gyrotactic suspension (
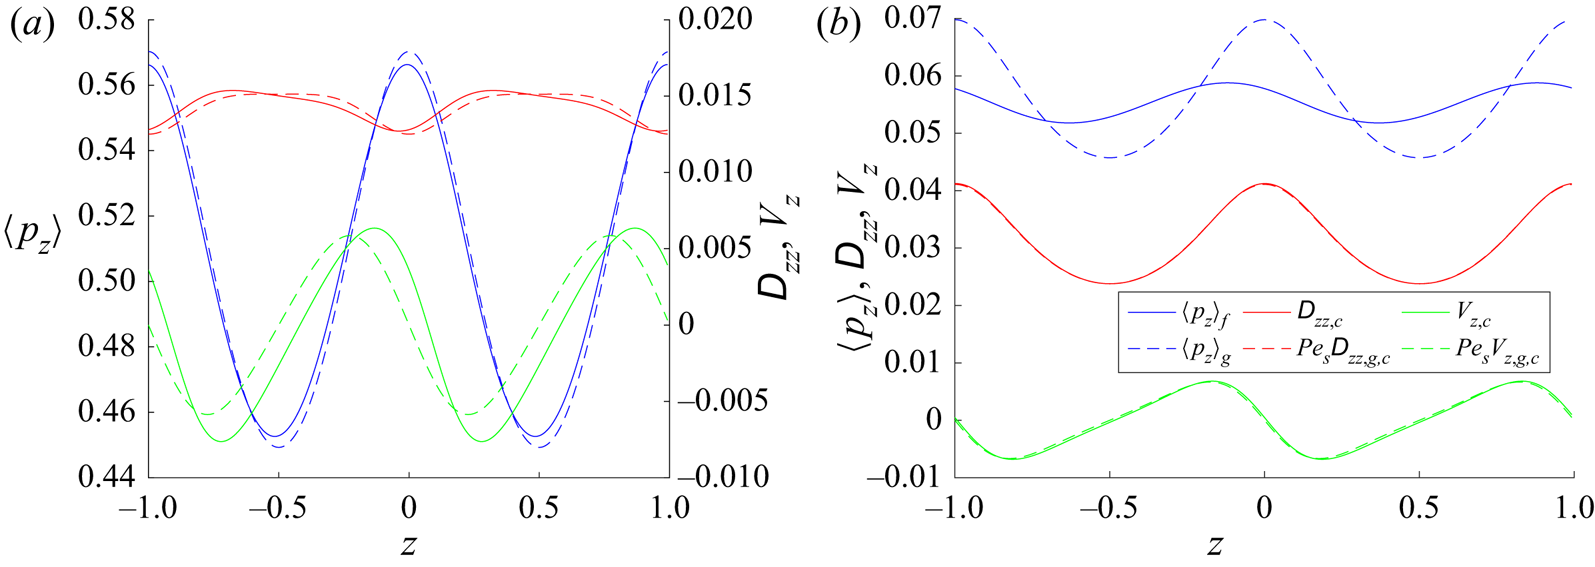
 $\beta =2.2,\alpha _0=0.31$) computed from the local approximation model, which follows the full solution closely. Similar to the case in § 5.2.1, the small differences mainly come from the difference between
 $V_{z,g,c}$ and
 $V_{z,c}$, which is relatively small when compared with
 $\langle \boldsymbol {p} \rangle _g$ (figure 8a). As for the weakly gyrotactic non-spherical case (
 $\beta =0.21,\alpha _0=0.31$), the prediction from the local approximation is virtually the same as the full solution to the Smoluchowski equation (2.6).
Comparison of the steady-state number density given by the direct integration of (2.6) (black solid line,  $n_{f,s}$) and the local approximation of § 4 (blue dot-dashed line,
 $n_{g,s}$) of suspensions of (a) strongly gyrotactic particles (
 $\beta =2.2, \alpha _0=0.31$) and (b) weakly gyrotactic particles (
 $\beta =0.21, \alpha _0=0.31$). The suspensions are subjected to horizontal shear flow
 $U(z)=\cos ({\rm \pi} z)$ with
 $ {\textit {Pe}}_s=0.25$ and
 $ {\textit {Pe}}_f=1$.

Comparison of the vertical drifts and dispersion terms at the steady state. The plots show the values of  $\langle p_{z} \rangle _f$ (blue, solid),
 $\langle p_{z} \rangle _g$ (blue, dashed),
 ${\mathsf{D}}_{zz,c}$ (red, solid),
 $ {\textit {Pe}}_s {\mathsf{D}}_{zz,g,c}$ (red, dashed),
 $V_{z,c}$ (green, solid) and
 $ {\textit {Pe}}_s V_{z,g,c}$ (green, dashed) at the steady state of suspensions of (a) strongly gyrotactic particles (
 $\beta =2.2, \alpha _0=0.31$) and (b) weakly gyrotactic particles (
 $\beta =0.21, \alpha _0=0.31$). The suspensions are subjected to a horizontal shear flow
 $U(z)=\cos ({\rm \pi} z)$ with
 $ {\textit {Pe}}_s=0.25$ and
 $ {\textit {Pe}}_f=1$.

The transient dynamics is also investigated for the horizontal flow. As shown in supplementary movies 5 and 6, the simulation initially shows the dominant balance between  $V_{z,\partial t}$ and
 $\langle p_{z} \rangle _g$. At the time scale of order unity,
 $V_{z,\partial t}$ diminishes quickly, driven by the fast-changing
 $f$. At
 $t \gtrsim O(1)$,
 $V_{z,\partial t}$ becomes insignificant, indicating that
 $f$ has reached the quasi-steady regime. Meanwhile, the local approximation accurately predicts
 $V_{z,c} \approx Pe_s V_{z,g,c}$ and
 ${\mathsf{D}}_{zz,c} \approx Pe_s {\mathsf{D}}_{zz,g,c}$, similar to
 $V_{x,c} \approx Pe_s V_{x,g,c}$ and
 ${\mathsf{D}}_{xx,c} \approx Pe_s {\mathsf{D}}_{xx,g,c}$ in § 5.2.2. However, unlike the vertical flow cases, supplementary movies 5 and 6 show that
 $\langle p_{z} \rangle _f$ does not tend to zero as
 $t \rightarrow \infty$ in these horizontal flow cases. Instead, figure 8 shows that they stay in roughly the same order as
 $\langle p_{z} \rangle _g$ at steady equilibrium. Moreover, both
 $Pe_s V_{z,g,c}$ and
 $Pe_s {\mathsf{D}}_{zz,g,c}$ remain good approximations to
 $V_{z,c}$ and
 ${\mathsf{D}}_{zz,c}$, respectively, for a long time, even when particles are strongly gyrotactic.
5.4. A suspension of gyrotactic active particles in periodic convective cells
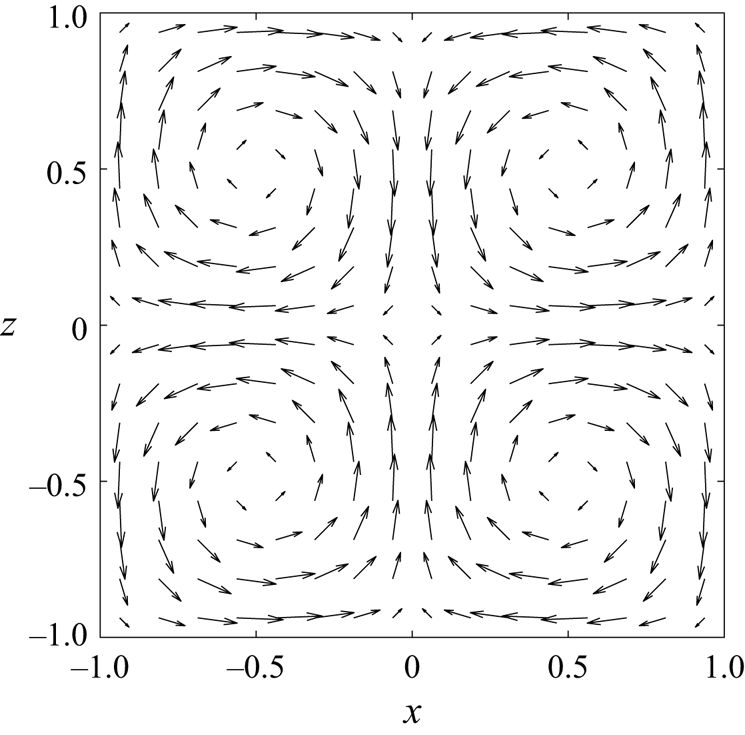
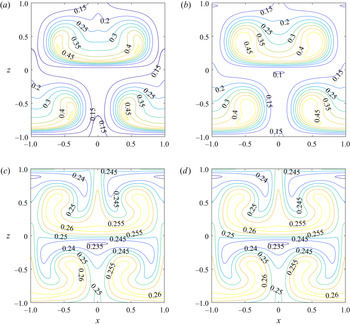
In this example, we consider a steady two-dimensional Taylor–Green-type vortex flow in a periodic box  $(x,z) \in [-1,1] \times [-1,1]$ with the velocity field
 \begin{equation} \boldsymbol{u}=(\sin{({\rm \pi} x)} \cos{({\rm \pi} z)},0,-\cos{({\rm \pi} x)}\sin{({\rm \pi} z)})^{\rm T}. \end{equation}
The flow is also shown in figure 9. The flow is introduced as a simple model to study mixing by a vortical flow and has been used to study gyrotactic motility in vortical flow in past works (e.g. Bearon et al. Reference Bearon, Hazel and Thorn2011; Durham, Climent & Stocker Reference Durham, Climent and Stocker2011). We note that the exact Taylor–Green vortex flow will decay over time under the Navier–Stokes equation. However, it maintains its structure while it decays and satisfies the continuity equation. For simplicity, here we consider the steady vortex rather than the decaying one.
Vector plot of the two-dimensional periodic convective flow field (5.9).

We note that in this inhomogeneous flow, both the GTD theory and the Fourier method can also provide the macrotransport properties over many periodic boxes if one treats the unit box as the local space (or the microscale) and solves the Smoluchowski equation within the box. However, neither the GTD theory nor the Fourier method can approximate to the transport of ABP number density within the box without fully solving the Smoluchowski equation. Hence, this example demonstrates the advantage of the local approximation over the previous method in providing an approximated equation of transport within the box (the microscale).
Figure 10 shows the comparisons between the number density from the full solution of the Smoluchowski equation and the local approximation in suspensions of strongly and weakly gyrotactic non-spherical particles. We note that  $\boldsymbol {V}_{u}$ is no longer vanishing like in the previous examples, as the prescribed flow field is no longer parallel. In all cases, the predictions by the local approximation model appear to be good compared with the full solution to the Smoluchowski equation.

Nevertheless, the local approximation model performs a little more poorly for the strongly gyrotactic suspension (figure 10a,b) than for the weakly gyrotactic suspension (figures 10c,d), similar to the examples in §§ 5.2 and 5.3. In particular, the approximations for  $\boldsymbol {V}_{u}$,
 $\boldsymbol {V}_{c}$,
 ${\mathsf{D}}_{xx,c}$ and
 ${\mathsf{D}}_{zz,c}$ near
 $z=0$ and
 $z=\pm 1$ exhibit such a behaviour (see figures 11 and 12). Nevertheless, as shown in figure 11, the drift remains dominated by
 $\langle \boldsymbol {p} \rangle _g$, while the dispersion
 $\boldsymbol{\mathsf{D}}_c$ is well approximated by
 $ {\textit {Pe}}_s \boldsymbol{\mathsf{D}}_{g,c}$ in most of the domain (figure 12). Therefore, the approximation remains qualitatively close to the exact result, despite the local inaccuracy.
Comparison of the drifts at the steady state. The plots show the values of (a)  $\langle \boldsymbol {p} \rangle _f$, (b)
 $\boldsymbol {V}_c$, (c)
 $\boldsymbol {V}_{\boldsymbol {u}}$, (d)
 $Pe_s\langle \boldsymbol {p} \rangle _g$, (e)
 $Pe_s\boldsymbol {V}_{g,c}$ and (f )
 $Pe_s\boldsymbol {V}_{g,\boldsymbol {u}}$ calculated using the steady-state
 $f(\boldsymbol {x},\boldsymbol {p},\infty )$ and
 $g(\boldsymbol {x},\infty ;\boldsymbol {p})$ of a suspension of strongly gyrotactic particles (
 $\beta =2.2,\alpha _0=0.31$). The suspension is subjected to the convective flow (5.9) with
 $ {\textit {Pe}}_s=0.25$ and
 $ {\textit {Pe}}_f=0.5$.

Comparison of (a–d) the dispersion  $\boldsymbol{\mathsf{D}}_c$ and (e–h) its approximation
 $Pe_s\boldsymbol{\mathsf{D}}_{g,c}$ at the steady state. The plots show the (a,e)
 $xx$, (b,f )
 $xz$, (c,g)
 $zx$ and (d,h)
 $zz$ components of dispersion tensors. The suspension is strongly gyrotactic (
 $\beta =2.2,\alpha _0=0.31$) and subjected to the convective flow (5.9) with
 $ {\textit {Pe}}_s=0.25$ and
 $ {\textit {Pe}}_f=0.5$.

In the weakly gyrotactic suspension, the local approximation more accurately captures both the number density (figure 10d) and the dispersions (figure 14), consistent with the previous examples shown. Although the approximations to the drifts  $\boldsymbol {V}_{c}$ and
 $\boldsymbol {V}_{u}$ are not as accurate, they are relatively negligible compared to
 $\langle \boldsymbol {p} \rangle _g$ (figure 13).
Comparison of the drifts at the steady state. The plots show the values of (a)  $\langle \boldsymbol {p} \rangle _f$, (b)
 $\boldsymbol {V}_c$, (c)
 $\boldsymbol {V}_{\boldsymbol {u}}$, (d)
 $Pe_s\langle \boldsymbol {p} \rangle _g$, (e)
 $Pe_s\boldsymbol {V}_{g,c}$ and (f )
 $Pe_s\boldsymbol {V}_{\boldsymbol {g},\boldsymbol {u}}$ calculated using the steady-state
 $f(\boldsymbol {x},\boldsymbol {p},\infty )$ and
 $g(\boldsymbol {x},\infty ;\boldsymbol {p})$ of a suspension of weakly gyrotactic particles (
 $\beta =0.21,\alpha _0=0.31$). The suspension is subjected to the convective flow (5.9) with
 $ {\textit {Pe}}_s=0.25$ and
 $ {\textit {Pe}}_f=0.5$.

Comparison of (a–d) the dispersion  $\boldsymbol{\mathsf{D}}_c$ and (e–h) its approximation
 $Pe_s\boldsymbol{\mathsf{D}}_{g,c}$ at the steady state. The plots show the (a,e)
 $xx$, (b,f )
 $xz$, (c,g)
 $zx$ and (d,h)
 $zz$ components of dispersion tensors. The suspension is weakly gyrotactic (
 $\beta =0.21,\alpha _0=0.31$) and subjected to the convective flow (5.9) with
 $ {\textit {Pe}}_s=0.25$ and
 $ {\textit {Pe}}_f=0.5$.

6. Discussion: physical implication of the transformation
This work sets out to seek a model transport equation that can predict the number density given by the Smoluchowski equation without solving the equation directly. To achieve the goal, in § 3, we have shown how the Smoluchowski equation (2.6) can be transformed into a transport equation by expanding  $\langle \boldsymbol {p} \rangle _f n$ in (3.1) in terms of
 $\langle \boldsymbol {p} \rangle _g n$ and other drifts
 $\boldsymbol {V}_\star n$ and dispersions/diffusions
 $\boldsymbol{\mathsf{D}}_\star \boldsymbol {\cdot } \boldsymbol {\nabla }_{\boldsymbol {x}} n$. We note that the averaged orientation
 $\langle \boldsymbol {p} \rangle _g$ of individual particles is often taken directly as the only drift in the previous quasi-homogeneous approximation model of the GTD theory. However, as
 $\langle \boldsymbol {p} \rangle _f$ is formally expanded thought the transformation, it now clearly reveals how
 $\langle \boldsymbol {p} \rangle _g$ is different from
 $\langle \boldsymbol {p} \rangle _f$.
To better show the implication of this transformation, here we rewrite the procedures in § 3 for the examples in §§ 5.2 and 5.3, which are under the assumptions of a parallel flow. For simplicity, we further assume  $D_T=0$. Therefore, we can rewrite (3.1) as
 \begin{equation} \partial_t n(\boldsymbol{x},t)+ \boldsymbol{\nabla}_{\boldsymbol{x}} \boldsymbol{\cdot} [( {\textit{Pe}}_s \langle \boldsymbol{p} \rangle_f(\boldsymbol{x},t) \, n(\boldsymbol{x},t)] = 0, \end{equation}
in which  $\langle \boldsymbol {p} \rangle _f n$ can be expanded through (3.8) or
 \begin{equation} \langle \boldsymbol{p} \rangle_f= \langle \boldsymbol{p} \rangle_g - \boldsymbol{V}_{c} - \boldsymbol{V}_{\partial t} - \boldsymbol{\mathsf{D}}_c \boldsymbol{\cdot} \frac{\boldsymbol{\nabla}_{\boldsymbol{x}} n}{n}, \end{equation}
into the transport equation
 \begin{equation} \partial_t n + {\textit{Pe}}_s \boldsymbol{\nabla}_{\boldsymbol{x}} \boldsymbol{\cdot} \left[(\langle \boldsymbol{p} \rangle_g-\boldsymbol{V}_{c}- \boldsymbol{V}_{\partial t}) n \right] = {\textit{Pe}}_s \boldsymbol{\nabla}_{\boldsymbol{x}} \boldsymbol{\cdot} \boldsymbol{\mathsf{D}}_{c} \boldsymbol{\cdot} \boldsymbol{\nabla}_{\boldsymbol{x}} n. \end{equation}
Note that (6.1)–(6.3) are equivalent to (5.4)–(5.6) in the full three-dimensional coordinates. Now, (6.1) and the rewritten (6.3) yield two different interpretations of ABP transport. In (6.1), particles are purely advected by the motility flux  $ {\textit {Pe}}_s \langle \boldsymbol {p} \rangle _f n$, which is the ensemble-averaged flux of particles coming in and out of a certain control volume at position
 $\boldsymbol {x}$ due to the motility of the particle. In this sense,
 $ {\textit {Pe}}_s \langle \boldsymbol {p} \rangle _f n$ may be interpreted as the ‘Eulerian’ motility flux. The flux depends on the orientational and spatial distribution of particles inside and at the vicinity of the control volume. However, in (6.3), the average Eulerian motility flux
 $ {\textit {Pe}}_s \langle \boldsymbol {p} \rangle _f n$ is decomposed into the flux from the average motility of individual particles
 $ {\textit {Pe}}_s \langle \boldsymbol {p} \rangle _g n$, the advective flux due to unsteadiness in particles’ orientational dynamics
 $- {\textit {Pe}}_s \boldsymbol {V}_{\partial t} n$, the shear trapping flux
 $- {\textit {Pe}}_s \boldsymbol {V}_{c} n$ and the dispersion flux
 $- {\textit {Pe}}_s \boldsymbol{\mathsf{D}}_{c} \boldsymbol {\cdot } \boldsymbol {\nabla }_{\boldsymbol {x}} n$.
It is evident from (6.2) that the average Eulerian motility flux  $ {\textit {Pe}}_s \langle \boldsymbol {p} \rangle _f n$ is different from the flux obtained using the average motility of individual particles,
 $ {\textit {Pe}}_s \langle \boldsymbol {p} \rangle _g n$. However, it might also be counterintuitive at first glance to decipher their differences. Here, the average motility of individual particles
 $ {\textit {Pe}}_s \langle \boldsymbol {p} \rangle _g$ is defined as the ensemble average of the self-propelling velocity of individual particles when subject to the local velocity gradient and other local factors that may influence their orientation (e.g. taxes). The average motility of individual particles
 $ {\textit {Pe}}_s \langle \boldsymbol {p} \rangle _g$ is based on the average orientation of individual particles
 $\langle \boldsymbol {p} \rangle _g$, which is calculated from the homogeneous solution (
 $g$) to the operator
 $\mathcal {L}_{\boldsymbol {p}}$, representing the orientational dynamics of individual particles. It is a function of the local velocity gradient and the particles’ property only, and is explicitly independent of
 $(\boldsymbol {x},t)$. In other words,
 $\langle \boldsymbol {p} \rangle _g$ is calculated by decoupling the orientational dynamics (
 $\mathcal {L}_{\boldsymbol {p}}$) from the spatio-temporal dynamics of the Smoluchowski equation. As such, the resulting average motility
 $ {\textit {Pe}}_s \langle \boldsymbol {p} \rangle _g$ may be viewed to provide a ‘Lagrangian’ description of each individual particle's motility after being averaged in the local
 $\boldsymbol {p}$ space.
By contrast, the average Eulerian motility flux  $ {\textit {Pe}}_s \langle \boldsymbol {p} \rangle _f n$ considers the distribution of particles at the nearby location in the
 $(\boldsymbol {x},t)$ space. It is the result of directly averaging the particles’ motility
 $ {\textit {Pe}}_s \boldsymbol {p} \varPsi$ in the Smoluchowski equation (2.6). Physically, (6.2) implies that the averaged Lagrangian motility of individual particles
 $ {\textit {Pe}}_s \langle \boldsymbol {p} \rangle _g$ only contributes to part of the overall Eulerian drift
 $ {\textit {Pe}}_s \langle \boldsymbol {p} \rangle _f$. It also reveals that the particle dispersion flux
 $ {\textit {Pe}}_s \boldsymbol{\mathsf{D}}_c \boldsymbol {\cdot } \boldsymbol {\nabla }_{\boldsymbol {x}} n$ originates from the Eulerian motility flux
 $ {\textit {Pe}}_s \langle \boldsymbol {p} \rangle _f n$. The other fluxes from drifts and dispersions arising from the interaction between the orientational dynamics (
 $\mathcal {L}_{\boldsymbol {p}}$) and the rest of the Smoluchowski equation are also included in the average Eulerian motility flux
 $ {\textit {Pe}}_s \langle \boldsymbol {p} \rangle _f n$. For example, it includes the effect of the different orientation distribution at the nearby location, which gives rise to the extra shear trapping flux
 $- {\textit {Pe}}_s \boldsymbol {V}_c n$, even when the average motility
 $ {\textit {Pe}}_s \langle \boldsymbol {p} \rangle _g$ is zero (as demonstrated in § 5.2.1,figure 3d). It also includes the effect of the changing orientation over time described by the extra flux
 $- {\textit {Pe}}_s \boldsymbol {V}_{\partial t}n$. Extending the decomposition to a more general ABP suspension, the passive advection and translation diffusion of particles also give rise to extra drifts and dispersion through the particles’ motility, and they emerge with
 $\boldsymbol {V}_u$,
 $\boldsymbol {V}_{D_T}$ and
 $\boldsymbol{\mathsf{D}}_{D_T}$ (see also table 2).
7. Concluding remarks
In this study, we have proposed a new method to reduce the Smoluchowski equation into a simpler transport equation. The Smoluchowski equation governs the statistics of the position and orientation of biased or non-biased ABPs, whose orientational trajectories are described by the Jeffery orbit in the presence of rotational random noise. The framework is directly applicable to dilute suspensions of biased or non-biased ABPs in a large-scale system with strong flow, such as microalgae in the ocean. It can also be extended to the flow regime where the long-range hydrodynamic contribution of swimming motion of individual particles can be represented by averaged forces and stress tensors (e.g. Batchelor Reference Batchelor1970; Hinch & Leal Reference Hinch and Leal1972a,Reference Hinch and Lealb; Pedley & Kessler Reference Pedley and Kessler1990).
We have presented a method to transform the Smoluchowski equation into a transport equation exactly for a given flow field. The method involves decomposing the average Eulerian motility flux  $ {\textit {Pe}}_s \langle \boldsymbol {p} \rangle _f n$ at a fixed location into the flux from the average Langrangian motility flux of individual particles
 $ {\textit {Pe}}_s \langle \boldsymbol {p} \rangle _g n$ and other contributions. The transformation has shown that
 $ {\textit {Pe}}_s \langle \boldsymbol {p} \rangle _g$ is different from
 $ {\textit {Pe}}_s \langle \boldsymbol {p} \rangle _f$ and only constitutes part of
 $ {\textit {Pe}}_s \langle \boldsymbol {p} \rangle _f$. The transformation also unveils the explicit form of the other drift and dispersion terms contributing to the overall average Eulerian motility. These terms include the shear trapping drift
 $\boldsymbol {V}_c$ and the particle dispersion
 $\boldsymbol{\mathsf{D}}_c$ due to rotational diffusion. In addition, we have also discovered the drift
 $\boldsymbol {V}_{\partial t}$ due to the interaction between the unsteadiness in orientation and the orientational dynamics itself, the drift
 $\boldsymbol {V}_{D_T}$ and dispersion
 $\boldsymbol{\mathsf{D}}_{D_T}$ arise from the interaction between translational diffusion and the orientational dynamics, and the drift
 $\boldsymbol {V}_{u}$ from the interaction between passive advection of orientational distribution and the orientational dynamics.
Although these new physical drifts and dispersions revealed by the transformation are easily interpretable in a transport equation, they cannot be directly used as a model due to the prerequisite of first obtaining  $\varPsi (\boldsymbol {x},\boldsymbol {p},t)$ by solving the Smoluchowski equation directly. In this regard, this work has presented a new model based on the local approximation of the transformation, which only relies on the local flow information instead of the global flow configuration. By assuming that the time scale of the orientational dynamics is much faster than that of the spatial dynamics (or that the ABP run length is much smaller than the characteristic length scale of the flow field), we have approximated the orientational space probability density function
 $f(\boldsymbol {x},\boldsymbol {p},t)=\varPsi /n$ by the homogeneous solution
 $g(\boldsymbol {x},t;\boldsymbol {p})$ of the orientational space operator
 $\mathcal {L}_p$, thereby circumventing the need to solve for
 $\varPsi$. The approximation gives the same shear trapping drift
 $\boldsymbol {V}_{g,c}$ and particle dispersion
 $\boldsymbol{\mathsf{D}}_{g,c}$ as that of Bearon & Hazel (Reference Bearon and Hazel2015) and Vennamneni et al. (Reference Vennamneni, Nambiar and Subramanian2020) when the particles have no taxes and diffusion, but it can also be extended to particles with biased motility (i.e. taxes) or translational diffusion.
The numerical examples of suspensions in horizontal and vertical shear flows showed that the new model works reasonably well in approximating the full solution of the Smoluchowski equation, especially when the particles are weakly or not biased. The model can capture the shear trapping of non-spherical motile particles because of its applicability in inhomogeneous flow. It can also capture the more dominant flux due to biased motility, which was not accounted for in previous methods for unbiased ABPs (e.g. Bearon & Hazel Reference Bearon and Hazel2015; Vennamneni et al. Reference Vennamneni, Nambiar and Subramanian2020). Meanwhile, the examples in the periodic convective cells demonstrated the general applicability of the local approximation in complex flow. The local approximation has yielded accurate predictions of the number density in weakly gyrotactic suspensions. Although the approximation is not as accurate in strongly gyrotactic suspensions, the result remains qualitatively satisfactory. Overall, this work has shown that the local approximation method has maintained its accuracy in most of the cases considered while being applicable to more general flows.
As pointed out in a recent review (Bees Reference Bees2020), there is a gap between complex models of individual particles and their equivalent continuum modelling at the population level. The general applicability of the presented method for the transport of biased or non-biased ABPs in any flow field is perhaps the most important result especially from a practical perspective. In our numerical examples, we can also see that the presented method can quite accurately approximate the number density from the full solution of the Smoluchowski equation. While the presented examples focused mainly on gyrotactic ABPs, the framework presented can also be extended to other types of taxes, such as phototaxis and chemotaxis, as well as to other types of particle motions, such as the orientation-dependent sedimentation of elongated particles (e.g. Ardekani et al. Reference Ardekani, Sardina, Brandt, Karp-Boss, Bearon and Variano2017; Clifton et al. Reference Clifton, Bearon and Bees2018; Lovecchio et al. Reference Lovecchio, Climent, Stocker and Durham2019). Hence, the potential application of the framework presented in this work is vast.
However, the current framework needs further developments and analysis. In particular, more work can be done to improve the inaccuracy in strongly gyrotactic suspensions, where the strong gradient in the number density might affect the accuracy of the approximated drifts and dispersions. For example, the accuracy of the local approximation can be improved by truncating the model at a higher order of  $\epsilon$ (see Appendix A). Alternatively, perhaps one can also consider applying a different asymptotic limit to the transformation in § 3 to derive a different model. Beyond the examples with periodic boundary conditions shown in this work, one also needs a good boundary condition at the wall. For example, Ezhilan & Saintillan (Reference Ezhilan and Saintillan2015) have demonstrated the important role of translational diffusion
 $D_T$ in the wall accumulation near a no-flux boundary, which this work has yet to demonstrate. On the other hand, the microscopic interactions between the wall and individual ABPs remain a subject of future work. Even with the knowledge of microscopic interactions between the particles and the wall, translating the interactions into suitable boundary conditions at the continuum level remains an important challenge. To this end, the recent work by Chen & Thiffeault (Reference Chen and Thiffeault2021) offers some insight into how one can account for the non-trivial and shape-dependent nematic alignment with the wall.
Supplementary movies
Supplementary movies are available at https://doi.org/10.1017/jfm.2022.10.
Funding
R.N.B. acknowledges support from the Engineering and Physical Sciences Research Council (EP/S033211/1, ‘Shape, shear, search & strife; mathematical models of bacteria’). L.F. is funded by the President's PhD Scholarship of Imperial College London.
Declaration of interests
The authors report no conflict of interest.
Author contributions
R.N.B. had the original idea of the transformation technique under an asymptotic approximation. L.F. and Y.H. developed the theory and L.F. performed the simulations. All authors contributed to reaching conclusions and in writing the paper.
Appendix A. Derivation of the local approximation
Following the expansion of  $\varPsi =\varPsi ^{(0)}+ \epsilon \varPsi ^{(1)} + \epsilon ^2 \varPsi ^{(2)}+\dots$ in § 4, we substitute the expansion into the Smoluchowski equation (2.6) and yield the following set of equations at successive orders of
 $\epsilon$:
 $$\begin{gather} O(1) : \partial_t \varPsi^{(0)} + \mathcal{L}_p \varPsi^{(0)} =0; \end{gather}$$
 $$\begin{gather}O(\epsilon) : \partial_T \varPsi^{(0)} + \boldsymbol{p} \boldsymbol{\cdot} \boldsymbol{\nabla}_{\boldsymbol{x}} \varPsi^{(0)} + \widetilde{ {\textit{Pe}}}_f \boldsymbol{u} \boldsymbol{\cdot} \boldsymbol{\nabla}_{\boldsymbol{x}} \varPsi^{(0)} + \partial_t \varPsi^{(1)} + \mathcal{L}_p \varPsi^{(1)} =\tilde{D}_T \nabla_x^2 \varPsi^{(0)}; \end{gather}$$
 $$\begin{gather}O(\epsilon^2) : \partial_T \varPsi^{(1)} + \boldsymbol{p} \boldsymbol{\cdot} \boldsymbol{\nabla}_{\boldsymbol{x}} \varPsi^{(1)} + \widetilde{ {\textit{Pe}}}_f \boldsymbol{u} \boldsymbol{\cdot} \boldsymbol{\nabla}_{\boldsymbol{x}} \varPsi^{(1)} + \partial_t \varPsi^{(2)} + \mathcal{L}_p \varPsi^{(2)} =\tilde{D}_T \nabla_x^2 \varPsi^{(1)}; \mbox{etc.} \end{gather}$$
Integrating over  $\boldsymbol {p}$ space, (A1) becomes
 $$\begin{gather} O(1) : \partial_t n^{(0)} =0; \end{gather}$$
 $$\begin{gather}O(\epsilon) : \partial_T n^{(0)} +\partial_t n^{(1)} + \boldsymbol{\nabla}_{\boldsymbol{x}} \boldsymbol{\cdot} \left[ (\widetilde{ {\textit{Pe}}}_f \boldsymbol{u}+\langle \boldsymbol{p} \rangle^{(0)}) n^{(0)} \right] =\tilde{D}_T \nabla_x^2 n^{(0)}; \end{gather}$$
 $$\begin{gather}O(\epsilon^2) : \partial_T n^{(1)} + \partial_t n^{(2)} + \boldsymbol{\nabla}_{\boldsymbol{x}} \boldsymbol{\cdot} \left[ (\widetilde{ {\textit{Pe}}}_f \boldsymbol{u}+\langle \boldsymbol{p} \rangle^{(1)}) n^{(1)} \right] =\tilde{D}_T \nabla_x^2 n^{(1)};\ \mbox{etc.} \end{gather}$$
At the transient time  $t \gtrsim O(1)$ and each order of
 $\epsilon$, we assume the time dependency of
 $\varPsi ^{(i)}$ in
 $\boldsymbol {p}$ space has reached quasi-equilibrium, while the time dependency of
 $\varPsi ^{(i)}$ in
 $\boldsymbol {x}$ space is slow. In other words, we assume that, at each order,
 $f^{(i)}$ is independent of
 $t$ as it has reached quasi-equilibrium and
 $n^{(i)}$ is independent of
 $t$ because it only varies at the slow time scale
 $T$. Therefore, (A1a) now becomes
 \begin{equation} \mathcal{L}_p f^{(0)} =0, \end{equation}
which implies that the leading-order orientational distribution  $f^{(0)}$ takes the homogeneous solution of
 $\mathcal {L}_p(\boldsymbol {x},t)$ as the solution, i.e.
 $f^{(0)}=g(\boldsymbol {x},T;\boldsymbol {p})$. Meanwhile, we multiply (A2b) by
 $f^{(0)}$ and subtract it from (A1b). This operation is equivalent to the steps towards (3.3) in § 3. The operation yields
 \begin{align} &n^{(0)}\partial_T f^{(0)} + (\widetilde{ {\textit{Pe}}}_f \boldsymbol{u} \boldsymbol{\cdot} \boldsymbol{\nabla}_{\boldsymbol{x}} f^{(0)} - \tilde{D}_T \nabla_x^2 f^{(0)}) n^{(0)} - 2 {D}_T (\boldsymbol{\nabla}_{\boldsymbol{x}} f^{(0)}) \boldsymbol{\cdot} (\boldsymbol{\nabla}_{\boldsymbol{x}} n^{(0)}) \nonumber\\ &\quad +(\boldsymbol{p} - \langle \boldsymbol{p} \rangle^{(0)}) f^{(0)} \boldsymbol{\cdot} \boldsymbol{\nabla}_{\boldsymbol{x}} n^{(0)} + n^{(0)} (\boldsymbol{p}\boldsymbol{\cdot} \boldsymbol{\nabla}_{\boldsymbol{x}} f^{(0)} - f^{(0)} \boldsymbol{\nabla}_{\boldsymbol{x}}\boldsymbol{\cdot} \langle \boldsymbol{p} \rangle^{(0)}) \nonumber\\ &\quad + n^{(1)} \mathcal{L}_p f^{(1)} =0. \end{align}
Now, (A4) can be rewritten as
 \begin{equation} \left[\mathcal{L}_p (\boldsymbol{b}_{g,D_T} + \boldsymbol{b}_{g,c}) \right] \boldsymbol{\cdot} \boldsymbol{\nabla}_{\boldsymbol{x}} n^{(0)} + n^{(0)} \mathcal{L}_p \left[\,f_{g,u}+f_{g,D_T}+f_{g,c}+f_{g,\partial T} \right]+ n^{(1)} \mathcal{L}_p f^{(1)}=0, \end{equation}
where  $f_{g,\star }$ and
 $\boldsymbol {b}_{g,\star }$ are defined by (4.2). Equations (4.2) and (A5) are the equivalent of (3.4) and (3.5), respectively. We can then follow the same derivation as in § 3, which would lead to
 \begin{align} & \partial_T n^{(1)} + \boldsymbol{\nabla}_{\boldsymbol{x}} \boldsymbol{\cdot} \left[ (\langle \boldsymbol{p} \rangle_{g}+\widetilde{ {\textit{Pe}}}_f \boldsymbol{u}) n^{(1)} \right] \nonumber\\ &\quad = \tilde{D}_T {\nabla}^2_x n^{(1)} + \boldsymbol{\nabla}_{\boldsymbol{x}} \boldsymbol{\cdot} \left[ (\boldsymbol{\mathsf{D}}_{g,c}+\boldsymbol{\mathsf{D}}_{g,D_T}) \boldsymbol{\cdot} \boldsymbol{\nabla}_{\boldsymbol{x}} n^{(0)} + (\boldsymbol{V}_{g,u}+\boldsymbol{V}_{g,D_T}+\boldsymbol{V}_{g,c}+\boldsymbol{V}_{g,\partial T}) n^{(0)} \right], \end{align}
where  $\boldsymbol {V}_{g,\star }$ and
 $\boldsymbol{\mathsf{D}}_{g,\star }$ are defined according to (3.10)–(3.11).
Now, (A6) is at  $O(\epsilon ^2)$. If we are to recover how
 $n$ evolves over the long time
 $T$, we can recompose
 $\partial _T n=\partial _T n^{(0)}+\epsilon \partial _T n^{(1)}+\dots$, by summing up (A2a)–(A2c) with the corresponding
 $\epsilon$ scaling while substituting (A2c) with (A6). Hence,
 \begin{align} & {\textit{Pe}}_s \partial_T n + \boldsymbol{\nabla}_{\boldsymbol{x}} \boldsymbol{\cdot} \left[ ( {\textit{Pe}}_s \langle \boldsymbol{p} \rangle_{g}+{ {\textit{Pe}}}_f \boldsymbol{u}) n \right] \nonumber\\ &\quad \approx {D}_T {\nabla}^2_x n + {\textit{Pe}}_s^2 \boldsymbol{\nabla}_{\boldsymbol{x}} \boldsymbol{\cdot} \left[ (\boldsymbol{\mathsf{D}}_{g,c}+\boldsymbol{\mathsf{D}}_{g,D_T}) \boldsymbol{\cdot} \boldsymbol{\nabla}_{\boldsymbol{x}} n^{(0)} + (\boldsymbol{V}_{g,u}+\boldsymbol{V}_{g,D_T}+\boldsymbol{V}_{g,c}+\boldsymbol{V}_{g,\partial T}) n^{(0)} \right]. \end{align}
Note that we have only included  $n^{(0)}$ and
 $n^{(1)}$ when recomposing
 $n$ in this example as we are closing the problem at
 $O(\epsilon ^2)$. Therefore, (A7) is accurate up to
 $O(\epsilon ^2)$. However, if we close the problem at a higher order, we can repeat a similar process from (A4) to (A6) at a higher order.
Here, we would argue that at the transient time  $t \rightarrow \infty$,
 $\partial _t \approx {\textit {Pe}}_s \partial _T$ and
 $n \approx n^{(0)}$. Because (A7) is accurate up to
 $O(\epsilon ^2)$ while replacing
 $ {\textit {Pe}}_s^2 n^{(0)}$ with
 $ {\textit {Pe}}_s^2 n$ would only introduce an error at
 $O(\epsilon ^3)$, the substitution of
 $n^{(0)}$ by
 $n$ would not have a tremendous impact on the accuracy of (A7). Under these approximations, we recover the approximated equation (4.1).
Appendix B. Analytical solution to a suspension of spherical gyrotactic active particles in a vertical flow
If the gyrotactic active particles in a vertical flow are spherical, the steady solution of (2.6) can be written analytically as  $\varPsi (\boldsymbol {x},\boldsymbol {p},\infty )=n_s(x)f_s(\boldsymbol {p})$, where
 \begin{equation} f_s(\boldsymbol{p}) = \frac{\beta}{4 {\rm \pi}\sinh{\beta}} \exp{(\beta \cos{\theta})} \end{equation}
and
 \begin{equation} n_s(x)=A \exp{\left(-\frac{\beta {\textit{Pe}}_f W(x)}{2 {\textit{Pe}}_s}\right)}, \end{equation}
where  $A$ is the normalisation factor determined by the integral condition
 $\int _{-1}^{1} n(x)\, {{\rm d}\kern0.06em x}=1$. Equation (B1) may also explain the results of Jiang & Chen (Reference Jiang and Chen2020), who showed that the number density is strongly dependent on
 $\beta$ and the ratio between the two Péclet numbers (
 $ {\textit {Pe}}_f/ {\textit {Pe}}_s$).
If we substitute the corresponding parameters of this example into (3.8)–(3.12), we can recover
 \begin{equation} {\textit{Pe}}_s {\mathsf{D}}_{xx,c} \partial_x n_s =n_s \langle p_{x} \rangle_{g}, \end{equation}
which represents the equilibrium between a dispersion flux and the net drift that is responsible for gyrotactic focusing. Note that  $V_{x,c}=0$ in this example because
 $f_s$ is independent of
 $\boldsymbol {x}$. Here, to recover
 ${\mathsf{D}}_{xx,c}$, we can substitute
 $f_s(\boldsymbol {p})$ into (3.4d) to get
 \begin{equation} b_{x,c}(\boldsymbol{x};\boldsymbol{p})={-}\frac{ {\textit{Pe}}_s}{\beta S(x)} \left( f_s(\boldsymbol{p})-g(\boldsymbol{p}) \right), \end{equation}
and therefore
 \begin{align} {\mathsf{D}}_{xx,c} & ={-}\frac{ {\textit{Pe}}_s}{\beta S(x)}\left( \int_{S_p} f_s(\boldsymbol{p}) p_x \,{\rm d}^2 \boldsymbol{p} - \int_{S_p} g(\boldsymbol{p}) p_x \,{\rm d}^2 \boldsymbol{p} \right) \nonumber\\ & = \frac{ {\textit{Pe}}_s}{\beta S(x)} \langle p_{x} \rangle_{g}. \end{align}