Introduction
Globally, life expectancy (ex) has been rising, is projected to increase even further and the biological boundaries of the human life-span seem ever expanding (Oeppen & Vaupel, Reference Oeppen and Vaupel2002). The ex for both males and females in India has increased remarkably by 12 and 15 years, respectively, during the last three decades. Among the states of India, the ex for females of Kerala has accelerated from 62 years during 1970–1975 to 76.9 years during 2006–2010 (Registrar General of India (RGI), 2009, 2012a). This is exceptional as it represents a no less remarkable improvement than that of developed countries. The rapid gains in ex in developing countries in general and in India in particular suggest swift progress of epidemiological transition heading towards virtual convergence with ex levels in developed countries.
The gains in ex in India are mainly driven by (a) the steady decline in mortality rates across most ages, and (b) the widespread and continuing decline in mortality rates in child and adult age groups. The connecting evidence for this emerging pattern includes: first, infant mortality rate (per 1000 live births) has more than halved down from 129 to 55 during the past two decades; second, adult mortality rate (probability of dying between age 15 and 60 years) has declined from 274 to 213 per 1000 population during 1990–2008 (United Nations, 2012); and, third, crude death rate (per 1000 population) has plunged from 15 to 7.1 during 1971–2007 (RGI, 2009, 2012b).
With the steady progress of demographic transition in India, the proportion of older population aged 60 and above rose to 8.4% of the total population in 2011. The share of the older population of India is projected to rise to more than 22% by 2050 as a result of continuing demographic transition (United Nations, 2009). The demographic determinants related to the ageing transition in India include: first, the e 60 of both males and females grew respectively from 13.4 and 14.3 years in 1970–1975, to 16.7 and 18.9 years in 2002–2006. Second, concomitantly the total fertility rate (TFR) declined at a more rapid pace from a high of 5.1 in 1971–1973 to 2.5 per women in 2011 (RGI, 2012a). The NFHS data further corroborated that the TFR declined more sizeably from 3.39 to 2.68 during the recent decades of 1992–1993 to 2005–2006 (IIPS, 2000, 2005, 2007).
Viewed from a theoretical context, the ongoing demographic and epidemiological transitions in both developed and developing countries have resulted in a more skewed distribution of the age structure, which has affected the age patterns of morbidity and mortality (Pool & Wong, Reference Pool and Wong2006). As a result of (a) the rise in ex and (b) declining mortality in children and adult age groups, deaths tend to be postponed to older age cohorts leading to a heavier concentration of deaths at older ages, characterized by and attributable to an increasing prevalence of non-communicable diseases (NCDs), including the burden of multiple chronic diseases (Gruenberg, Reference Gruenberg1977; Howse, Reference Howse2006; Quigley, Reference Quigley2006; Joshi et al., Reference Joshi, Cardona, Iyengar, Sukumar, Raju and Raju2006; WHO SAERO, 2011). In 2004, the standardized mortality rates (per 100,000 population) due to NCDs and injuries were 713 and 116, respectively (United Nations, 2011), which reflected the high morbidity and mortality burden among the Indian population.
Trends in recent data point to preliminary evidence of analogous epidemiological transition in terms of changing morbidity and mortality patterns in India and Indian states. According to India's National Sample Survey (NSS) (2004), the prevalence of morbidity is lowest among young adults aged 15–29 years and highest for older persons aged 60 years and older. Interestingly, the morbidity prevalence rate slopes from the peak adult age group of 30–44, suggesting the premature onset of NCDs. The NSS (2004) data indicated pronounced heterogeneity among the states with Kerala leading with the highest morbidity prevalence rate of 255 (per 1000 population) and Rajasthan with the lowest morbidity prevalence rate of 60. Such a huge variation is commensurate with Kerala advancing into the fourth stage of demographic transition with low mortality and fertility resulting in a significantly high proportion of older population, while Rajasthan continues to drag through the third stage of demographic transition with a higher share of young population.
Most previous studies relating to mortality and morbidity in India have generally focused on level, trend and differentials. Not surprising, evidence-based studies on emerging and critical subject areas such as compression or expansions of morbidity are sparse in India and in developing countries in general. Studies on this subject have so far been mainly concentrated on mortality and morbidity experience of developed countries. The lack of research on demographic transition and its consequent effect on changing age pattern of morbidity and mortality represents a critical research gap to understand if increasing ex in India is resulting in better health or poor health across different age cohorts while the population moves ahead in epidemiological transition. This study seeks to fill this decisive gap by investigating the patterns of compression or expansion of morbidity in India, connecting them to the process of epidemiological transition. The key objectives of the study are to unfold the theoretical and evidential insights on compression or expansion patterns of morbidity in India. Explicitly, three premises are investigated, namely (1) compression of morbidity, (2) relative expansion of morbidity and (3) expansion of morbidity. The above premises are explored via examination of (a) trends in ex for older persons aged 60 and above, (b) distribution of age at death and postponement of deaths to older age group, and (c) changes in heath ratio over time.
Theoretical background
The notion of expansion of morbidity first developed by Gruenberg (Reference Gruenberg1977) assumes that increase in ex is mainly due to a reduction in fatal rate of chronic diseases rather than a decline in the incidence of these diseases. However, Fries (Reference Fries1980) argued that epidemiological transition drives the process of shifting of morbidity concentration to older age groups and thus morbidity would be compressed into later age groups. In 1989 Fries, as an extension of his premise, proposed the finite life-span hypothesis arguing that the onset of chronic disease will be postponed but the maximum ex will remain constant at about 85 years.
Doblhammer & Kytir (Reference Doblhammer and Kytir2001) explored other theoretical forms of compression and expansion of morbidity: relative compression of morbidity and relative expansion of morbidity. The ‘relative compression of morbidity’ refers to the increase in health ratio – the ratio of DiFLE ex – with the increase in ex, whereas the relative expansion of morbidity implies a decrease in the health ratio with increase in ex. Contradicting Fries' (Reference Fries1980, Reference Fries1983) postulation, Doblhammer & Kytir (Reference Doblhammer and Kytir2001) found that the Austrian older population is living longer with improvement in their health status. At all ages 60 and above, ex in good health has been increasing while at the same time ex in ill health has been decreasing. Therefore, expansion of morbidity is not evident whereas absolute compression of morbidity occurred during 1978–1983 and 1991–1998.
Doblhammer & Kytir (Reference Doblhammer and Kytir2001) and Howse (Reference Howse2006) also made a considerable attempt to critically review epidemiological transition and the changes in the distribution of disease-specific share of deaths. They found that the rise in ex is mainly driven by the postponement of deaths largely attributable to the rise in degenerative diseases. They explained three premises of compression and expansion, namely (a) expansion of morbidity, (b) compression of morbidity and (c) dynamic equilibrium of morbidity. ‘Expansion of morbidity’ is a process whereby an increase in ex is driven by medical improvements and new technologies to prevent fatality from degenerative diseases, with the underlying morbidity pattern remaining the same. Lastly, the ‘dynamic equilibrium of morbidity’ is an intermediate process where the morbidity rate of degenerative diseases slows down, as a result of which ex will increase giving rise to an increase in the overall prevalence and severe state of unhealthiness (van de Water, Reference van de Water1997).
Johansson (Reference Johansson1991) addressed the multidimensional nature of morbidity and the health transition in developing countries. The progress of health transition would lead to high morbidity or poor health with a decline in mortality. The longevity does not necessarily mean ‘compression of morbidity’ in which diseases are concentrated in later years of life. Rather, the survival among the population increases the morbidity rates for all ages, which is the outcome of saving marginal lives because of medical capabilities and medicine and drugs. India, currently amidst the health transition, has experienced an enormous rise in NCDs, parallel to the decline in mortality rates. The advancement in living standards, life-style diseases and rising health awareness have led to the rise in self-reported morbidity prevalence, and among all the diseases NCDs constitute the largest proportion.
Data and Methods
This study used multiple sources of data to accomplish analytical outcomes. First, cross-sectional data from three rounds of India's National Sample Survey (NSS) – 42nd (1986–1987), 52nd (1995–1996) and 60th (2004) rounds – on morbidity and health care were used to assess the pattern of morbidity prevalence by age and sex. The three rounds of the NSS provide synchronized and comparable data on self-reported morbidity by age for the older population aged 60 years and above, representing the current prevalence status of morbidity in the population during the reference period of the last 15 days. The National Sample Survey Organization (NSSO) maintained the same format of questionnaire for the morbidity sections in terms of both the reference period and the list of diseases including list of NCDs in 1995–1996 and 2004. The NSSO also retained the specific section on aged person in the same format for all three time periods. For the three time periods, diseases were classified into four major categories for analytical purposes: non-communicable diseases, communicable diseases, disability and other diseases. Therefore, the data are comparable over time. Policymakers and other researchers have also reconciled the comparability of NSSO data morbidity (Ministry of Health and Family Welfare, 2007; Mahal et al., Reference Mahal, Anup and Michael2010). The NSS data on morbidity and health care are so far the most widely used. The NSS 42nd round (1986–1987) provides information for a total of 302,512 observations. Of these, the number of persons aged 60 and older constitutes 58,559, and among them 8478 older persons reported any ailment in the reference period of the last 2 weeks. The NSS 52nd round (1995–1996) provides information for a total of 633,399 observations. The number of older persons aged 60 and above is 33,982 and 5640 of them reported any ailment in the last 15 days. The NSS 60th round (2004) gives information for 385,055 individuals and of them 34,831 are aged 60 and above and 10,940 older persons reported any ailment in the last 15 days.
Second, India's Sample Registration System (SRS) data on age-specific death rates (ASDR) were examined by sex and residence for the period 1970–2007. The SRS has been the most authoritative source of annual estimates of mortality and fertility since 1970. Based on the SRS ASDRs, life tables were constructed for the older population (up to age 85+), as SRS does not provide ex separately for the oldest of old (after age 70) for the period 1971–1994 in synchronization with the availability of data on morbidity from the NSS (up to age 85+).
The Sullivan (Reference Sullivan1971) method was used to construct Disease-Free Life Expectancy (DiFLE) and to measure health expectancies, which provide a single index of mortality and morbidity. The index reflects the current health status of the population adjusted for mortality and morbidity and is independent of chronological age structure. It allows use of five-year age groups effectively as it is not sensitive to the size of age groups. It provides a comparative measure of health status of a population over two time periods or two different populations at the same time. For the construction of DiFLE two components – ex and prevalence rate of NCDs – were calculated and integrated. The prevalence rate of NCDs available from the NSS, as the process of compression or expansion is majorly attributable to the prevalence levels of NCDs, was calculated as per the WHO (1957) definition, which includes the number of illnesses. The prevalence rates of NCDs were adjusted for age, sex, residence, education, physical mobility, caste, living arrangement, dependency, hospitalization, regions and monthly per capita expenditure. The analysis was restricted to older ages (60–85 age groups) as the process of compression or expansion tends to be heavily manifested in the older age groups.
Results
The results show whether India's morbidity prevalence patterns are heading towards compression or expansion, focusing on three domains: (1) changes in the prevalence rate of morbidity and pattern of morbidity, (2) change in the pattern of distribution of age at death, and (3) the health ratio, which is the ratio of DiFLE to ex.
Structural changes in age patterns of morbidity
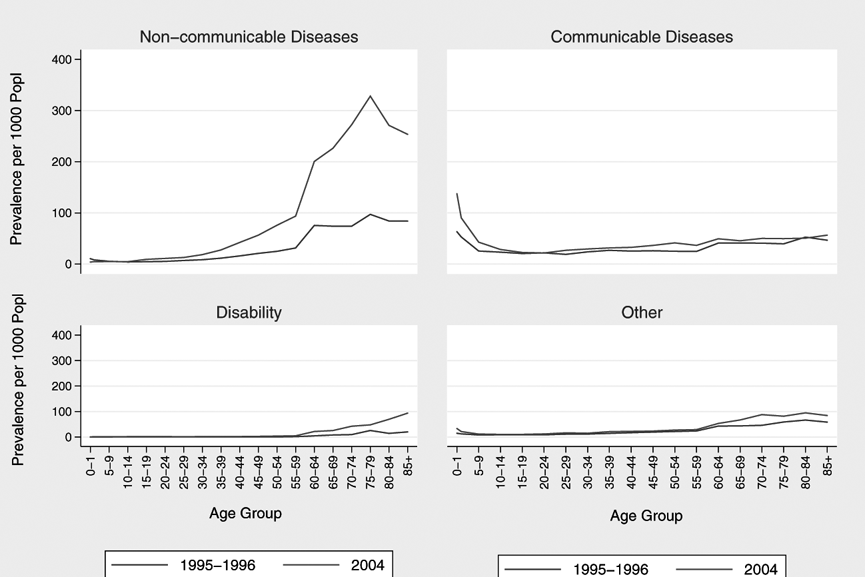
Figure 1 compares the age-specific prevalence rate of communicable diseases, NCDs, disability and other diseases by quinquennial age groups in 1995–1996 and 2004 based on the 52nd and 60th rounds of the NSS data. The trends in morbidity prevalence by age reveal significant structural changes in age patterns of morbidity. First, the overall morbidity prevalence rate increased more markedly between 1995–1996 and 2004, and this increase is almost exclusively contributed by the rise in chronic NCDs driven primarily by population ageing transition. Consequently, the prevalence of NCDs is seen to be more heavily concentrated in older ages of 60 and above in 2004 compared with 1995–1996.
Age patterns of morbidity prevalence rate by major categories of diseases, India, 1995–1996 and 2004.

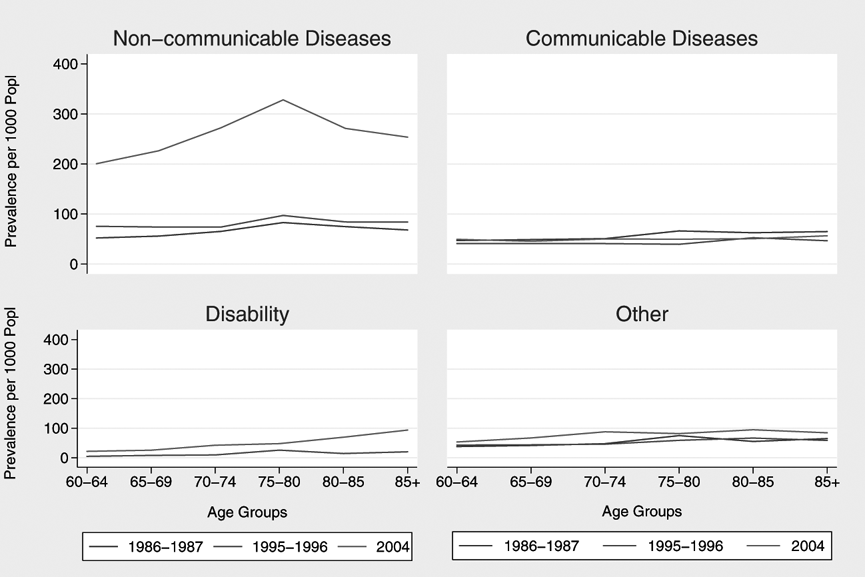
Second, the results unveil a moderate rise in the prevalence of NCDs between 1995–1996 and 2004 for adult ages of 40–60, implying an early onset of NCDs in relatively young adults aged 40. The rise in morbidity prevalence rate is seen to commence at age 40 moving up in the slope to peak in the old-old ages of 75–79. The emergence of such a pattern of morbidity substantiates growing evidence of the premature onset of chronic disease among Indian adults compared with adults in more developed countries. Third, parallel to the rise in NCDs, the prevalence of communicable diseases showed some modest increase; but other diseases remained somewhat unchanged and disability rate declined substantially for the older population (Fig. 2).
Age patterns of morbidity prevalence rate by major categories of diseases among older population aged 60 and above, India, 1986–1987, 1995–1996 and 2004.
Fourth, for the child population in ages 0–14 years, the prevalence rate of NCDs and disability remained virtually unchanged, the prevalence rate of other diseases declined while the prevalence rate of communicable disease showed some modest increase. For children under age 1, the prevalence rates of communicable and other diseases increased. Overall, the morbidity prevalence rate for child population in age group 0–14 increased during 1995–1996 to 2004.
The sizeable shift in the age pattern of morbidity is clearly the outcome of a concomitant pattern of manifold rise in the prevalence rate of NCDs among the older population vis-à-vis the disability and communicable disease prevalence rates tending to flatten across adult and older ages. The parallel shifts in major disease categories across all ages provide fresh evidence of epidemiological transition and its ramifications for corresponding shifts in the age patterns of mortality. The results confirm that the ongoing demographic transition in India has a concurrent effect on age-structural transition, and the consequent changes in the age patterns of morbidity is a critical intervening variable of the swift progress in India's epidemiological transition.
In accordance with the transition in age patterns, the age-standardized mortality rate attributable to NCDs was 685 compared with 301 for communicable diseases and 99 per 100,000 population for injuries in 2008. By gender, the age-standardized mortality rates attributable to NCDs were 793 and 582 for males and females respectively, and those attributable to cardiovascular disease were 366 and 269, respectively. Similarly, the age-standardized mortality rates for males and females, respectively, were 79 and 72 for cancers, and 167 and 119 for chronic obstructive pulmonary diseases in 2008 (WHO, 2011). The rise in the morbidity prevalence rate of NCDs and the high fatality rates due to NCDs, particularly cardiovascular diseases, in the most recent decade provide evidence of significant progress in epidemiological transition in India. To corroborate this further, the connecting evidence of a rapidly escalating prevalence rate of NCDs in the older population aged 60 and above was examined.
The age-structural changes in pattern of morbidity are known to be chiefly affected by changes in disease profile, primarily attributable to NCDs (Murray & Chen, Reference Murray and Chen1992; Murray & Lopez, Reference Murray and Lopez1994; Murray, Reference Murray1994; Kurpad et al., Reference Kurpad, Mony and Vaz2006). The key feature that characterizes epidemiological shift is the manifold rise in the prevalence rate of NCDs as a result of the rise in major chronic diseases: cardiovascular, diabetes, asthma, lung disease, arthritis, cancer and disorders of the kidney/urinary system. Gupte et al. (Reference Gupte, Ramachandran and Mutatkar2001) addressed the issue of the rise in prevalence of NCDs, viz. coronary heart disease (CHD), hypertension, cancer, diabetes mellitus and also the rural–urban differential. The prevalence of coronary heart disease as well as hypertension is 65–97/1000 in aged urban populations, compared with 10–27/1000 in aged rural populations. During 1986/1987–2004, the prevalence rate of hypertension rose immensely from 11.1 to 41.2, bronchial asthma increased hugely from 1.5 to 25.9 and heart disease rose enormously from 2.8 to 21. Gupte et al. (Reference Gupte, Ramachandran and Mutatkar2001) estimated the prevalence of diabetes mellitus in ages over 40 to be 10.5 in 1999, which is close to estimates provided by the NSSO; it was 9.7/1000 aged persons in 1995–1996, and rose further to 37.4/1000 aged persons in 2004. The prevalence rate of cancer increased six-fold and disorders of the joints and bones increased four-fold from 9.8 to 45. However, the prevalence of accident and injuries was prominent as a major category of disease during 1986–87 but decreased by 2004 (authors' calculation from NSS data, 1986–1987, 1995–1996 and 2004). Overall, the massive increase in the prevalence of chronic NCDs provides ample evidence for a structural change in the age pattern of morbidity.
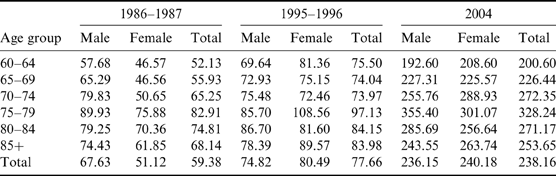
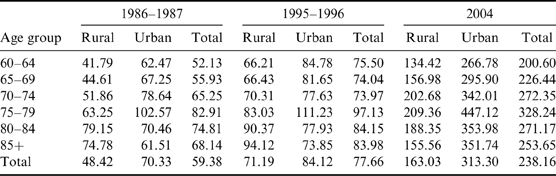
To further illustrate such structural changes in the age patterns of morbidity, Tables 1 and 2 present trends in the prevalence rate and percentage increase in the prevalence rate of NCDs by age for the older population aged 60 and above, for the three periods 1986–1987, 1995–1996 and 2004. Between 1986–1987 and 2004, the prevalence rate of NCDs for the older population aged 60 and above increased from 59 to 238, pointing to a four-fold rise. By gender, the prevalence rate of NCDs increased by four- and three-fold for females and males, respectively. In recent years, older females with a higher prevalence of NCDs are seen to be more vulnerable, compared with males.
Trends in the prevalence rate (per 1000 population) of non-communicable diseases by age and sex among older populations aged 60 and above, India, 1986–1987, 1995–1996 and 2004
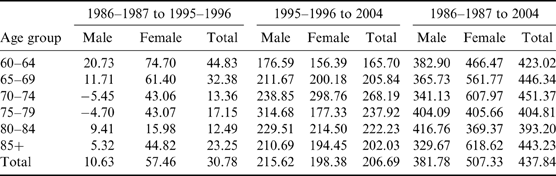
Percentage increase in the prevalence rate of non-communicable diseases by age and sex, among older population aged 60 and above, India, 1986–1987, 1995–1996 and 2004
The percentage change in the prevalence rate of NCDs is reflective of the structural dynamics of a changing age pattern of morbidity. The results provide a remarkable insight into the inter-related changes. First, between 1986–1987 and 2004, the overall prevalence rate of NCDs for older persons aged 60 years and above increased more than four-fold, with a relatively higher rate of increase during 1995/1996–2004 (2 times) than in 1986/1987–1995/1996 (0.3 times), signalling a recognizable phase of epidemiological transition during the later period.
Second, the percentage increase in the prevalence rate of NCDs was much greater for females (5 times) than males (4 times) during the entire period of 1986/1987–2004. The increase was approximately twice during 1995/1996–2004 but smaller during 1986/1987–1995/1996. During 1986/1987–1995/1996, the percentage increase in the prevalence rate of NCDs was higher among females than males. This pattern was reversed during 1995/1996–2004 with a higher percentage increase in the prevalence rate for males than females for almost all the older age groups.
Third, for the whole two-decade period of 1986/1987–2004, the rise in morbidity prevalence rate is seen to be spreading to young-old and old-old age groups instead of oldest-old ages. Between the sexes, the percentage increase in the prevalence rate of NCDs remained almost the same for males in all the older age groups, but for females the prevalence rate of NCDs peaked at old-old ages of 70–74, followed by a decline for older ages of 75 and beyond. Overall, both females and males of old–old ages experienced the largest percentage increase in the prevalence rate of morbidity. Comparatively, females in both the young-old and old-old age groups experienced a higher percentage increase in prevalence of morbidity rate.
Fourth, rural–urban differentials in the prevalence of morbidity rates are also prominent over the two decades. The NSSO document reports the total morbidity prevalence rate (per 1000 persons, crude prevalence rate based on any ailment in the last 15 days of the survey) for the time periods of 1995–1996 and 2004. For aged rural and urban populations, respectively, the crude morbidity prevalence rate increased from 170 and 157, to 283 and 368 respectively (NSSO, 1998, 2006). In a similar way, Table 3 shows pronounced rural–urban differentials among the older population for all three time periods indicating a higher morbidity prevalence rate in urban than rural areas. In 1986–1987, the prevalence rates of NCDs were 48 and 70 for rural and urban older populations, respectively, rose to 71 and 84 in 1995–1996 and escalated to 163 and 313 in 2004. Overall, the prevalence rate of NCDs among the older population increased more than three-fold in rural areas and more than four-fold in urban areas. Over time, the gap in morbidity prevalence rate of the older population between rural and urban areas has widened, with greater increase in the urban than rural areas. It is notable that for rural and urban populations, respectively, the e 60 increased from 13.6 and 14.3 years in 1970–1974 to 15.5 and 17.5 years in 1993–1997, and to 16.5 and 18.6 years in 2003–2007 (r 2=0.98 in rural and r 2=0.97 in urban population; authors' calculation using ASDR provided by SRS (1970–2007)). Additionally, the e 60 of the urban population was ahead of the rural population by approximately 2 years in 1993–1997, and this further increased year-on-year until 2003–2007 for both the populations. In 1995–1996, the prevalence rate of NCDs at age 60 of the urban population was modestly higher than that of the rural population. However, between 1995–1996 and 2004, the percentage increase in the prevalence rate of NCDs among the urban population was twice that of the rural population; the percentage increase in the prevalence rate of NCDs increased by 103 and 214 percentage points, respectively, for the rural and urban populations. Also, the e 60 and the reported morbidity prevalence rate of the urban population remained higher than that of the rural population and, over this time period, the rural–urban differential widened. By sex, the morbidity prevalence rate was higher for females in the urban areas than for other categories, especially during the later period of 2004.
Trends in the prevalence rate (per 1000 population) of non-communicable diseases by age and residence among older population aged 60 and above, India, 1986–1987, 1995–1996 and 2004
Testing morbidity compression
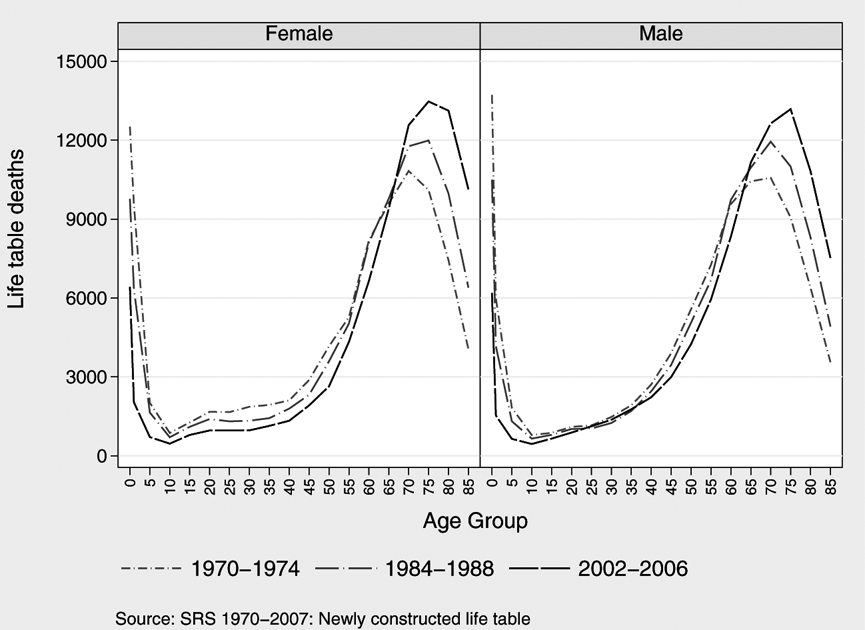
The essential objective of this paper was to test if there is any evidence of morbidity compression or expansion in India. The following measures were used to test if the age pattern of morbidity prevalence is heading towards a compression or expansion phase, and to examine related changes in age patterns of mortality. First, shifts in age patterns of morbidity were examined. Second, the corresponding shifts in the age distribution of deaths were examined. Third, the Disease-Free Life Expectancy (DiFLE) and the health ratio were estimated to determine if there is concomitant progress in morbidity vis-à-vis mortality changes. Documented evidence from the age distribution of deaths suggests a corresponding shift according to a changing age-structural shift in morbidity pattern. The results of the analysis of life expectancies and distribution of deaths revealed that the distribution of death is shifting outwards indicating the postponement of deaths to older ages. Figure 3 shows a bell-shaped distribution of deaths that approximately follows a normal distribution in the older age group (Kannisto, Reference Kannisto2000).
Distribution of age at death for females and males, India, 1970–1974, 1984–1988 and 2002–2006.
Changing age pattern of mortality
In the past more than three decades of 1970–2007, a perceptible decline in infant and adult deaths, complemented by a gradual outward shift in the distribution of age at death, is observed, providing evidence of steady progress of epidemiological transition in India. The distribution of age at death depicted in Figure 3 reveals major age shifts in the concentration of deaths. The earlier period of 1970–1974 was marked by a heavier concentration of deaths in early childhood ages and more even spread of deaths across the older ages 55–85. The even spread of deaths in the older age range of 55–85 in 1970–1974 shifts to the older age range of 60–85 in 1984–1988 and to age range of 65–85 for the recent period of 2002–2006. Consequently, the bell-shaped curve in the older age group is seen to be more peaked with the rise in the mode of the distribution of age at death in recent years. With such significant outward shifting and postponement of deaths, it is worthwhile examining the latent trends in the distribution of deaths across older ages 60 and above.
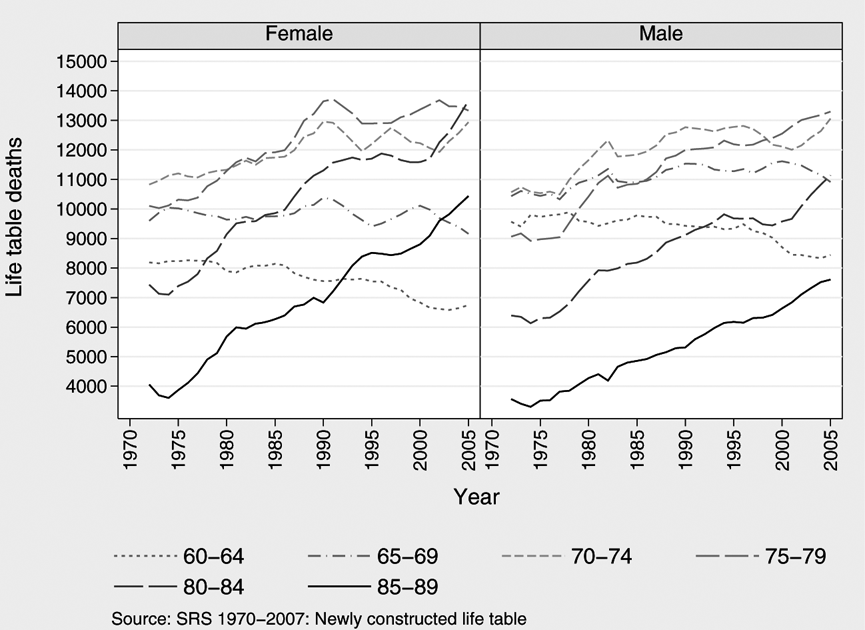
First, in the 1970s, deaths were more concentrated in the older ages of 70–74 but during the subsequent period of 1980–2005 the results indicate a progressive age-cohort shift resulting in a heavier concentration of deaths in the old–old ages of 75–79 years. Second, deaths in the young-old ages of 60–64 and 65–69 remained more or less unchanged throughout the more than three decades of 1970–2007. Third, as a corollary to this age-cohort shift, the numbers of deaths in the oldest-old age groups 80–84 years and 85–89 years have increased substantially (Fig. 4).
Trends in death at older ages for females and males, India, 1970–2007. Each year on the x-axis represents the moving average of five continuous years.
Overall, the age pattern of mortality demonstrates a significant rise and heavier concentration of deaths in the oldest-old ages of 75 years and beyond for the recent period of 2004 as a result of a changing pattern of morbidity on account of a rising prevalence rate of NCDs at older ages. Therefore, together with outward shifting, both the concentration of deaths and increase in the number of deaths in the older age group confirm the postponement of deaths to the oldest-old ages with the steady rise in ex over this time period. The evidence of a changing age pattern of morbidity is consistent with both the theoretical literature and previous evidence-based studies that have illustrated that during the later stage of the age-structural transition in mortality, the rise in NCDs, and particularly cardiovascular diseases, are responsible for high fatality rates (Gruenberg, Reference Gruenberg1977; Fries, Reference Fries1980, Reference Fries1989, Reference Fries2005).
Disease-free life expectancy (DiFLE) and health ratio
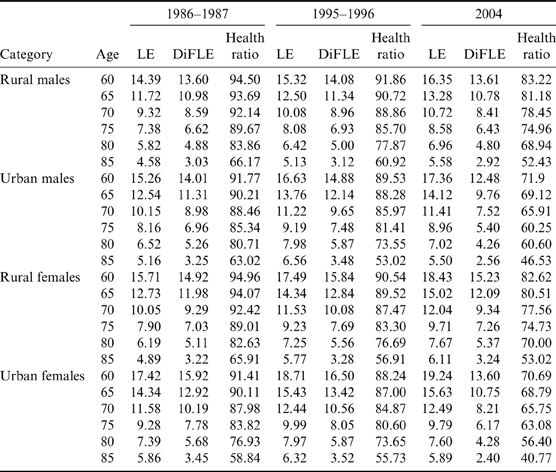
The results of estimated ex, DiFLE and the health ratio were compared over time (1986/1987–2004) by residence and sex. The results presented in Table 4 demonstrate potential evidence for whether the age pattern of morbidity in India is heading towards a compression or expansion phase. The results reveal for the first time insights into the age-cohort shift in morbidity and mortality patterns. Across all categories of residence and sex, the health ratio shows a sustained decline during 1986/1987–2004. Between the two consecutive periods of 1986/1987–1995/1996 and 1995/1996–2004, the health ratio declined more markedly during the later period.
Trends in DiFLE, health ratio by sex and residence for older population aged 60 and above, India, 1986–1987, 1995–1996 and 2004
By residence and sex, for rural males of young-old ages of 60–64, the health ratio declined from 94% in 1986–1987 to 92% in 1995–1996 and to 83% in 2004 with rising ex. The decline in the health ratio during the later period was markedly larger than the earlier period. Parallel to this, between 1986–1987 and 1995–1996, the percentage increase in unhealthy years was 57% and during 1995–1996 to 2004 the percentage increase in unhealthy years was 120%, a manifestation of increasing trend in the unhealthy years over the time period. The percentage increase in the unhealthy years during the entire period of 1986–1987 to 2004 represents a highly pronounced increase of 246%.
By age group, during the later period of 1995–1996, the percentage increase in unhealthy years was higher for the young-old with a gradual decline across the ages. However, the percentage decrease in the health ratio is larger for the old–old population with increasing ex. During the whole three-decade period, the largest decline in the health ratio is observed for the oldest-old aged 75–79, characterized by the largest decline in DiFLE and significant increase in ex.
For rural females of young-old ages of 60–64, the health ratio declined from 95% in 1986–1987 to 91% in 1995–1996 and to 83% in 2004. Analogous to the pattern of results observed for rural males, the decline in the health ratio was remarkable during the later period of 1995/1996–2004. The percentage increase in the unhealthy years on average tripled during the entire time period of 1986/1987–2004 and almost doubled during the later period of 1995/1996–2004 for the same age group and remained higher for females than males across all ages. However, in contrast to rural males, the percentage increase in unhealthy years was larger during the early period than the later period of 1995/1996–2004 for all ages. Throughout the two-decade period of 1986/1987–2004, females were at greater risk of poor health as both unhealthy years for respective years and the percentage increase in unhealthy years was larger for females than males for all ages. The decline in the health ratio was markedly pronounced for the oldest-old, attributable to the lower increase in the DiFLE and utmost increase in the ex. Concomitantly, the decline in the health ratio was higher for young-old and old-old males, compared with the greater decline in the health ratio for the oldest-old males.
The results for the urban area show a remarkable decline in the health ratio both for males and females. Predictably, urban compared with rural females have a lower health ratio and higher ex among all the categories of residence and sex. For urban females of young-old ages of 60–64, the health ratio declined from 91% in 1986–1987 to 88% in 1995–1996 and more sharply to 71% in 2004. Among urban males, the health ratio declined from 92% in 1986–1987 to 90% in 1995–1996 and to 72% in 2004. The number of unhealthy years for the respective period was strikingly larger for the urban than rural older population during the entire period for both males and females. For urban males, the unhealthy years were 1.3 years in 1986–1987, 1.7 years in 1995–1996 and 4.8 years in 2004. Similarly, for urban females, the unhealthy years were 1.5 years in 1986–1987, 2.2 years in 1995–1996 and 5.6 years in 2004. The unhealthy years for urban females remained higher than males for all three time periods. The percentage increase in unhealthy years for the young-old of ages 60–64 increased almost three-fold for both males and females during the entire time period.
Both urban males and females experienced a remarkable percentage increase in unhealthy years during the later period of 1986/1987–2004. For both sexes, the percentage increase in unhealthy years declined across the age groups. The health ratio declined during the entire period of 1986/1987–2004 and more pronouncedly during the later period of 1995/1996–2004 for all ages. During the later period, among females, the health ratio declined more profoundly in oldest-old ages; however, for males, the health ratio declined both among the young-old and old–old. Overall, through the entire period, as expected, the decline in the health ratio was larger for females than males for all the ages.
It emerges from the above results and discussions that the percentage increase in the unhealthy years increased for all the age groups during 1986/1987–1995/1996 and 1995/1996–2004, with more pronounced increase during the later period of 1995/1996–2004. For females, the results reveal an average decline of 20% in the health ratio, and of this 16–17% of this decline was contributed during 1995/1996–2004. The corresponding declines for males were 13% and 7–9%. Overall, urban females were most vulnerable as the percentage increase in unhealthy years was markably higher while ex increased modestly and the health ratio declined most.
Discussion and Conclusion
This study was a systematic effort to assess the structural changes in the age pattern of morbidity vis-à-vis mortality in India and determine the stage and foreseeable consequences of epidemiological transition. Overall, the results reveal a manifold rise in morbidity prevalence rate in India over the past more than two decades of 1986/1987–2004, with a more pronounced rise during the recent period of 1995/1996–2004. This trend of escalating morbidity prevalence rate was almost exclusively contributed by the mounting burden of chronic non-communicable diseases resulting from the heavier increase in these in the older age groups, supplemented by a moderate rise for adult ages of 40–60. These results substantiate an emerging pattern of premature onset of chronic disease among Indian adults as early as age 40 compared with more developed countries where the onset of chronic diseases begins much later at around age 55 and beyond. The acceleration in morbidity prevalence rate that commences for adults from age 40 moves up in the slope to peak at the old-old ages 70–74.
The overall prevalence rate of NCDs for older persons aged 60 years and above revealed an almost three-fold increase with a relatively higher rate of increase during later period of 1995/1996–2004 compared with the earlier period of 1986/1987–1995/1996 signalling greater progress in epidemiological transition in the later period. Such a large percentage change in the prevalence rate of NCDs points to significant age-structural changes in morbidity pattern. This transition in age patterns of morbidity is consistent with the rise in the ex.
The prominent feature of epidemiological transition arising from the manifold rise in the prevalence rate of NCDs is the swift rise in the prevalence of cardiovascular disease, diabetes, bronchial asthma, heart disease and disorders of joint and bones. The rise in the morbidity prevalence rate of NCDs was more pronounced for urban than rural older adults and for older females than older males. Parallel to this age-structural change in morbidity, the ex of females has increased faster and greater than for males over the last two 10-year periods.
The results provide remarkable insights into the concomitant pattern of changes in mortality vis-à-vis morbidity change. In the past more than three decades of 1970–2007, there has been a perceptible decline in infant and adult deaths complemented by a gradual outward shifting in the age distribution of deaths, indicating again evidence of the steady progress of epidemiological transition. Secondly, the age pattern of mortality provides evidence of a significant rise and heavier concentration of deaths in the oldest-old ages of 75 years and beyond for the recent period of 2004. Thirdly, the shifting concentration of mortality to oldest ages is directly linked to changing pattern of morbidity resulting from the rising prevalence of NCDs and degenerative diseases in the older ages. The results confirm that the ongoing demographic transition in India with its variants across the states, while driving concurrent age-structural transition of the population, also leads to a major shift in the age patterns of morbidity vis-à-vis mortality, which emerges as the critical intervening variable of the swift progress in epidemiological transition.
Furthermore, it emerges from the results that the percentage change in unhealthy years was about equal across age groups during 1986/1987–1995/1996, but during 1995/1996–2004 the highest percentage change in unhealthy years was among the young-old ages of 60–70. The duration of unhealthy years decreased profoundly with age, sustaining a high morbidity prevalence and heavy concentration of poor health in young-old ages, especially for females. Correspondingly, the health ratio declined overtime for all older age groups with a more pronounced decline in the oldest-old ages in the recent period and for young-old than the oldest-old ages in the later period with modest decline in young-old ages.
The shift in the declining trend of the health ratio from oldest-old to young-old ages, consistent with the remarkable increase in prevalence rate of NCDs, clearly marked the spread of high morbidity prevalence rate to the older ages. The aforementioned variants in morbidity pattern by age and increase in ex over time signal the steady progress of epidemiological transition in the later period.
Overall, the results confirm that expansion of morbidity is in progress in India, with heavier and cumulated concentration of morbidity in older ages. The increase in the proportion of population in poor health with increasing ex corroborates that relative expansion of morbidity is in progress and this outcome holds true for all categories of population: rural, urban, male and female. The expansion of morbidity was more pronounced in the recent than earlier period. The rise in the prevalence rate of chronic/degenerative diseases not only in older ages but, concomitantly in younger ages, is expected to result in the inevitable spread of morbidity over young adult ages leading to sustained expansion of morbidity over time, with increase in ex. The structural shifts in age patterns of morbidity signify that India is currently shifting to the third stage of epidemiological transition while contemporaneously passing from the third to fourth stage of demographic transition.