INTRODUCTION
The main aim of selection in crop improvement is to increase productivity; thus, selecting to ensure the stability of yields in the face of adverse environmental conditions (such as water deficit) is of great importance. Drought reduces the availability of water to plants, leading to reduced yields, and is currently the main factor limiting the productivity of crops grown in Mediterranean areas. According to climate predictions, drought will become worse in the Mediterranean Basin as the century progresses. It is therefore vital for the future management of Mediterranean agroecosystems that the physiological mechanisms leading to water-efficient crop growth are understood.
In recent decades, great efforts have been made to increase the potential yield of wheat (Sayre et al. Reference Sayre, Rajaram and Fischer1997), maize (Ding et al. Reference Ding, Wang, Jiang, Liu, Niu and Gao2005) and soybean (Morrison et al. Reference Morrison, Voldeng and Cober1999). However, the improvements made have not been so great under drought conditions. To reduce the difference between the potential and the actual yield in drought-prone environments, it is necessary to select plants with physiological traits conferring drought tolerance. If this quest is to be efficient, both traditional plant breeding methods and molecular methods of improvement need to be explored (Cattivelli et al. Reference Cattivelli, Rizza, Badeck, Mazzucotelli, Mastrangelo, Francia, Marè, Tondelli and Stanca2008).
Knowledge of the physiological traits that limit yields under conditions of water deficit has improved in recent years (Richards et al. Reference Richards, Rebetzke, Condon and van Herwaarden2002). This has created new opportunities for plant improvers who, in selecting for optimal grain yield, can now focus on certain traits (Reynolds et al. Reference Reynolds, Singh, Ibrahim, Ageeb, Larque-Saavedra and Quick1998, Reference Reynolds, Rajaram and Sayre1999). Among these, photosynthetic capacity is one of the most important.
The availability of water is one of the main environmental factors limiting photosynthesis (Munns Reference Munns2002). Under drought conditions, photosynthesis is reduced since the diffusion of CO2 towards the inside of the leaf is impeded, mainly as a consequence of reduced stomatal and mesophyll conductance (Flexas et al. Reference Flexas, Bota, Loreto, Cornic and Sharkey2004). This reduction in photosynthesis has a direct effect on crop growth and yield (Dubey Reference Dubey and Pessarakli2005). Studies performed on different crops have indicated that the improvement of yield is associated with increased photosynthetic capacity (Fischer et al. Reference Fischer, Rees, Sayre, Lu, Condon and Larque-Saavedra1998; Morrison et al. Reference Morrison, Voldeng and Cober1999; Reynolds et al. Reference Reynolds, Delgado, Gutiérrez-Rodríguez and Larque-Saavedra2000, Reference Reynolds, Hobbs and Braun2007; Ding et al. Reference Ding, Wang, Jiang, Liu, Niu and Gao2005). This is important to remember in the improvement of cereals: factors involved in photosynthesis (A), such as leaf chlorophyll concentration (Chl) and stomatal conductance (gs) can be used as selection criteria when trying to identify the genotypes that are best adapted, and that provide the highest yields, in early generations of selected plants (Gutiérrez-Rodríguez et al. Reference Gutiérrez-Rodríguez, Reynolds and Larque-Saavedra2000; Labuschagne et al. Reference Labuschagne, Verhoeven and Nkouanessi2008).
Although physiological traits have not been consciously used in traditional plant improvement programmes and have not been taken into account as possible means of obtaining higher yields, some have been indirectly selected (Morrison et al. Reference Morrison, Voldeng and Cober1999; De Vita et al. Reference De Vita, Nicosia, Nigro, Platani, Riefolo, Di Fonzo and Cattivelli2007). However, their use in genetic improvement would permit efficient selection, providing genotypes better adapted to stress conditions more quickly. The incorporation of such criteria in improvement programmes is now possible, thanks to the technical developments of recent decades, which allow physiological variables to be measured in the field with relative ease (Araus et al. Reference Araus, Slafer, Reynolds and Royo2002; O'Neill et al. Reference O'Neill, Shanahan and Schepers2006; Brennan et al. Reference Brennan, Condon, Van Ginkel and Reynolds2007).
Chl is one of the traits that should be taken into account, owing to its close relationship with rate of photosynthesis (Gummuluru et al. Reference Gummuluru, Hobbs and Jana1989). The loss of chlorophyll is a common response of plants to various different types of stress (Tenga et al. Reference Tenga, Marie and Ormrod1989; Tenga & Ormrod Reference Tenga and Ormrod1990) and is largely linked to a reduction in the exchange of gases. During grain filling in wheat, the reduction in the photosynthetic rate at high temperatures is associated with a reduction in Chl (Reynolds et al. Reference Reynolds, Delgado, Gutiérrez-Rodríguez and Larque-Saavedra2000). A more direct relationship between Chl and grain yield has been reported in the present study, with the net rate of photosynthesis strongly related to chlorophyll loss during the grain-filling period (GFP) in cereals. In addition, a genetic association has been recorded between Chl and yield (Gutiérrez-Rodríguez et al. Reference Gutiérrez-Rodríguez, Reynolds and Larque-Saavedra2000; Reynolds et al. Reference Reynolds, Delgado, Gutiérrez-Rodríguez and Larque-Saavedra2000). Drought damage caused in chickpea during the reproductive phase is less when the crop is able to maintain Chl despite the intensification of water deficit (Nayyar et al. Reference Nayyar, Kaur, Smita, Singh, Dhir and Bains2005). Therefore, physiological traits could be useful for selecting the genotypes that would be more suitable for specific climatic areas.
The aims of the present work were: (1) to analyse the variability of a number of physiological traits in 12 barley genotypes; (2) to relate the yield of these genotypes to their physiological performance during grain filling under irrigated and terminal drought conditions and (3) to examine the differences in physiological performance between the varieties traditionally used in the study area and breeding lines in terms of their physiological traits.
MATERIALS AND METHODS
Plant material and crop growth
All trials were performed at the El Encín research station, belonging to the Instituto Madrileño de Investigación y Desarrollo Rural Agrario y Alimentario (IMIDRA) and located in Alcalá de Henares, Madrid (40°32′N, 3°19′W, 600 m asl). Plants were grown in a fluventic Xerocrept-type soil (INIA 1977) with a sandy loam texture, the natural soil of the area, in a transparent rain shelter.
The experimental material included six commercial barley cultivars widely used in the central area of the Iberian Peninsula: two six-rowed cultivars (Albacete and Plaisant) and four two-rowed cultivars (Reinette, Tipper, Viva and Ruth). Three improved breeding lines from the International Maize and Wheat Improvement Center (CIMMYT) were also tested in the experiment, ND66 and ND77 (two-rowed genotypes) and ND75 (a six-rowed genotype). Three lines from the International Center for Agricultural Research in the Dry Areas (ICARDA), L31 and L47 (two-rowed genotypes) and L40 (six-rowed genotype), completed the plant material examined. These genotypes were selected to compare the responses of different widely used varieties and breeding lines specifically selected for their tolerance to water deficit.
All seeds were sown in November inside a rain shelter that was divided into a water deficit treatment area and an irrigated (control) treatment area, separated by a central corridor 1·5 m wide. Water availability in the control treatment was maintained at field capacity until the beginning of maturity, i.e. Zadoks growth stage (ZGS) 78 (Zadoks et al. Reference Zadoks, Chang and Kozak1974). Irrigation was withheld in the water deficit treatment when genotypes reached ZGS 41 (flag-leaves fully expanded); the water deficit period lasted 45–54 days, depending on genotype. More information about the phenological and agronomic traits of the genotypes can be found in González et al. (Reference González, Martín and Ayerbe2007).
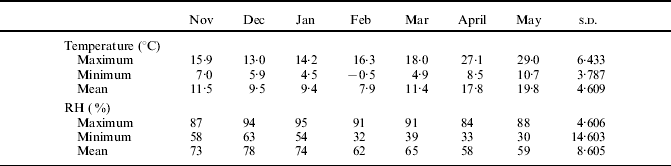
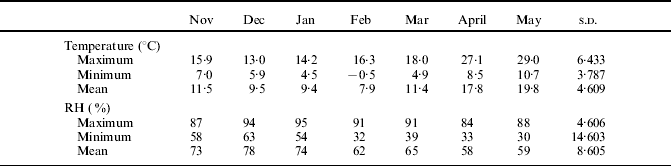
Both the control and water deficit areas were divided into four blocks, each containing 12 subplots (2×0·81 m), i.e. one for each of the barley genotypes, which were distributed randomly among them. Plant density was 100 plants/m2. A border of 0·4 m was established around each subplot. A compound fertilizer (0·2 g N/m2, 0·08 g P2O5/m2 and 0·16 g K/m2) was applied at the rate of 20 g/m2 before sowing. Temperature and relative humidity readings were taken daily from sowing until maturity (Table 1) using a thermohygrograph located inside the rain shelter.
Monthly means of maximum, minimum and mean temperature and relative humidity in the rain shelter during the growing season
The phenological characteristics of the different genotypes were determined by counting the days from sowing to ear emergence (when the spike was entirely free of the flag leaf in half of the shoots, ZGS 55) and to maturity (when the entire shoot become yellowish, ZGS 92). The GFP was taken as the number of days from ear emergence to maturity. When crop maturity was reached, the central 1 m2 of each subplot was cut and threshed to determine the grain yield of each genotype.
Gas exchange measurements
The net assimilation rate (A) and the stomatal conductance (gs) were measured using a LICOR-6400 infra-red gas analysis system (LiCor Inc., Lincoln, NE, USA). Measurements were taken weekly (on five dates) for the flag leaves under full sun conditions between 10·00 and 14·00 h, from the start of the water deficit treatment until crop maturity (i.e. from ZGS 41 to ZGS 79). Only overall mean values of the gas exchange measures throughout the developing period of the flag leaves are presented in the current paper; thus each point in the graphs corresponds to an average value of five sampling dates. Mean photosynthetically active radiation (PAR) values during the measures were in the range of 1100–1500 μmol/m2/s.
Three plants per genotype and water treatment were examined in these gas exchange measurements. Data were expressed on the basis of the projected leaf area.
Leaf Chl
Calibration of soil plant analysis development (SPAD) units for the determination of leaf Chl
Leaf Chl (mg/m2) can be measured easily and without destructive sampling by measuring leaf colouration with a portable SPAD 502 chlorophyll meter (Minolta, Japan). However, accurate and specific calibration is required to properly relate SPAD units to the Chl of each crop species. This calibration was undertaken in the previous crop-growing season, when the same experimental design, genotypes, treatments and experimental facilities were used in similar experiments.
SPAD measurements were recorded on three sampling dates between the appearance of the flag leaf till the end of the crop cycle. Four plants of each of the different genotypes and water treatments were randomly selected for this purpose. Measurements were always taken at the centre of the flag leaf on the main stem. The same leaf surface area used for this measurement was then used to determine the Chl content in the laboratory.
Total Chl was determined by homogenizing leaf samples in N,N-dimethylformamide (DMF) and measuring the absorbance at 647·2 and 664 nm using a Heλios α spectrophotometer. The total Chl was calculated according to Inskeep & Bloom (Reference Inskeep and Bloom1985).
The ratio of total chlorophyll to SPAD units was determined from the full set of gathered data; no significant differences were seen between regression lines for the different genotypes or treatments (water deficit and control; data not shown).
The correlation between the mean Chl (measured in the laboratory) and the corresponding SPAD values in barley was expressed as

The high correlation coefficient allowed the use of SPAD values in the prediction of barley Chl with a high degree of confidence, as is the case for other crops (Tenga & Ormrod Reference Tenga and Ormrod1990).
Chlorophyll estimates
Estimates of Chl were made in situ on the same flag leaves used for A and gs measurements, using a SPAD-502 chlorophyll meter. Four SPAD readings were taken per leaf on four randomly selected plants per subplot (genotype and water treatment) on five different sampling dates. The Chl was estimated using the equation derived from the calibration curve Chl/SPAD units described above.
Statistical analysis
Genotype and water treatments were analysed by performing two-way ANOVA analyses for each parameter assessed. When significant differences between treatments were detected (P<0·05), mean differences were compared with a t test. The relationships between A, yield and the different variables examined were analysed by determining Pearson's correlation coefficients. Significance was determined using the Student's t test. All calculations were performed using Statistica 5.1 software (Statsoft 1997).
RESULTS
Exchange of gases: mean net photosynthesis, mean stomatal conductance and maximum stomatal conductance of the different genotypes
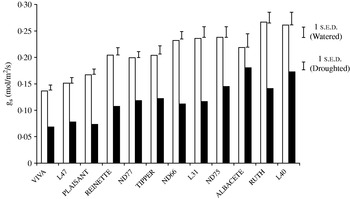
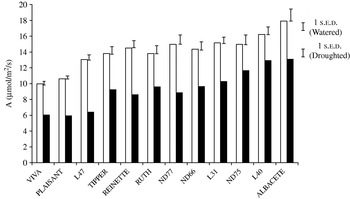
The terminal water deficit led to significant reductions (P<0·001) in A (by 34% compared to control) and gs (by 43%) over the sampling period (Figs 1 and 2). The mean A was reduced by 20% (in line L40) and 51% (in line L47). The gs was reduced by 17% (in cv. Albacete) and 56% (in cv. Plaisant).
Stomatal conductance (gs) per genotype: irrigated treatment mean (open columns) and drought treatment mean (closed columns). Genotypes are arranged on the x-axis in order of overall mean values. The bar above each pair of columns is the s.e.d. for comparing irrigated and non-irrigated means for the variety. The bars at top right indicate the s.e.d. for comparing varieties under either irrigated or non-irrigated conditions.

Photosynthetic activity (A) per genotype: irrigated treatment mean (open columns), drought treatment mean (closed columns). Genotypes are arranged on the x-axis in order of overall mean values. The bar above each pair of columns is the s.e.d. for comparing irrigated and non-irrigated means for the variety. The bars at top right indicate the s.e.d. for comparing varieties under either irrigated or non-irrigated conditions.

Genotype had a significant (P<0·001) influence on the gas exchange variables measured. The genotypes were grouped subjectively into three categories – high, medium and low A and gs (classification according to these traits nearly always coincided). Cv. Albacete and line L40 showed the highest gs and A values under both irrigated and water deficit conditions, closely followed by lines ND75 and L31; all belong to both the high and medium A groups. Cv. Ruth was the only genotype in which classification in terms of A and gs did not match; its high mean gs value classified it within the high category alongside cv. Albacete and line L40, but its mean A value classified it within the medium category for this variable. Cvs Viva and Plaisant and line L47 had the lowest A and gs values, although the photosynthetic activity of L47 was intermediate between the medium and low categories. Lines ND66 and ND77 and cvs Reinette and Tipper fell into the medium category with respect to both A and gs.
The similarity in the physiological performance of the genotypes in terms of the response of A and gs to water deficit is due to the strong correlation of these variables (r=0·86, P<0·001). The latter relationship is even stronger when only the gs values recorded under water deficit conditions are taken into account (r=0·94; P<0·001 v. r=0·67; P<0·001 for the control).
The genotype×treatment interaction had a significant effect on gs (P<0·01). The genotype ranking established in terms of mean gs varied depending on the treatment applied. This was particularly noticeable for the cvs Albacete and Ruth. The mean gs of Albacete differed the least between the control and water deficit treatments (17%), while the rest of the genotypes closed their stomata more noticeably under water deficit conditions, with reductions in gs ranging from 33 to 56%. Thus, under water deficit conditions, cv. Albacete (along with line L40) was the genotype with the highest gs, while under irrigated conditions it showed only medium gs values. Cv. Ruth, in contrast, experienced a 47% reduction in gs under water deficit conditions. This genotype (together with L40) showed the highest mean gs values under the control conditions, but under water deficit conditions they fell into the low category. The remaining genotypes showed reductions of 45% in their mean gs values under water deficit conditions but, when taking all the gs results together, remained in the groups described above.
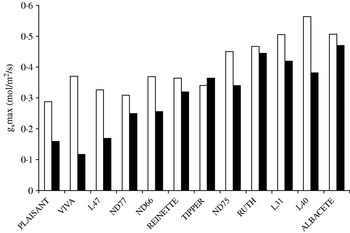
The mean of the highest 0·05 of the gs values for each genotype and treatment (gsmax) was calculated (Fig. 3). Cvs Albacete, Ruth, Tipper and Reinette and line ND77 had similar gsmax values under both conditions, while line 40 and cv. Viva showed the greatest differences. Under water deficit conditions, cvs Albacete and Ruth and lines L40 and L31 had the highest gsmax values (mean=0·47 mol/m2/s), while cvs Plaisant and Viva and line L47 had the lowest (mean=0·24 mol/m2/s).
Maximum stomatal conductance (gsmax) recorded per genotype: irrigated treatment mean (□) and drought treatment mean (▪). Genotypes are arranged on the x-axis based on overall mean values.

Chl
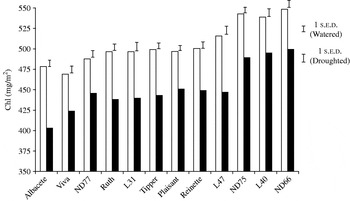
Figure 4 shows the Chl of the different genotypes under the different cultivation conditions. The Chl was always higher in the control (irrigated) treatment, independent of genotype (P<0·001). The mean loss of chlorophyll induced by water deficit reached 11%; the effect of water deficit on this variable is therefore less intense than on gas exchange variables.
Foliar Chl per genotype: irrigated treatment mean (□) and drought treatment mean (▪). Genotypes are arranged on the x-axis based on overall mean values. The bar above each pair of columns is the s.e.d. for comparing irrigated and non-irrigated means for the variety. The bars at top right indicate the s.e.d. for comparing varieties under either irrigated or non-irrigated conditions.

Genotype had a significant effect on Chl (P<0·001). The lines ND66, L40 and ND75 form a group with a mean Chl of 519 mg/m2, quite different to that formed by cvs Viva and Albacete with a mean Chl content of 444 mg/m2. The remaining genotypes fell into an intermediate group with a mean value of 472 mg/m2.
The loss of chlorophyll due to water deficit ranged from 8% (line L40) to 16% (cv. Albacete), but the genotype×treatment interaction had no significant effect.
Overall, Chl was significantly correlated with A (r=0·47, P<0·001) and gs (r=0·39, P<0·001). The former correlation was maintained when the data were analysed for the water deficit and control treatments separately (water deficit treatment r=0·52, P<0·001; control treatment r=0·44, P<0·01). The correlation between Chl and gs was somewhat less strong (water deficit treatment r=0·49, P<0·01; control treatment r=0·35, P<0·05).
GFP and yield
Under the climatic conditions of the experimental site, the GFP is April–May. During this period the temperatures recorded were the highest and the relative humidity the lowest of the entire growth cycle (Table 1).
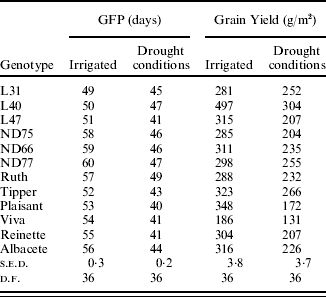
Irrigation treatment had an effect on both GFP and yield in all genotypes (Table 2): the overall duration of grain filling and yield were 18% longer and 27% higher, respectively, in irrigated than in water deficit plots. In the water deficit treatment, cv. Ruth showed the highest yield and the longest GFP followed by line L40, while cvs Plaisant and Viva showed the lowest yield and the shortest GFP.
GFP and grain yield of 12 barley genotypes grown in a rain shelter under irrigated and drought conditions
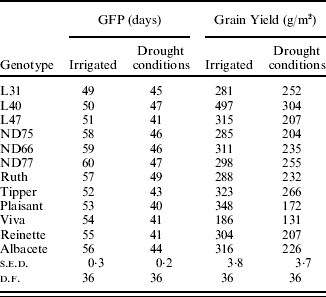
The genotype×treatment interaction had a significant effect on yield and the duration of grain filling, showing that these variables are influenced by the environment for these genotypes. This interaction is seen most clearly in genotypes such as line L31, which in the control treatment had the shortest GFP and provided the lowest yield, yet under water deficit conditions showed above average values for both variables, improving its rank position. The opposite was seen with cv. Plaisant; under the control conditions its GFP and yield were intermediate, but under the water deficit conditions it showed the lowest values (along with cv. Viva) of all the genotypes studied.
A significant correlation was found between the duration of the GFP and both A (r=0·34, P<0·05) and gs (r=0·30, P<0·05) under water deficit and gs (r=0·38, P<0·05) under irrigated conditions.
The grain yield showed a positive, significant correlation with A (r=0·39, P<0·01), gs (r=0·47, P<0·001) and GFP (r=0·43, P<0·01) under water deficit conditions. The photosynthetic rate was the only variable to be significantly related with yield (r=0·33, P<0·05) under irrigated conditions.
Comparisons between breeding lines and traditional varieties
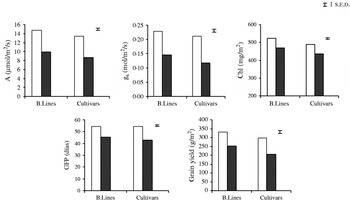
The breeding lines showed significantly higher mean values for all the physiological traits investigated than the traditional varieties (Fig. 5): the mean A and gs values of the breeding lines were 10 and 8% higher, respectively. The percentage reductions in A caused by water deficit were 34 and 32% for the cultivars and breeding lines, respectively, and 44 and 35%, respectively, for gs. The mean reduction in Chl found under water deficit conditions was only 10 and 11% for the breeding lines and the cultivars, respectively.
Breeding lines v. commercial cultivars grown in irrigated (open columns) and drought (closed columns) conditions: stomatal conductance (gs), photosynthetic activity (A), Chl, GFP, grain yield. Vertical bars represent the s.e.d. value at P<0·05.

The breeding lines that showed the greatest A, gs and Chl values were those that provided the highest yields, 13% greater than the cultivars (P<0·01). The breeding lines as a whole had a 7% longer GFP than the cultivars (P<0·001). Although the difference in yield between the water deficit and control treatments was somewhat less for the breeding lines (24%) than for the cultivars (31%), the genotype×treatment interaction had no significant effect.
DISCUSSION
The physiological traits to be used in the selection of genotypes for optimizing yield under stress conditions (such as terminal water deficit) must show intraspecific variability. The present results show that such variability exists among the 12 barley genotypes studied with respect to all the physiological variables examined. Under the control conditions, the variation in A considering all the genotypes assayed was 0·44 a figure that rose to 0·55 under the water deficit conditions. This variability was even greater in terms of gs, 0·63 under water deficit conditions. The least variation between genotypes was seen with respect to Chl, with a maximum change of 19%.
Genotype had a significant influence on A, gs and Chl. The genotypes were subjectively grouped depending on their mean values for these variables. Chl is associated with photosynthetic activity in barley, as indicated by the significant correlation (r=0·52; P<0·001) seen between these variables in the water deficit treatment. Despite the significant correlations of A with gs and Chl the R 2 for the relationship between A and Chl was 0·27; this indicates that some 0·73 of the variability of A cannot be explained by the mean Chl. Other traits, such as osmotic adjustment capacity, can favour A in water deficit conditions (Shangguan et al. Reference Shangguan, Shao and Dyckmans1999). A relationship between Chl and drought tolerance has been seen in chickpea (Nayyar et al. Reference Nayyar, Kaur, Smita, Singh, Dhir and Bains2005) and in wheat, in which the Chl has been directly related to photosynthesis under deficit conditions (Heitholt et al. Reference Heitholt, Johnson and Ferris1991; Chandrasekar et al. Reference Chandrasekar, Sairam and Srivastava2000).
The terminal water deficit treatment affected all the physiological features studied, although gs was the variable most affected by these conditions (with a 43% reduction compared to controls). In addition, it was the variable upon which physiological performance groups could most easily be based. The differences seen in gs between the control and water deficit treatments were greater than those recorded for either A and Chl, both in the breeding lines and traditional varieties (Fig. 5). This high sensitivity of gs has also been reported in wheat (Ritchie et al. Reference Ritchie, Nguyen and Holaday1990; Morgan & LeCain Reference Morgan and LeCain1991) and cotton (Rahman Reference Rahman2005). Stomatal closure is the first response of plants to a lack of water, and the main limitation to photosynthesis provoked by such stress (Flexas & Medrano Reference Flexas and Medrano2002).
In general, the genotypes with high gs in the control treatment maintained high gs values in the water deficit treatment (Fig. 1); cv. Albacete and lines L40, ND75 and L31 fell into this group. These were also the most photosynthetically active genotypes under water deficit conditions, although the results for cv. Albacete are mostly due to its performance during early water deficit – the values obtained in later sampling showed a drastic reduction in photosynthetic activity (data not shown). High photosynthetic activity is directly linked to the delay of senescence and an increase in GFP and yield (Reynolds et al. Reference Reynolds, Balota, Delgado, Amani and Fischer1994; Reynolds et al. Reference Reynolds, Delgado, Gutiérrez-Rodríguez and Larque-Saavedra2000; Ding et al. Reference Ding, Wang, Jiang, Liu, Niu and Gao2005). González et al. (Reference González, Martín and Ayerbe1999, Reference González, Martín and Ayerbe2008) reported lines L40 and L31 to have the greatest capacity of osmotic adjustment: an ability that allows greater drought tolerance since cell turgor is maintained via the net accumulation of solutes (Nayyar & Walia Reference Nayyar and Walia2004; Hamidou et al. Reference Hamidou, Zombre and Braconnier2007). This allows the cells to keep up their metabolic functions at low levels of hydration, thus reducing the effects of water deficit on stomatal opening and photosynthesis. This capacity might explain why lines L40 and L31 were the genotypes to show the least difference in GFP between the control and water deficit conditions. In addition, the maintenance of photosynthetic activity during the GFP allowed line L40 to provide a high yield under terminal water deficit, and line L31 to stabilize its yield despite a lack of water. The correlation of yield with A and GFP under the water deficit conditions indicates the importance of lengthening the GFP under drought and of maintaining active photosynthesis during this period; this favours an increase in seed weight and therefore in yield.
The present results for barley agree with those reported by Gummuluru et al. (Reference Gummuluru, Hobbs and Jana1989), Ritchie et al. (Reference Ritchie, Nguyen and Holaday1990) and El Hafid et al. (Reference El Hafid, Smith, Karrou and Samir1998) for wheat. Those authors reported that the genotypes of wheat tolerant to drought, and therefore those that gave the highest yields under such conditions, showed greater photosynthetic activity than the more susceptible genotypes.
The fact that the group of genotypes with the best physiological performance under water deficit conditions mainly involves breeding lines for arid areas would indicate that their physiological activity was indirectly selected. The mean yield of the breeding lines was significantly greater (13%) than that of the cultivars, and they showed higher gs, A, Chl and GFP values (Fig. 5). The importance of high photosynthetic activity before and around anthesis to increase yield potential has been observed in other cereals, such as wheat (Reynolds et al. Reference Reynolds, Hobbs and Braun2007). Working with soybean, Morrison et al. (Reference Morrison, Voldeng and Cober1999) and De Vita et al. (Reference De Vita, Nicosia, Nigro, Platani, Riefolo, Di Fonzo and Cattivelli2007) reported that the yields of the best current cultivars are more associated with physiological traits that have been selected over the years than with the characteristics of vegetative growth. Studies comparing modern and older hybrids of maize suggest the same; the high yields of new hybrids appear to be associated with the duration of photosynthetic activity over the GFP (Ding et al. Reference Ding, Wang, Jiang, Liu, Niu and Gao2005).
In conclusion, genotypes with medium to high A, gs and gsmax had the highest yields under terminal water deficit, whereas genotypes with the lowest values had the lowest grain yield in these conditions. The present results show the potential – and importance – of using physiological criteria in the selection of barley genotypes that best adapted to water deficit conditions. Selection based on these criteria would be efficient and to ensure that the most appropriate physiological systems are made available for tolerating terminal water deficit and increasing yield.