


Symbols Used
-
ȧ Net accumulation/ablation rate
-
A Flow-law parameter
-
ABL Ablation rate
-
ACC Accumulation rate
-
AL Fitting constant corresponding to the lapse rate
-
B Sliding-law parameter
-
BL Fitting constant
-
C Fitting constant
-
ES Saturation vapor pressure
-
IX Saturation vapor-pressure exponent
-
f Fraction of velocity due to sliding
-
g Acceleration of gravity
-
h Ice-surface elevation
-
H Ice-column thickness
-
k(x, y) Linearization constant for constitutive relationship
-
LAT Distance from the pole
-
m Sliding-law exponent
-
n Flow-law exponent
-
PDD Annual accumulation of positive degree days
-
QII Seasonality factor for the Ith month
-
QSI Seasonality factor for the Ith month
-
QY Seasonality factor
-
ρ Density of ice
-
SHAPE Ice-surface second derivative
-
SLOPE Ice-surface gradient
-
Tf Mean annual free atmosphere isothermal layer temperature
-
TNSL Mean annual air temperature at sea level
-
TS Mean annual air temperature
-
U Column-averaged velocity
-
UF Column-averaged velocity due to flow
-
US Column-averaged velocity due to sliding
-
W Fitting constant
-
X Fitting constant
-
Z Fitting constant
Introduction
Models of the steady-state configuration of the Antarctic ice sheet have been used to explore the derived characteristics (Reference Budd, Jenssen and RadokBudd and others, 1971; Reference Jenssen, Budd, Smith and RadokJenssen and others, 1985), while time-dependent models have been used to hindcast the response of the ice sheet to climatic variations (Reference OerlemansOerlemans, 1982; Reference SchwerdtfegerMacAyeal, 1989; Reference HuybrechtsHuybrechts, 1990). These models have been employed to determine balance velocities and basal stress maps which can be compared with the increasing quantity of field evidence (Reference Alley, Blankenship, Bentley and RooneyAlley and others, 1986; Reference Bindschadler, Stephenson, MacAyeal and ShabtaieBindschadler and others 1987, Reference Bindschadler, Stephenson, Vornberger and Roberts1989; Reference Shabtaie and BentleyShabtaie and Bentley, 1987; Reference Whillans, Bolzan and ShabtaieWhillans and others 1987; Reference Shabtaie, Bentley, Bindschadler and MacAyealShabtaie and others, 1988).
Controversy exists concerning the behavior of the ice sheet during the last ice age, especially with respect to its response during the termination. Local alpine glaciers may or may not have responded in the same way that larger outlet glaciers, themselves measures of the larger ice sheet, behaved. To unravel the chronologies of such critical regions as the Dry Valleys (Reference Denton, Prentice, Burckle and TingeyDenton and others, 1987) requires an understanding of the interactions between such different systems.
Understanding how the ice sheet will behave in response to such human-moderated climatic changes as the potential CO2 warming requires such modeling experiments. While on the surface a climate warming might be expected to result in the reduction of ice in Antarctica, there exists the potential for some limited growth, due to the increasing accumulation rates that warmer temperatures might produce. With so little ablation in present Antarctica, a considerable warming would need to occur before the increasing ablation dominated the simultaneously increasing accumulation rates.
In this paper, a solution to the time-dependent mass-continuity equation using the finite-element method is presented. Like any continuity-driven model, the primary input consists of the mass balance at a particular time or point in the modeled region. For models dealing with derived characteristics or steady-state configurations of the present ice sheet, the present, albeit incompletely known, accumulation patterns suffice. Time-dependent studies of the ice sheet’s past or future behavior require some parameterization of the ice-sheet climate with a sufficiently simple “knob” that can be adjusted to reflect experienced or expected climatic change. Only with such a parameterization can one address such questions as whether the ice sheet will shrink or grow in response to CO2 warming, or how the ice sheet changed during the last ice age and its termination.
As the ice sheet grows or shrinks in response to changing climate, it will necessarily affect its own climate in a complex fashion. While the ideal might be to couple the ice-sheet model with a global-circulation model to predict changing mass-balance patterns, this is at present impractical. A more tractable approach is to define a parameterization of the ice-sheet climate in terms of simple meteorological quantities such as the ambient air temperature over the ice sheet or the potential water-vapor content of the atmosphere. Such a mass-balance scheme should have the potential for both increasing ablation rates as well as increasing accumulation rates as the climate warms.
The mass-balance scheme presented here depends primarily on the specified mean annual sea-level temperature as the “knob” with which we adjust climate. The temperature at any point on the ice sheet is obtained from an adiabatic lapse rate, from which the saturation vapor pressure at elevation is calculated. From this quantity, an accumulation rate dependent upon surface elevation and slope can be obtained by fitting to present accumulation rates. Ablation rates can be estimated by applying a seasonality factor which simulates the seasonal variation in temperature. Comparison with regions of Greenland, where ablation is presently occurring, allows parameterization of this process. Net mass balance is then simply the difference between these two rates.
The Model
Glaciological equations
This model has been described in detail in Reference Fastook and ChapmanFastook and Chapman (1989) and Reference Fastook and BrownFastook (1990). The model consists of a finite-element solution of the two-dimensional (mapplane) time-dependent mass-continuity equation, given in terms of the net annual mass balance, ȧ, by the following expression.
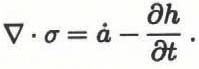
To cast this as a differential equation, one must relate the flux, σ, to the ice-surface elevation, h, through a constitutive equation. For non-Newtonian fluids, such as ice, this involves a non-linear relationship depending on the ice-surface elevation, the thickness and the surface slope.
We can, however, linearize this by absorbing all dependencies on h and all non-linearities in the surface slope into a spatially non-uniform proportionality constant k(x, y). This constitutive equation, relating ice flux to surface slope, can be expressed by

The material coefficient k(x,y) is dependent upon the form of the flow and sliding laws.
We use Glen’s flow law (Reference GlenGlen, 1955) for the component of velocity due to internal deformation of the ice, given by the following expression.

The sliding law used here is a general relationship for beds at the melting point developed by (Reference WeertmanWeertman 1957, Reference Weertman1964) and given by the following expression.

The column-averaged ice velocity for a combination of these two modes of motion is

where f is the fraction of velocity due to sliding. For existing ice sheets, f can be used as a parameter to “tune” the model. For reconstructing ice sheets from the past and for extrapolating future behavior, f can be estimated from various erosional features found in the glacial geologic record (Reference Hughes, Denton and HughesHughes, 1981).
The form of k(x,y) is obtained by combining Equations (3), (4) and (5), and substituting into Equation (2):

This shows the dependence of the material coefficient on ice density, gravity, flow-law constant and sliding-law constant (both of which are dependent on ice temperature, ice-crystal size, impurity content, etc.), ice thickness and surface gradient.
Substituting the constitutive law expression for σ from Equation (2) into continuity Equation (1) yields the following differential equation in h.

The presence of k(x, y) in the continuity equation incorporates the physics of the flow and sliding laws into the problem, since its form depends on the form of the flow and sliding law. Different treatments of the flow and sliding process change the form of k(x, y) but do not affect the method with which the problem is solved. An entirely different sliding relationship can be substituted without materially affecting the finite-element method of obtaining a solution to this equation.
The finite-element method
The finite-element method is especially well suited for solving equations such as Equation (7). The method assumes linear spatial interpolante for the solution of this differential equation, turning the problem into a set of algebraic equations which can be solved by ordinary matrix methods (Reference Becker, Carey and OdenBecker and others, 1981). The solution of these algebraic equations corresponds to the values of h at each of the nodal points defining the grid of elements used to represent the domain of the problem. Boundary conditions can either be specified ice-surface elevations or specified ice fluxes across the boundary. Material properties (such as the linearization constant, the net accumulation rate, the flow-law constant, the sliding-law constant or the fraction of the velocity due to sliding) can be specified for each node.
Due to the non-linearity in the equation represented by the linearization constant, k(x, y), we must proceed to the solution by an iterative technique. Initially, a uniform value is chosen for k(x, y) and a solution for h at each node is found. From this a new non-uniform k(x, y) is obtained from Equation (6) and a new solution for h is obtained. This process is repeated a handful of times until the values of the solution stop changing.
The mass-balance relationship
The primary input, besides the bedrock topography, is the mass balance at each node. In modeling existing ice sheets, measured values of accumulation rates can be used. However, if experiments dealing with changing climate are desired, some self-consistent mass-balance relationship that accounts for changes in the ice configuration is necessary. In the ideal, we would couple such an ice-sheet model with a global-circulation model (GCM), so that changing topography and albedo would enable us to affect the ice sheet’s own climatic conditions. With GCMs too expensive and complicated, a simpler parameterization of the ice-sheet’s effect on local climate is required for efficient experimentation. We developed a mass-balance relationship based on empirically fitting to present Antarctic accumulation rates. This relationship depends on surface elevation, surface slope, and latitude. Complementary ablation rates are based on south Greenland mass-balance data, and are appropriate for modest warming of the Antarctic climate. The climate is adjusted by varying the mean annual sea-level air temperature, TNSL , which provides a starting point for all temperature calculations at present sea level. We understand the limitations of this very simplified model of the mass balance but feel that it is an appropriate approximation to the actual situation.
The mass-balance relationship follows Reference Fortuin and OerlemansFortuin and Oerlemans (1990) with modifications suggested by Reference Jouzel and MerlivatJouzel and Merlivat (1984) and Reference Braithwaite, Olesen and OerlemansBraithwaite and Olesen (1989).
Basically, this involves an annual average surface temperature (Ts, °C) derived from a lapse rate (AL, °C km-1) and modified for distance from the pole (BL °C° lat.-1)

From this a free atmosphere-isothermal layer temperature (TF, K) is obtained from a standard meteorological relationship.

This temperature is used to calculate the saturation vapor pressure (Es, mbar) from a standard meteorological relationship.


Finally, accumulation rate (AACC, m year-1 ice equivalent) is obtained from a fit of accumulation rate as a function of saturation vapor pressure and surface slope (SLOPE m km -1).

Ablation is modeled by calculating the number of positive degree days based on assumptions of the seasonality as a function of latitude. A seasonality factor is calculated that represents incoming solar radiation at the top of the atmosphere as a function of latitude and month. From published values (Reference SellersSellers, 1965), we obtain a latitudinal slope, QSI (ly d– °lat.-1), and intercept, QSI (ly d-1), from which an annual mean is calculated by the following expression.

A monthly mean temperature (°C) is calculated from the mean annual temperature as a function of the difference between the annual mean and the monthly solar radiations. The proportionality constant is obtained by linear regression from 28 stations where measured monthly temperature and calculated solar radiation could be compared (Reference SchwerdtfegerSchwerdtfeger, 1984).

The annual sum of positive degree days

is used to calculate the ablation rate

where the proportionality constant applies to West Greenland ablation data (Reference Braithwaite, Olesen and OerlemansBraithwaite and Olesen, 1989). Finally, the net mass balance is the difference between these two.

Reference Fortuin and OerlemansFortuin and Oerlemans (1990) estimated parameters for the various fitting equations from available Antarctic data. We have used the Scott Polar Research Institute map (Reference Drewry and DrewryDrewry, 1983) as digitized by Budd. These data provide surface elevation, ice thickness, bedrock elevation, surface temperature, accumulation rate and balance velocity for a 20 km grid centered on the South Pole (241 × 241 grid). We differ slightly from their published values in that we have lumped together the escarpment and interior values while excluding the ice shelves. This was done to avoid a discontinuity in mass-balance values that their curves generated at the escarpment/interior boundary.
The following are the values obtained for the monthly seasonality factors. For QII we use 960, 1036, 1200, 825, 330, 90, 150, 600, 1200, 1020, 930 and 850°C. For QSI, we use 0.667, 4.6, 11.667, 9.167, 3.667, 1.0, 1.0, 1.667, 6.667, 12.0, 6.333, 0.333 and -3.333°C° lat. Other fitting parameters obtained include AL = -9.623 × 10 -3 °C m-1 B = -0.5469°C° lat., C = 24.98°C, W = 0.1914 m year-1 mbar-1, X = 9.2228 × 10⁻³ m year-1 and Z = -7.389 × 10⁻³ m year-1, where these are all obtained by linear regression with the Scott Polar Research Institute map data.
Figure 1 shows a comparison between the fitted values generated by Equation (20) and those presented by Reference Bindschadler, Stephenson, MacAyeal and ShabtaieDrewry (1983). Major discrepancies occur mainly in the Antarctic Peninsula region and along the Amundsen Sea coast where the fit consistently underestimates the net accumulation rates.
Comparison of present Antarctic mass balance (a) with that obtained from Equation (20) (m year-1 ice equivalent) (b).

Calibration of the model
With a mass-balance relationship such as the one described in the previous section, we can begin to look at the effects of warming or cooling the climate of Antarctica. To see the subtle effects that such changes produce, we must be confident that the other unknown parameters are defined in such a way that for the present climate we will obtain a steady-state configuration for the ice sheet which agrees well with the present configuration.
This is done in an iterative fashion by defining the spatially non-uniform linearization constant, k(x, y) from the present ice-sheet surface. But first we must define all of the 1772 nodal-point values of the flow-law constant, the sliding-law constant and the fraction of the velocity which is due to sliding (A, B and f in Equation (6)).
We do this by initially assuming a uniform value for each of these parameters, obtaining a solution, h, for several time steps, and then examining each of the nodalpoint surface-elevation values relative to the known elevation at that point. The various values of the parameters are then adjusted in a direction that will improve the fit. For example, if the surface is too high at a particular node, the flow- and sliding-law constants will be reduced and the fraction of sliding will be increased, thereby tending to reduce the surface elevation at this point and improving the fit.
This process is repeated for all the nodes collectively, until the surface attains a reasonable fit or until the parameters go outside some reasonable range of values. For instance, the sliding fraction cannot exceed 1 nor be less than 0, and the range of ice-hardness values is in some sense prescribed by the temperatures. A few dozen passes of this iterative process usually suffice to obtain a good fit, which is shown in Figure 2.
Comparison of present Antarctic surface elevation (a) with that obtained by fitting with sliding fraction, flow-law parameter and sliding-law parameter (m above present sea level) (b).

Figure 3 shows the distribution of the sliding fraction that was obtained in this fitting process. Note the almost complete dominance of flow throughout the interior of the ice sheet. Sliding only occurs in localized regions around the margin of the ice sheet and in regions known to be associated with ice streams, such as the ice streams along the Siple Coast, the ice streams that feed the Amery Ice Shelf and Pine Island and Thwaites Glaciers, as well as some of the major outlet ice streams that flow through the Transantarctic Mountains. In addition, there is a large region of sliding surrounding and to the east of the Filchner-Ronne Ice Shelf. Qualitatively, this agrees well with where sliding might be expected to occur.
Distribution of sliding fraction obtained in the fitting process.

Figure 4 shows the distribution of the flow-law parameter that was obtained in this fitting process. The bulk of the values in regions where flow dominates are between 2.5 and 3.5 bar year1/3, with an average value of 2.97 for the 850 nodes (out of 1316 ice-covered nodes) with sliding fraction less than or equal to 0.1. In addition, note that the higher values (i.e. harder ice) tend to occur further from the coast where the ice is in general colder. The regions of soft ice corresponding to small flow-parameter values occur mainly in areas where sliding dominates so these do not affect the ice-sheet surface elevation.
Distribution of flow-law parameter obtained in the fitting process (bar year1/3).

The distribution of the sliding parameter is similar to the distribution of the flow-law parameter, again with extreme values occurring mainly in regions where flow dominates. Because of the limited areas where sliding dominates this is not shown. In regions where the sliding dominates (466 nodes out of 1316 for sliding fraction greater than 0.1), the average value of the sliding parameter is 0.0277 bar year1/2. In regions where the sliding fraction is particularly high (greater than 0.9), the sliding parameter is lower, with an average value of 0.0129 for 217 nodes. This could reflect the fact that regions of high sliding fraction are controled by some mechanism that leads to greater decoupling of the bed, such as deformable sediments.
Sensitivity Tests of the Model
Variation of the sea-level mean annual air temperature
To see the effect of variation of the climate on the volume and areal extent of the Antarctic ice sheet, a number of experiments were performed for various values of TNSL. In each case, the value of the mean annual sea-level temperature was adjusted, and the model allowed to run for 9000 years, a time period that approximated equilibrium conditions. In this time period, the major adjustments in the shape and response of the ice sheets have occurred, although there is still an adjustment remaining as the high-elevation, low accumulation-rate parts of the ice sheet equilibrate. These further adjustments are small and, since the climate system rarely remains in the same state for much longer than 10 000 years, this response was not considered to be important. Shown in Table 1 are flotation volume, total volume, areal extent, average thickness and maximum surface elevation for various values of TNSL. The flotation volume differs from the total volume in that it is the part of the ice sheet that would contribute to sea-level rise if the entire ice sheet were melted. This part of the column does not contribute to the rise in sea level and hence is not included in the volume calculation.
Flotation volume, total volume, area, average thickness and dome elevation as a function Of TNSL

Table 2 shows the same results normalized with respect to the present configuration, which corresponds to a value for TNSL of -14°C. Figure 5 shows the same results in a graphical form. Note that the maximum increase in volume occurs for a temperature increase of 6 deg, and that both average thickness and dome elevation continue to increase as the temperature warms. This is due to the increasing accumulation rates at high elevations, a consequence of the increasing saturation vapor pressure as the climate warms. While ablation rates also increase, their effect is primarily at lower elevations which results in a decrease in the areal extent of the ice sheet as the climate warms.
Flotation volume, total volume, area, average thickness and dome elevation as a function of TNSL, normalized to the configuration for present conditions at -14°C.

Ratios of flotation volume, total volume, area, average thickness and dome elevation to the configuration for -14°C as a function of TNSL

Extreme configurations
Maximum configuration
A maximum configuration for the ice sheet is attained by removing certain of the conditions that are derived for the “best-fit” configuration. First, all sliding conditions are removed. This effectively removes all ice streams and ice shelves. These regions of fast flow or low bed coupling lower the surface both in their immediate vicinity as well as upstream in their catchment areas. Since the distribution of sliding is changed, keeping the distribution of flow-law parameters shown in Figure 4 is unreasonable. Hence the flow-law parameter is set to a value of 3.0 bar year1/3 everywhere. Beginning from the “best-fit” configuration, the model is allowed to adjust to the new boundary conditions. Table 3 shows the volumes, area, average thickness and dome elevation as a function of time as this system comes to equilibrium. It would be expected that such a configuration would develop its own distribution of sliding zones around the margin, but these have not been included, and hence this ice sheet is somewhat simplified. Figure 6 shows the surface-elevation contours for this maximum configuration after 50 000 years. The total volume for this simulation is just over twice the present volume.
Maximum configuration, surface elevation (a) and thickness (b) for all nodes meteorological mass balance, with flow-law parameter equal to 3.0 and no sliding.

Flotation volume, total volume, area, average thickness and dome elevation for the maximum configuration as a function of time

Minimum configuration
Of course, with sufficiently high temperatures and ablation rates the entire Antarctic ice sheet can be removed. However, for what one might consider a “reasonable” warming, a residual ice sheet is left in major parts of the continent. With a warming of 20 deg (from -14°C at sea level to +6°C) the ice configuration obtained is shown in Figure 7. This, like the maximum configuration, is a simplification of the actual ice sheet, since in this case we have preserved the present sliding zones, as well as the flow-law spatial distribution. One would expect that these would change as the ice sheet diminished in volume and area, with local zones of sliding along the margin evolving. This would manifest itself as lower surface slopes along the reduced ice-sheet margin, which would in turn lower the interior elevations somewhat. This could result in greater ablation on the reduced ice sheet, and it might shrink further from the displayed configuration. However, given the simplified boundary conditions, the ice sheet does not disappear, even for a warming of 20 deg.
Minimum configuration, surface elevation (a) and thickness (b) for a warming of 20 deg (TNSL = +6) and the “best-fit” sliding distribution preserved.

To demonstrate this, the ice sheet is prescribed to have sliding conditions everywhere. This situation results in the equilibrium configuration shown in Figure 8. While the outline of the residual ice sheet is similar, the ice in the all-sliding case is almost 1000 m thinner in the interior of the ice sheet. In addition the ice sheet equilibrates much more quickly. Figure 9 shows total volumes as a function of time for both the situation where the sliding zones are preserved from the “best-fit” configuration, and for the situation where there is sliding everywhere. The all-sliding case equilibrates in less than 10 000 years, while the “best-fit” case takes almost three times as long.
Minimum configuration, surface elevation (a) and thickness (b) for a warming of 20 deg, with sliding everywhere.


Time-dependent experiments
The experiments thus far have dealt with equilibrium situations that are attained by applying a sudden change to an initial condition and allowing the system to respond. As the rate of change of the system decreases, the system approaches an equilibrium state. In reality the ice sheet will rarely attain such an equilibrium configuration, since before that state is attained the driving mechanism will have changed, either abruptly or in some continuous fashion.
To demonstrate the response of the Antarctic ice sheet to a smoothly varying driving force, a smooth sinusoidal variation of the mean annual sea-level temperature, TNSL, is applied over a time span of 20 000 years. The cycle begins with TNSL at its current value of -14°C, and the ice sheet in its equilibrated “best-fit” configuration. Over 20 000 years, the temperature is warmed to -8°C, then cooled down to -20° C, and then warmed back up to -14°C. This driving force is shown in Figure 10 by the dashed line. The response of the ice sheet is to change both volume and areal extent. The total volume is shown in Figure 10 by the solid line. Vertical lines indicate both peaks and valleys of the two curves. The volume response of the ice sheet lags the driving-force temperature by approximately 2700 years, as the volume changes just under 10% of its total volume. There is some indication that this lag depends slightly on the amplitude of the driving-force variations, as a similar simulation with a smaller temperature swing showed a lag of just over 2000 years.
Total volume versus time shown with the TNSL curve to show the lag in the ice sheet’s response. The dashed line is the driving parameter and the solid line is the system’s response.

Conclusion
A finite-element model of the Antarctic ice sheet with an adjustable meteorological mass-balance relationship can be used to study the response of the ice sheet to different climates.
Calibration of the model with the present ice-sheet configuration yields a reasonable fit with a distribution of sliding which is in accord with expected regions of low bed coupling. The distribution of the flow-law parameter is also in rough agreement with that which would be expected from ice-column temperature considerations.
Two extreme configurations, a maximum over-riding and a minimum warm-climate ice sheet, display the boundaries of the envelope in which our simulations must behave.
A varying driving force in the form of the mean annual sea-level temperature yields a non-equilibrium ice sheet that responds to the continuously varying climate. This response has a finite lag time of approximately 2700 years, with a volume amplitude of just under 10%.
Acknowledgements
We should like to thank the U.S. National Science Foundation, grant number DPP-17147, and the National Oceans and Atmosphere Administration, grant number NA89AA-D-AC220, whose support made this work possible.
The accuracy of references in the text and in this list is the responsibility of the authors, to whom queries should be addressed.



