




No CrossRef data available.
Article contents
Effects of region of origin and geographic mobility on perceptual dialect categorization
Published online by Cambridge University Press: 27 April 2006
Abstract
Recent findings have shown that listeners' region of origin and geographic mobility affect their perception of dialect-specific properties of speech in vowel identification and dialect categorization tasks. The present study examined the perceptual dialect classification performance of four groups of listeners using a six-alternative forced-choice categorization task. The residential history of the listeners was manipulated so that the four groups of listeners differed in terms of region of origin (Northern or Midland United States) and geographic mobility (Mobile or Non-Mobile). Although residential history did not significantly affect accuracy in the categorization task, both region of origin and geographic mobility were found to affect the underlying perceptual similarity structure of the different regional varieties. Geographically local dialects tended to be confused more often than nonlocal dialects, although this effect was attenuated by geographic mobility.This work was supported by NIH NIDCD T32 Training Grant DC00012 and NIH NIDCD R01 Research Grant DC0111 to Indiana University. The authors would like to thank Robert Nosofsky for his assistance with the statistical analyses. The first author (C. G. Clopper) is now at the Department of Linguistics, Northwestern University, Evanston, Illinois 60208.
Information
- Type
- Research Article
- Information
- Copyright
- © 2006 Cambridge University Press
The perception of dialect variation by naïve listeners is a growing research area in the field of sociolinguistics. Dialect geographers and variationist sociolinguists have been documenting regional and social linguistic varieties of American English for more than a century (McDavid, 1958) and the implications of variation for social interactions have been explored by social psychologists for several decades (Ryan & Giles, 1982). More recently, experimental methods from speech science have been applied to the study of linguistic variation to uncover the perceptual categories that naïve listeners have for regional and social dialects (Thomas, 2002). While the goal of most of these studies was to understand how naïve listeners perceive linguistic variation and/or make judgments about the regional and social background of unfamiliar talkers, many recent studies have also explored the role of the listeners' background in the perception of dialect variation. In particular, a listener's residential history, including region of origin, geographic mobility, and travel experience, have been found to play an important role in shaping the perception of linguistic variation.
In one of the earliest studies of dialect categorization, Preston (1993) asked naïve adults in Michigan and Indiana to listen to a set of nine male talkers and then select the city that they thought each talker was from. The talkers came from nine different cities along a north-south continuum in the United States between Saginaw, Michigan, and Dothan, Alabama. The listeners heard a short extract from an interview with each of the talkers and were then asked to select from the nine cities the one that they thought the talker was from. Preston (1993) found that while the naïve listeners could make reliable distinctions between Northern and Southern talkers, their ability to distinguish between Northern and Midland talkers was more limited.
In addition, he found that the geographic boundary between the North and the South was different for the two groups of listeners. In particular, the southern Indiana listeners perceived the talker from their own region as more similar to the Northern talkers than the Michigan listeners did. Preston (2002) attributed this difference in perception to differences in “linguistic security” in the two regions.1
Linguistic security is defined with respect to the participants' ratings of the “correctness” of their speech and the speech of others. Linguistically secure participants rate their own speech as highly correct. Linguistically insecure participants rate their own speech as less correct than some other varieties that are perceived to be the standard or norm (Preston, 1993).
In the United Kingdom, Williams, Garrett, and Coupland (1999) recorded narratives in English from two adolescent male talkers from each of six different regions of Wales, plus two adolescent male speakers of Received Pronunciation (RP). They played 30-second extracts of these narratives to a different group of adolescent males in Wales and asked them to select the region that they thought each talker was from using an eight-alternative forced-choice categorization task (the response categories were the six regions of Wales, RP, and “don't know”). The authors found that the listeners performed the task with overall accuracy of approximately 30%. Williams et al. (1999) also observed several effects of residential history and linguistic experience on performance in their categorization task. First, although the performance of the adolescent boys was 30% correct overall, a more detailed examination of the results revealed that the listeners were far more accurate in the categorization of talkers from their own region (45%) than of talkers from other regions (24%). Second, Williams et al. (1999) also asked schoolteachers in Wales to participate in the dialect categorization task and found that the adults were more accurate than the children, with overall accuracy of 52% across all of the talkers for the adults, compared to 30% overall accuracy for the children. Williams et al. (1999) attributed this difference in categorization performance between the children and the adults to the greater travel experiences of the adults as compared to the children.
More recently, Clopper and Pisoni (2004b) played sentence-length utterances read by male talkers from six different dialect regions in the United States to naïve listeners. The stimulus materials were taken from the TIMIT Acoustic-Phonetic Continuous Speech Corpus, which contains recordings of 630 talkers (Fisher, Doddington, & Goudie-Marshall, 1986). The talkers in the TIMIT corpus include both males and females with a range of ages, ethnicities, and regional backgrounds. The six dialect regions examined by Clopper and Pisoni (2004b) were New England, North, North Midland, South Midland, South, and West. We found that naïve listeners were 31% accurate in categorizing unfamiliar talkers by dialect. While this performance was poor overall, it was statistically above chance in a six-alternative task. Clopper, Conrey, and Pisoni (2005) replicated the earlier results reported by Clopper and Pisoni (2004b) for a group of female talkers and a mixed group of both male and female talkers.
Clopper and Pisoni (2004b) also analyzed the pattern of perceptual errors produced in the categorization task and found that the listeners made systematic confusions between phonologically similar dialects. In particular, the listeners appeared to make consistent distinctions between Northeastern, Southern, and Western varieties of American English, but were far less accurate in identifying the six regional subvarieties within each of these larger clusters. We also found evidence of perceptual similarity differences due to residential history. In a post hoc analysis, we divided the listeners into three groups by region of origin: Northern Indiana, Southern Indiana, and Out-of-State. The clustering analysis revealed significant differences between the listener groups. In particular, the Southern Indiana listeners (from the South Midland dialect region) perceived a greater difference between the Southern and South Midland talkers than the other two listener groups. These results suggest that the listeners' region of origin may affect their perception of local varieties and allow for greater discrimination between local dialects.
Clopper and Pisoni (2004a) explicitly examined the effects of residential history on dialect categorization performance using the same six-alternative forced-choice task described earlier. Two groups of participants were recruited who differed in their residential history with respect to geographic mobility. One group, the “mobile” listeners, had lived in at least three different states in the United States. The second group, the “nonmobile” listeners, had lived only in Indiana. We found that the mobile group performed slightly better than the nonmobile group, but this difference was only significant for one of the three blocks of trials. A more detailed analysis of the performance by the mobile listeners with respect to which dialect regions they had lived in revealed more interesting results. In particular, listeners who had lived in a given region (“residents”) performed more accurately on talkers from that same region than listeners who had not lived there (“nonresidents”). This result was robust across all of the dialect regions. Finally, an analysis of the perceptual similarity of the dialects for these listeners revealed that the mobile listeners tended to perceive greater differences between neighboring regions such as the North and North Midland or South and South Midland than the nonmobile listeners did. Taken together, the findings from these perceptual dialect categorization studies suggest that geographic location and mobility affect naïve listeners' perceptual categories. In particular, listeners are more accurate and can better distinguish between local varieties as opposed to nonlocal varieties. In addition, mobile listeners tend to be more accurate overall and show greater discrimination between contiguous dialect regions.
Several studies have also reported that linguistic experience and residential history can affect listeners' perception of vowel categories and their ability to perceptually adapt to the dialect of an unfamiliar talker. In one early study, Willis (1972) asked listeners in Buffalo, New York, and Fort Erie, Ontario, to categorize synthetic vowel stimuli using an open-set response format. On each trial, the listeners heard a single synthetic vowel and were asked to write down an English word containing that vowel. Willis (1972) found significant differences in the perceptual boundaries between

and between

for the two listener groups. First, the Fort Erie listeners distinguished between

based on first formant (F1) frequencies, whereas the Buffalo listeners did not clearly discriminate these two categories with respect to either F1 or second formant (F2) frequencies. Second, the Buffalo listeners perceived the boundary between

at a higher second formant frequency than the Fort Erie listeners. Both of these differences in perception reflect differences in production between these two cities: the speech of the Buffalo area is characterized by the Northern Cities Chain Shift, including the raising of

and the fronting of

, whereas the speech of the Fort Erie area is characterized by the Canadian vowel shift, which does not involve a shift in either of these two vowels.
Labov and Ash (1997) reported the results of two experiments designed to explore the role of dialect familiarity on the perception of vowel quality. In the first experiment, listeners in Philadelphia, Chicago, and Birmingham were asked to identify the vowel in kVd (e.g., kid, ked, cad) words produced by a native Birmingham talker. The Birmingham listeners showed a general advantage over the nonlocal listeners in identifying the vowels, particularly for the most shifted vowels such as

, although the advantage was relatively small in most cases. The small, but consistent, local advantage was replicated in the second experiment in which listeners from the three cities were presented with words, phrases, and sentences extracted from Birmingham interview speech and were asked to identify the target word. Taken together, the results of the experiments by Willis (1972) and Labov and Ash (1997) suggest that residential history, particularly region of origin, affects the perception of vowel quality in both synthetic and naturally produced speech.
More recently, Rakerd and Plichta (2003) examined the perception of the Northern Cities Chain Shift by listeners from Detroit, Michigan, and the Michigan Upper Peninsula. The listeners were asked to identify a series of synthetic stimulus items as sock or sack. The stimuli varied in their second formant frequency and were presented to the listeners both in isolation and at the end of carrier sentences produced by a Detroit talker and an Upper Peninsula talker. The Detroit talker produced the shifted vowels found in the Northern dialect region, whereas the Upper Peninsula talker did not. Rakerd and Plichta (2003) found that the Detroit listeners, who were exposed to the Northern Cities Chain Shift in their local variety, were able to adapt to the dialect of the talker producing the carrier sentence and selected sock for more stimuli with higher second formant frequencies for the Detroit carrier sentence than for the Upper Peninsula carrier sentence or the words in isolation. However, the listeners from the Upper Peninsula, who were not as familiar with the characteristic vowel productions of the Northern Cities Chain Shift, appeared to use the same second formant frequency cutoff for distinguishing sock from sack, regardless of the context.
In a similar study in Great Britain, Evans and Iverson (2004) asked listeners in Northern and Southern Britain to rate synthetic stimuli embedded in carrier sentences on their goodness as exemplars of Northern or Southern British English. They found that listeners from Northern England with little exposure to Southern varieties showed less dialect-specific variation in their responses and tended to select Northern variants regardless of the target dialect. In contrast, listeners from Northern England who had moved to Southern England showed greater adaptation to the dialect in the carrier sentence and selected more accurate variants for the Southern British vowels. The studies by Evans and Iverson (2004) and Rakerd and Plichta (2003) suggest that prior linguistic experience can affect the perception of the phonological properties that distinguish different dialects.
Finally, one early study also revealed a relationship between residential history and cross-dialect intelligibility. Mason (1946) reported the results of a speech intelligibility experiment in noise in which the talkers and listeners came from different regions of the United States. He found that performance was better when the talkers and listeners shared a dialect than when the talkers and listeners were from different dialect regions. These speech intelligibility findings suggest that residential history affects the perception of the linguistic content of the message, in addition to the perception of isolated vowels or the regional background of the talker.
Taken together, the results of these studies suggest that experience with language variation affects performance on explicit tests of dialect categorization and identification, as well as vowel identification and speech intelligibility tasks. In particular, Preston (1993), Williams et al. (1999), Clopper and Pisoni (2004b), Willis (1972), Labov and Ash (1997), Rakerd and Plichta (2003), and Mason (1946) all found that geographic location affected perception. In addition, Clopper and Pisoni (2004a), Evans and Iverson (2004), and Williams et al. (1999) found that exposure to different varieties through travel or geographic mobility also led to differences in perception. In general, geographic mobility leads to greater overall accuracy in explicit categorization and identification tasks, whereas the location of the listeners interacts with the dialect of the talkers and leads to more accurate categorization responses when the talkers and listeners have the same regional dialect than when they do not.
The present study was designed to extend the previous research in several ways. First, dialect categorization performance was assessed using a six-alternative forced-choice categorization task that was similar to the experimental methods used in our earlier studies (Clopper et al., 2005; Clopper & Pisoni, 2004a, 2004b), except that the stimulus materials were taken from the new Nationwide Speech Project corpus (Clopper, 2004). The stimulus materials used by Clopper and Pisoni (2004a, 2004b) were taken from the TIMIT corpus, which was originally designed for use in speech recognition research (Fisher et al., 1986). As a result, the sociolinguistic properties of the corpus were not well controlled. The original regional labels used to describe the dialects of the talkers were questionable, both in terms of their names and the geographic regions that they covered, and it is unclear what demographic criteria were used to determine which region a given talker should be assigned to. We therefore expected to confirm the reliability of our previous research through a replication of the accuracy and perceptual similarity results with a new set of stimulus materials that are more sociolinguistically motivated. The results will provide additional evidence for naïve listeners' perception of three primary dialects of American English: Northeast, South, and West.
Second, the geographic location and mobility of the listeners were experimentally manipulated to create four listener groups: (1) Mobile Northerners; (2) Mobile Midlanders; (3) Non-Mobile Northerners; and (4) Non-Mobile Midlanders. Previous research has typically explored either mobility or location (but not both) or has relied on post hoc analyses of the effects of residential history on perception. By explicitly manipulating two variables of residential history in the current study, we were able to explore the contributions of these two sources of listener differences, independently and together, to the explicit categorization of regional dialects.
Finally, the data obtained from this task were analyzed with respect to overall accuracy, perceptual similarity, and response biases. Based on the previous research, we expected that the mobile listeners would be more accurate overall than the non-mobile listeners due to their greater experience with dialect variation in the United States and that all of the listeners would show a benefit for local talkers (either Midland or North). We expected the perceptual similarity analysis to reveal that the error patterns of all four listener groups reflected the broad organization of American English varieties into Northern, Southern, and Western groups. We predicted that the perceptual similarity spaces for the mobile listeners would show greater overall distances between neighboring dialects than the similarity spaces for the non-mobile listeners. In addition, we predicted that location would affect the perception of neighboring regions, such as North versus New England or Midland versus South. Previous research has not examined the role of response bias in dialect perception, but we expected to uncover further evidence of the role of experience in categorization behavior. In particular, we predicted that the listeners would show negative biases towards less familiar regions, such as the West or New England, and positive biases towards local, more familiar, regions, such as the North or Midland. Taken together, the results of this experiment will provide converging evidence with previous studies of the role of linguistic experience and dialect familiarity on the explicit identification of the regional background of unfamiliar talkers.
METHODS
Listeners
One hundred and fifteen listeners aged 18–25 years old were recruited from the Indiana University community for participation in this study. Data from 16 participants were excluded prior to the data analysis for the following reasons: three performed the task consistently at chance,2
Participants who did not correctly categorize at least five tokens from one of the six dialects were identified as performing consistently at chance and their data were excluded. It is impossible to determine if these participants were unable to perform the task accurately or if they were simply not attending to the task, but this strict exclusion criteria ensures that the data analyzed reflect the best efforts of the participants.
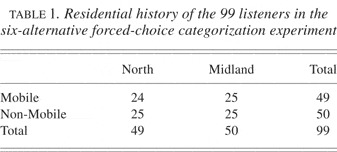
The 99 listeners who participated in the present study were assigned to one of four groups, based on their residential history. The 25 listeners in the Non-Mobile Midland group had lived only in the Midland dialect region.3
The Northern and Midland dialect regions were geographically identical to those used in the Nationwide Speech Project corpus (Clopper, 2004). Specifically, highway US-30 served as the primary divide between the Northern and Midland regions in Ohio, Indiana, and Illinois. The southern boundary of the Midland dialect ran along the southern border of Ohio, Indiana, and Illinois, with the three Indiana counties neighboring Louisville, Kentucky, included in the Southern region.
Residential history of the 99 listeners in the six-alternative forced-choice categorization experiment

Most of the 49 mobile listeners had lived in only one other dialect region in the United States (N = 37). Of the remaining 12 mobile listeners, eight had lived in two other dialect regions and four had lived in three or more other dialect regions. In addition, two of the mobile listeners had also lived abroad. The dialect regions represented included New England (N = 5), Mid-Atlantic (N = 9), North (N = 9, Mobile Midland group only), Midland (N = 8, Mobile North group only), South (N = 11), West (N = 9), Western Pennsylvania (N = 4), and the Florida peninsula (N = 6). Thus, even though the data were collected at a large Midwestern university, the mobile listeners were quite variable in their experiences and only 17 of the mobile listeners (35%) had lived in both the Northern and Midland dialect regions. The amount of time spent in other regions was also quite variable across participants. Some of the mobile listeners had lived outside their home region for as little as one year, while others had moved into their home region for the first time during high school.
Talkers
The talkers for the current study were selected from the Nationwide Speech Project (NSP) corpus (Clopper, 2004), which includes recordings of five males and five females from each of six dialect regions in the United States: New England, Mid-Atlantic, North, Midland, South, and West. Each talker was recorded producing a range of utterances, including isolated words, sentences, and conversational speech. The talkers are all white, native speakers of American English with native English-speaking parents. Each talker was a non-mobile resident of his or her dialect region with both parents also raised in the same region. The talkers ranged in age from 18 to 25 years old and were all recorded within two years of moving to Bloomington, Indiana, to reduce the effects of dialect leveling.
The talkers in the NSP corpus were unevenly distributed geographically within each of the six dialect regions. Most of the Mid-Atlantic talkers were from New York City and New Jersey, most of the Northern talkers were from Northern Illinois and Indiana, most of the Midland talkers were from central Indiana, half of the Southern talkers were from Kentucky, and half of the Western talkers were from Southern California. However, the New England region was represented by talkers from both Eastern and Western New England.
Four males and four females from each of the six regions were selected for the current study, for a total of 48 different talkers. The hometowns of these 48 talkers are shown in Figure 1. The dark circles indicate male talkers and the light squares indicate female talkers. Forty-eight of the 60 talkers included in the NSP corpus were selected for the present study to allow for two complete blocks of novel sentence trials. By reducing the number of talkers to 48, two stimulus items could be presented for each talker without repeating any of the sentences during the course of the experiment. The four talkers of each gender from each dialect were selected randomly.

Map showing the hometowns of the 48 talkers in the six-alternative forced-choice categorization task. Dark circles indicate male talkers and light squares indicate female talkers.
The six dialect regions represented by the talkers in the NSP corpus differ with respect to their vowel systems. The Northern dialect is characterized by the Northern Cities Chain Shift which involves the clockwise rotation of the low and low-mid vowels, beginning with the raising and fronting of

(Labov, 1998). The Southern dialect is characterized by the Southern Vowel Shift, which involves the fronting of the high and mid back vowels, the centralization of the front tense vowels, and the peripheralization of the front lax vowels (Labov, 1998). Southern speech also contains monophthongal

(Thomas, 2001). The Mid-Atlantic dialect includes raising of

and a split in words containing

such that some exhibit raising and some do not (Labov, 1994; Thomas, 2001). The New England, Midland, and Western dialects all exhibit the low-back merger of

to some degree (Labov, 1998). Western New England speech also includes some aspects of the Northern Cities Chain Shift (Boberg, 2001). Midland speech exhibits some /u/ and /o/ fronting (Labov, Ash, & Boberg, 2005). Finally, Western speech is also characterized by the fronting of /u/ (Labov et al., 2005; Thomas, 2001).
Clopper, Pisoni, and de Jong (2005) analyzed the vowel systems of the talkers included in the NSP corpus and found evidence of the Northern Cities Chain Shift among the Northern talkers and the Southern Vowel Shift among the Southern talkers. In particular, the Northern talkers reliably produced raised and fronted

and lowered and fronted

, as well as variably backed

. The Southern talkers produced reliably fronted /u/s and centralized /e/s and variably peripheralized

. The New England, Midland, and Western talkers exhibited the low-back merger and variable /u/ fronting. In addition, the Midland talkers exhibited variable

peripheralization, /e/ centralization, and

raising. The New England talkers also produced variable

raising. Finally, the Mid-Atlantic talkers produced backed

and fronted

. The talkers included in the current study thus produced regionally-marked vowel variants that naïve listeners should be able to use in identifying the regional background of the talkers based on short samples of speech.
Stimulus materials
Two different meaningful English sentences were selected for each of the 48 talkers, for a total of 96 different stimulus items. The sentences were taken from the Speech Perception in Noise (SPIN) test and ranged in length from five to eight words (Kalikow, Stevens, & Elliott, 1977). The sentences were selected for each talker such that no sentence was repeated over the course of the experiment. In addition, the sentences were selected to highlight regional variation by selecting sentences that contained shifted vowels. For example, the sentences produced by the Northern talkers typically included raised

or fronted

. Sentences produced by the Southern talkers, on the other hand, included fronted /u/ or monophthongal

. A complete list of stimulus sentences is shown in the Appendix.
The original digital sound files from the NSP corpus were edited to include only speech material and converted for auditory presentation to the listeners to .wav digital sound files with 16-bit encoding and a sampling rate of 44.1 kHz. The mean RMS amplitude level of each of the sound files was leveled to 67 dB using Level 16 (Tice & Carrell, 1998).
Procedure
The experiment consisted of two blocks of 48 trials each. In each block, participants heard one sentence from each of the 48 talkers one at a time in random order. For each talker, each of the two sentences was assigned randomly to either the first or second block for each listener to reduce stimulus-specific block effects. Two blocks of trials were used to increase the total number of data points obtained from each listener and therefore provide additional statistical power for the analyses. If the listeners performed similarly across the two blocks of trials, we would also have evidence that the task itself produced stable, reliable results across different stimulus materials, particularly given that the materials themselves were randomly assigned to the first or second block for each individual listener.
Participants were seated at personal computers equipped with a mouse and Beyerdynamic DT100 headphones. On each trial, the participants heard a single sentence over the headphones at approximately 70 dB SPL (sound pressure level) and were asked to select the region that they thought the talker was from. The response alternatives were displayed on a CRT display using a multicolored map of the United States with a verbal label assigned to each of the six regions, as shown in Figure 2. Before making their responses, the listeners were permitted to listen to each sentence as many times as they wanted by pressing a “Listen Again” button with the mouse. The listeners recorded their responses by clicking on the appropriate label on the screen with the mouse. The experiment was self-paced and the listeners pressed a “Next Trial” button to proceed to the next trial. No feedback was provided to the listeners about the accuracy of their responses. Participants were permitted to take a break between the two blocks of trials.

Response alternatives in the six-alternative forced-choice categorization task.
RESULTS
Four analyses of the results of the perceptual dialect categorization experiment were conducted. First, we examined overall categorization accuracy to determine how well the listeners were able to identify the regional background of the talkers based on short samples of speech and to explore the role of residential history in categorization accuracy. Based on previous research (Clopper & Pisoni, 2004a; Williams et al., 1999), we expected the listeners to perform poorly, but statistically above chance, and that the mobile listeners would be more accurate overall than the non-mobile listeners. Second, we analyzed the number of stimulus repetitions to examine the effects of residential history on repeated listening to the stimulus materials. We predicted that the non-mobile listeners might require more stimulus repetitions before making their responses if they found the task more difficult due to lower overall familiarity with the different regional dialects. Third, given that we expected the listeners to make a large number of errors, we also conducted an analysis of the listeners' error patterns using perceptual similarity scaling techniques, including a clustering analysis, to explore their perceptual responses in more detail. We expected this analysis to reveal that the error patterns produced by the listeners were systematically related to the phonological properties of the dialects, and that the listener groups would exhibit different perceptual similarity structures as a result of their different residential histories. This analysis allowed us to compare the perception of dialect variation by naïve listeners to the descriptions of phonological variation in the United States reported by trained sociolinguists. Finally, we examined the response biases of the listeners to explore the extent to which response biases may have affected overall performance and the perceptual similarity structures obtained in the third set of analyses. Specifically, the analyses of the response biases could help explain differences between the perception of dialect variation by naïve and trained listeners.
Categorization accuracy
A summary of the perceptual categorization performance for each of the four listener groups is shown in the middle column of Table 2. Chance performance in a six-alternative task is 17%. While the overall accuracy of the listeners was low, all four groups were statistically above chance by a binomial test (all p < .05).
Overall mean percent correct performance and mean number of stimulus repetitions in the six-alternative forced-choice categorization task for each listener group, collapsed across experimental block and talker dialect

A repeated measures analysis of variance (ANOVA) with experimental block (first or second) and talker dialect (New England, Mid-Atlantic, North, Midland, South, or West) as within-subject variables and listener group (Mobile North, Mobile Midland, Non-Mobile North, or Non-Mobile Midland) as a between-subject variable revealed a significant main effect of talker dialect (F(5,475) = 43.2, p < .001) and a significant experimental block × talker dialect interaction (F(5,475) = 2.8, p = .015). No other main effects or interactions were significant.
Figure 3 shows the percent correct performance across all four listener groups for each of the two experimental blocks for each of the six dialects. Post hoc Tukey tests on talker dialect for each experimental block revealed the locus of the interaction as well as the overall main effect of dialect. For the first block of trials, performance on the New England talkers was worse than performance on any of the other talker groups (all p < .05). Performance on the Midland talkers was the best, with significant differences in performance revealed between the Midland talkers and all other groups except the South (all p < .05). Significant differences were also found between Mid-Atlantic and Western talkers (p < .001), Northern and Southern talkers (p < .001), and Southern and Western talkers (p < .001). Similarly, for the second block of trials, performance on the New England and Western talkers was significantly worse than performance on the other four talker groups (all p < .05). Performance on the Midland talkers was also best in the second block, with significant differences found between Midland talkers and all of the talker groups except the South (all p < .01).

Percent correct categorization for each of the six talker dialect groups in each of the two experimental blocks, collapsed across listener group. Error bars indicate standard error.
The locus of the block × dialect interaction reflects the improvement in performance on New England and Northern talkers in the second block relative to the first. Paired sample t tests confirmed a significant improvement in performance on New England and Northern talkers from the first to the second experimental block (t(98) = −2.3, p < .05 for New England and t(98) = −3.0, p < .01 for North). No significant differences in performance between the first and second experimental blocks were found for the other four talker dialect groups.
Table 3 shows the performance of each of the four listener groups on each of the six talker dialects. As confirmed by the repeated measures ANOVA, performance was highly consistent across the four listener groups with respect to talker dialect.
Percent correct categorization performance for each listener group for each talker dialect, collapsed across experimental block

Overall, performance was best for Midland and Southern talkers and worst for New England and Western talkers, with performance on Mid-Atlantic and Northern talkers in between. Performance on the New England and Northern talkers improved from the first block to the second block. Recall that the stimulus materials were assigned to the first or second block randomly for each listener so that the same set of materials were not presented in the first and second block for every listener. Therefore, this effect is most likely due to experience with the task itself and with the range of variation in the stimuli and not to stimulus-specific differences. Finally, we did not find any evidence of effects of residential history on overall categorization accuracy.
Stimulus repetitions
The mean number of stimulus repetitions for each of the listener groups, collapsed across experimental block, is shown in the last column of Table 2. A repeated measures ANOVA on stimulus repetitions with experimental block (first or second) as a within-subject variable and listener group (Mobile North, Mobile Midland, Non-Mobile North, or Non-Mobile Midland) as a between-subject variable revealed a significant main effect of experimental block (F(1,95) = 6.6, p = .012). The listeners repeated the stimulus items more often in the first block of trials (M = 1.74) than in the second block of trials (M = 1.65). Neither the main effect of listener group nor the block × listener group interaction were significant. Thus, across all four listener groups and both experimental blocks, the participants chose to listen to the stimulus items an average of 1.69 times before making their response and they repeated fewer stimuli as the experiment progressed from the first block to the second block of trials. Given that the experiment lasted approximately 10 minutes, it is unlikely that this effect is a result of participant fatigue and more likely reflects the listeners' adaptation to the task and the range of variability present in the stimulus materials.
Perceptual similarity
Previous research on dialect categorization performance has shown that residential history can affect the perceptual similarity space of dialect categories for naïve listeners (Clopper & Pisoni, 2004a, 2004b). Therefore, in addition to examining the listeners' performance in terms of overall categorization accuracy, we also explored the patterns of errors produced by each of the four listener groups. This perceptual similarity analysis involved two phases. First, similarity and bias parameters were extracted from the raw categorization confusion data using Luce's (1963) and Shepard's (1957) Similarity Choice Model (SCM). Second, the resulting similarity parameters were submitted to an additive clustering analysis (Corter, 1982; Sattath & Tversky, 1977) to produce a graphical model of the perceptual similarity of the six regional dialects.
For each listener group, a 6 × 6 stimulus-response confusion matrix was calculated based on the listeners' responses in the six-alternative forced-choice task. The confusion matrices were summed over the two experimental blocks and the stimulus items were grouped by dialect. The four listener group confusion matrices were submitted to the full Similarity Choice Model (Luce, 1963; Shepard, 1957) to determine similarity and bias parameters. The similarity parameters indicate the degree of similarity between each pair of dialects. Similarity is assumed to be symmetric, so that the similarity between two categories i and j is equivalent to the similarity between j and i. The bias parameters provide an index of the response biases of the listeners and are discussed in more detail in the next section. Taken together, the similarity and bias parameters can be used to produce a model of perceptual categorization data that reveals the underlying perceptual similarity space of a set of objects or concepts (Nosofsky, 1985; Smith, 1980). In the current experiment, the objects were the six dialect regions: New England, Mid-Atlantic, North, Midland, South, and West.
A restricted version of the SCM analysis was also conducted in which the similarity parameters were held constant across all four listener groups, while the bias parameters were free to vary. If the restricted model produced results that did not fit the original data significantly worse than the full model, in which the similarity parameters were also free to vary across listener groups, then we would have evidence that the structure of the perceptual similarity spaces of the regional dialects of American English was equivalent for the four listener groups. In fact, however, the restricted SCM analysis produced a significantly worse fit to the data than the full model. The listener groups therefore differed in their perceptual similarity spaces of dialect variation.
To assess the effects of the independent variables of mobility and geographic location on perceptual similarity, we also compared the perceptual similarity spaces of pairs of listener groups, using the restricted SCM. Significant differences were found in similarity structure between the Mobile North and Mobile Midland groups, the Mobile North and Non-Mobile North groups, and the Non-Mobile North and Non-Mobile Midland groups. However, the Non-Mobile Midland and Mobile Midland groups were not significantly different (Gtest2 = 6.0, df = 15, χcrit2 = 7.3, p > .05). Thus, the perceptual similarity spaces of the two Midland listener groups were equivalent, whereas the two Northern listener groups differed from each other and from their Midland counterparts.
The similarity parameters that were obtained from the SCM analyses were submitted to ADDTREE, an additive clustering scheme that produces graphical representations of perceptual similarity in tree form (Corter, 1982). For the Mobile North and Non-Mobile North groups, the similarity parameters from the full SCM analyses were used. For the Midland groups, the similarity parameters from the restricted model were used and a single tree representation was produced, because the restricted SCM analysis revealed equivalent perceptual similarity spaces across the two Midland listener groups.
The results of the ADDTREE analysis are shown in Figure 4. In these representations, perceptual similarity is inversely related to vertical distance. That is, the perceptual dissimilarity of any two dialect regions is represented by the sum of the lengths of the least number of vertical branches required to connect them. Horizontal distances are irrelevant in the interpretation of the figures. For example, the perceptual “distance” between New England and Mid-Atlantic for the Mobile Northern listeners is the sum of the length of the short branch labeled “New England” and the length of the longer branch labeled “Mid-Atlantic.” However, the perceptual distance between the South and the Midland for the Mobile Northerners is the sum of the long branch labeled “South,” the long branch labeled “Midland,” and the short branch connected to the West/Midland node. With respect to interpreting the clusters, objects that share a node lower in the tree (such as New England and Mid-Atlantic in the Mobile North figure) are perceptually “closer” than objects that share a higher-level node (such as New England and North in the Mobile North figure).

Clustering solutions for the Mobile North, Non-Mobile North, and Midland listeners.
Inspection of Figure 4 reveals a general pattern of perceptual similarity across all three listener groups (Mobile North, Non-Mobile North, and Midland). First, in all three panels of Figure 4, Southern and Mid-Atlantic talkers are farthest from the root, suggesting that they are perceptually the most distinctive dialects of those examined in the current study. Second, the New England and Mid-Atlantic talkers share a low-level node and therefore cluster together perceptually for all three groups, although New England (which is closer to the root) is always perceptually less distinct from the other dialects than the Mid-Atlantic (which is farther from the root). While the lengths of the New England and Mid-Atlantic branches differ, the Mid-Atlantic and New England dialects share a node and are therefore closer to each other perceptually than to any of the other dialects. Finally, the Western and Midland talkers are also perceptually similar across all three listener groups. Thus, all of the listener groups had perceptual categories for Southern talkers, Northeastern (New England and Mid-Atlantic) talkers, and Western (Midland and Western) talkers.
The perception of Northern talkers was affected by the residential history of the listeners. In particular, while the structure of the trees for the Midland and Mobile Northern listener groups are virtually identical, the structure of the similarity model for the Non-Mobile Northern group is different. Specifically, the Northern talkers are relatively closely linked to the Mid-Atlantic and New England talkers in the trees for the Midland and Mobile Northern listeners. For the Non-Mobile Northern listeners, however, the Northern talkers are linked more closely to the Midland talkers. These differences suggest that the Non-Mobile Northern listeners perceived the Northern talkers as being more similar to the Midland talkers than the other groups did. That is, the listeners who had only lived in the Northern dialect region perceived themselves as being quite similar to their Midland peers. On the other hand, the listeners who had lived in the Midland dialect region for their whole lives and the listeners who had lived in more than one dialect region perceived the Northern talkers as being less similar to the Midland talkers and more similar to the New England and Mid-Atlantic talkers.
The highly similar perceptual structures revealed by the ADDTREE analysis for the Midland and Mobile Northern listener groups is striking. However, a Similarity Choice Model analysis of the stimulus-response confusion matrices restricting similarity parameters across the two Midland listener groups (Mobile and Non-Mobile) and the Mobile North listener group provided a significantly worse fit than the unrestricted full model, suggesting significant underlying differences between the Midland and Mobile Northern listeners. A closer inspection of the similarity parameters produced by the SCM analyses and the tree models produced in the ADDTREE analysis revealed that the Mobile Northern listeners were better able to distinguish the Southern and Mid-Atlantic talkers from the other talker dialect groups than the Midland listeners. In Figure 4, this greater perceptual distinctiveness is seen in the relatively longer lengths of the vertical branches for the Northern, Midland, and Western talkers for the Mobile Northern listeners than for the Midland listeners. This finding suggests that although the Southern and Mid-Atlantic talkers were the most distinctive across all three listener groups, this perceptual distinctiveness was greater for the Mobile Northern listeners than for the Midland listeners. This difference is also reflected in the somewhat better (although not statistically significant) overall categorization performance by the Mobile Northern listeners than the Midland listeners (see Table 2).
Across the four listener groups, a common pattern of perceptual similarity emerged in which the South and the Mid-Atlantic were the most distinctive dialects. In addition, the New England talkers clustered with the Mid-Atlantic talkers to create a perceptual Northeastern dialect. The Midland and Western talkers also clustered together in a third salient dialect. Thus, the results of this six-alternative forced-choice task suggest that the three main perceptual dialects of American English for naïve listeners from the Midland and Northern dialect regions are Northeast, South, and Midwest/West. In addition, both the geographic location and mobility of the listeners affected their perceptual similarity structures. The Non-Mobile Northern listeners differed from their Mobile Northern counterparts and their Non-Mobile Midland counterparts, particularly with respect to the similarity of the Northern and Midland talkers.
Response biases and asymmetries
The Similarity Choice Model analysis (Luce, 1963; Shepard, 1957) also produced response bias parameters in addition to the similarity parameters used in the additive clustering analysis. The bias parameters provide an indication of the response biases of the listeners. In a forced-choice categorization task in which each category is presented an equal number of times in the stimulus materials, we would predict that the response biases of the listeners would be roughly equivalent across all of the response alternatives. In particular, with six categories, each response alternative should be selected 1/6 or 17% of the time, if the listeners were unbiased in their responses.
The observed response biases for the four groups of listeners are shown in Table 4. The bias parameters for the Northern listener groups (Mobile and Non-Mobile) are based on the full SCM analysis. The bias parameters for the Midland listener groups (Mobile and Non-Mobile) are based on the restricted model in which similarity parameters were held constant across both groups, because the restricted SCM analysis revealed equivalent similarity parameters for the two Midland groups. An examination of the bias parameters in Table 4 reveals a tendency across all four listener groups to display a positive bias towards Midland responses and a negative bias towards New England responses. That is, the listeners responded “Midland” more often and “New England” less often than if they were theoretically unbiased in their responses. The bias parameters for the other four talker groups are fairly close to the unbiased .17 response rate, suggesting little response bias for those categories.
Bias parameters produced in the Similarity Choice Model analysis for each of the four listener groups

One additional aspect of the participants' stimulus-response patterns was captured by the Similarity Choice Model analysis: asymmetrical response patterns. Asymmetrical patterns of similarity are not uncommon in categorization or similarity ratings experiments. In one classic example, participants will typically rate the similarity of North Korea to China as being greater than the similarity of China to North Korea, because China is perceived as being an appropriate baseline for comparison whereas North Korea is not (Tversky, 1977). In the present study, the raw confusion data produced by the naïve participants in the six-alternative forced-choice task suggest that this type of perceptual asymmetry may also be present for the categorization of regional varieties of American English.
Table 5 shows the stimulus-response confusion matrix collapsed across all 99 listeners. Stimuli are presented in the rows and responses in the columns. Thus, each cell reflects the proportion of the total number of responses to a given stimulus category that were from a given response category. One example of a perceptual asymmetry that was uncovered by the SCM analysis is the strong negative response bias for New England and the strong positive response bias for Midland. Table 5 shows that the New England talkers were categorized as North and Midland much more frequently than the North and Midland talkers were categorized as New England. However, in general, the New England response category was selected much less frequently than either the North or Midland response category and the bias parameters in Table 4 reflect this asymmetry.
Proportion of responses from each of the six response alternatives to each of the six stimulus categories in the six-alternative forced-choice categorization task, collapsed across all 99 listeners

Another striking example of a perceptual asymmetry in similarity is the difference in the proportion of Mid-Atlantic talkers categorized as New England (.25) and the proportion of New England talkers categorized as Mid-Atlantic (.15) (see Table 5). While the raw probabilities are not too different, many more errors were made on the New England talkers than the Mid-Atlantic talkers overall. Thus, 35% of the incorrect responses to Mid-Atlantic talkers were New England responses, whereas only 17% of the incorrect responses for the New England talkers were Mid-Atlantic responses. The SCM and ADDTREE analyses revealed a high degree of similarity between the New England and Mid-Atlantic regions, however, masking this important perceptual asymmetry. The SCM analysis was unable to model this particular perceptual asymmetry due to the overall tendency for a low response bias for New England. Thus, while some of the stimulus-response asymmetries were reflected in the similarity and bias parameters produced in the SCM analyses, the fact that the Mid-Atlantic talkers were more often confused with New England talkers than vice versa was not captured by the model.
The analysis of the response biases revealed a positive bias for “Midland” responses and a negative bias for “New England” responses. The negative response bias for the New England response category led to an asymmetry between New England, Midland, and North responses, such that New England talkers were categorized as Midland and North more often than Midland and Northern talkers were categorized as New England. The New England response category was also involved in another asymmetry with the Mid-Atlantic category. In particular, while the New England response category was selected less often overall than the other response alternatives, the Mid-Atlantic talkers were disproportionately miscategorized as New Englanders. Taken together, these results suggest that the listeners' overall level of familiarity with the six dialects had a significant effect on their categorization performance, particularly with respect to the Midland and New England responses.
DISCUSSION
The results of the present study are consistent with previous research on the perceptual categorization of dialect variation in the United States and Europe with respect to overall categorization accuracy and perceptual dialect similarity structures. However, some differences were observed between the earlier research and the present experiment due to properties of the stimulus materials and the task demands. The addition of the response bias analysis also revealed novel findings about the role of dialect familiarity in perceptual dialect categorization performance. Finally, we observed significant effects of the listeners' geographic location and mobility on perceptual dialect similarity.
Categorization accuracy
Overall performance as measured by accuracy was 26% correct, which is low but statistically above chance. In addition, this level of performance is a little lower than the 31% accuracy reported by Clopper and colleagues for similar tasks with different stimulus materials (Clopper et al., 2005; Clopper & Pisoni, 2004a, 2004b). One important difference between our earlier work and the results of the present study, however, is the corpus from which the stimulus materials were obtained for presentation to the listeners. The earlier research was conducted using sentences obtained from the TIMIT Acoustic-Phonetic Continuous Speech Corpus (Fisher et al., 1986). As discussed earlier, the original design of the TIMIT corpus was not well controlled with respect to regional linguistic variation in the United States. First, the regional labels provided for each talker do not correspond to dialect regions based on current sociolinguistic research (Labov et al., 2005). Second, the criteria that were used to assign the regional label to each talker did not explicitly control for the residential history of the talkers and their parents. The speech samples used in the current study, however, were taken from the Nationwide Speech Project corpus (Clopper, 2004), which was designed specifically for perceptual and acoustic analyses of dialect variation in the United States. Therefore, the sociolinguistic components of the corpus were more carefully controlled and documented. The dialect labels and geographic regions included in each dialect were based on current sociolinguistic research by Labov and his colleagues (Labov et al., 2005). Details about the residential history of the talkers and their parents were obtained from each talker and only lifetime residents of each dialect region were included in the corpus.
Based on the differences between the two corpora, we might expect that performance would be better in the present study than in the previous studies because the talkers more accurately reflected regional dialect variation in the United States. One crucial difference, however, is the inclusion of talkers from both New England and the Mid-Atlantic in the current experiment. Although the TIMIT corpus contained talkers from New York City, they were too few in number to be included in the previous research (Clopper et al., 2005; Clopper & Pisoni, 2004a, 2004b). Therefore, performance in the current study may be lower overall because the listeners were required to distinguish between New England and Mid-Atlantic talkers. In addition, the New England talkers in the previous experiments (Clopper & Pisoni 2004a, 2004b) were all r-less, whereas the talkers in the current experiment were all r-ful, which may have reduced the phonological salience of the New England talkers.
The results of the accuracy and response bias analyses both suggest that this particular aspect of the categorization task was quite difficult for the naïve listeners in this study. In particular, the listeners were quite poor in accurately categorizing New England talkers. In addition, they categorized Mid-Atlantic talkers as New Englanders about 25% of the time. Thus, the lower performance found in the present study may be a better reflection of the dialect categorization abilities of naïve listeners in the United States than the previous results reported by Clopper and her colleagues (Clopper et al., 2005; Clopper & Pisoni, 2004a, 2004b), which did not require the listeners to make distinctions between the two Northeastern varieties of American English, New England and Mid-Atlantic.
The difficulty of dialect categorization tasks in general may be partly the result of individual talker differences, particularly as they relate to regional dialect. For example, the Western dialect region is geographically huge compared to the other five regions. Therefore, intraregional variation might be partly responsible for the poorer performance on the Western talkers. Intraregional variation is not restricted to large areas such as the West, however, and Clopper et al. (2005) found evidence of intertalker variation among the New England and Midland talkers, as well.
Clopper and Pisoni (2004b) also reported that dialect categorization performance was better for some talkers than others, even within a single dialect, suggesting that individual talkers may differ in the degree to which they exhibit dialect-specific properties that are salient for naïve listeners. Some of the previous dialect perception studies (e.g., Evans & Iverson, 2004; Rakerd & Plichta, 2003) have attempted to eliminate talker-specific variation through the use of synthetic stimulus materials. However, these studies are typically limited to the perception of a single variant and do not provide listeners with the range of vocalic, consonantal, and prosodic variation that occurs in naturally produced speech. In addition, the use of naturally produced intradialect, intertalker variability permits us to investigate the perception of variation at multiple levels of specificity, including within and across dialects, within and across gender, and within and across individual talkers. However, the use of natural speech makes it more difficult to isolate the precise linguistic variants that naïve listeners attend to in making explicit dialect categorization judgments, particularly when different sentence materials are used, as in the current experiment. Further research using both natural and synthetic stimuli is needed to explore the role of individual linguistic variants, and the combinations of variants, that are salient for naïve listeners in perceptual dialect categorization studies, as well as the role of individual talker variability in the perception and representation of dialect variation by naïve listeners.
Perceptual similarity
Despite the somewhat lower overall level of categorization performance, the results of the perceptual similarity analyses are consistent with previous research on the perceptual similarity of regional varieties of American English (Clopper & Pisoni, 2004a, 2004b). As expected, the clustering analysis revealed three primary perceptual dialect clusters: Northeast, South, and Midwest/West. These three clusters are quite similar to the perceptual clusters described by Clopper and colleagues (Clopper et al., 2005; Clopper & Pisoni, 2004a, 2004b) based on our earlier research using sentences taken from the TIMIT corpus.
The perceptual similarity spaces of the listeners were also consistent with the phonological properties of the dialects, as discussed in the sociolinguistics literature. For example, Labov (1998) described the three major dialects of American English as North, South, and the “Third Dialect” (which includes the West and the Midland), with the Mid-Atlantic as an exception. Carver (1987) defined the major dialects as North and South, with the Western region included in the North. Even as early as 1925, Krapp divided the varieties of American English into Eastern, Southern, and Western (or General) American groups.
For the specific set of talkers used in the current study, significant acoustic-phonetic differences were found for the Mid-Atlantic, Northern, and Southern talkers, while the overall similarity between the New England, Midland, and Western talkers was quite high (Clopper et al., 2005). Specifically, while the Mid-Atlantic, Northern, and Southern talkers all exhibited significant vowel shifts, the New England, Midland, and Western talkers were characterized by the low-back merger and variable /u/ fronting and

raising (New England and Midland only). Thus, the perceptual similarity of the dialects reflects the overall phonological properties of the talkers included in the NSP corpus.
The perceptual similarity of the Northern talkers with respect to the other dialects was affected by the residential history of the listeners. In particular, the Non-Mobile Northern listeners perceived the Northern talkers as being most similar to the Midland talkers, whereas the Midland and Mobile Northern listeners perceived the Northern talkers as being more similar to the New England talkers. This result is of theoretical interest for several reasons. First, it confirms that a listener's residential history affects the perception of dialect variation, although the effect is in the opposite direction than what was predicted. For the Northern listeners, mobility was a contributing factor in the perceptual similarity of the Northern and Midland dialects. At the same time, for the Non-Mobile listeners, region of origin was relevant to perceptual similarity of these same two dialects. However, the Northern listeners actually perceived greater similarity between themselves and their Midland neighbors rather than a greater difference.
However, the finding that the lifetime residents of the Northern dialect region (the Non-Mobile Northern listener group) did not attend to the difference between Northern and Midland talkers is consistent with an earlier study by Niedzielski (1999) that examined the perception of the Northern Cities Chain Shift. In her study, Niedzielski (1999) asked listeners in Detroit, Michigan, to match natural vowel stimuli to synthetically produced vowel tokens based on vowel quality. The listeners were presented with sentence-length utterances read by a female talker from the Detroit area and were asked to pay attention to a target word in the sentence. They were then presented with six synthetic vowel stimuli that included a range of first and second formant frequencies and were asked to select the vowel token that was the best match to the target. Prior to the beginning of the experiment, half of the listeners were told that the talker was from Detroit and the other half were told that the talker was from Canada. Niedzielski (1999) found that the label she provided about the talker's region of origin produced a significant effect on the listeners' performance. In particular, the listeners in the Detroit-label group consistently selected canonical, unshifted vowels as the best match, whereas the listeners in the Canada-label group selected vowel tokens that more closely matched the talker's actual productions.
The results of Niedzielski's (1999) study suggest that Northern listeners may not perceive the vowel shifts that are present in their own speech. Similarly, in the present study, the fact that the Non-Mobile Northern listener group perceived the Northern and Midland talkers as being highly similar, despite robust acoustic-phonetic differences between the two groups, suggests that listeners who have lived only in the Northern dialect region may not perceive the phonological differences between themselves and Midland talkers.
On the other hand, participants who were not from the North and those participants who had lived in multiple dialect regions perceived the Northern and New England talkers as being more similar than the Northern and Midland talkers. This perceived similarity is supported by the acoustic analysis of the talkers described by Clopper et al. (2005), which revealed consistent

raising in the North and variable

raising in New England, and by other research suggesting that New England may be the geographic origin of the Northern Cities Chain Shift, resulting in some phonological similarities between New England and Northern talkers (Boberg, 2001). Thus, the perceptual similarity spaces of the Midland and Mobile Northern listener groups may more accurately reflect the phonological similarities of the different regional dialects than the Non-Mobile Northern listener group.
Response biases and asymmetries
The common aspects of the residential history of the listeners influenced the response biases that were observed consistently across all four listener groups. In particular, the negative bias towards responding “New England” may be due to a general unfamiliarity with New England speech. Of the Mobile listeners, only five out of 49 (10%) had lived in New England for any period of time. The listeners who had not lived in New England may have been particularly limited in their exposure to New England speech due to the relatively small number of students at Indiana University who come from the New England area. Table 6 shows the percentage of entering undergraduate students in 2002 from each of the six dialect regions included in the Nationwide Speech Project corpus. It is clear that even in a diverse university setting like Bloomington, Indiana, participants may not have encountered very many talkers from New England. This general unfamiliarity with New England speech may be the factor that was responsible for the strong negative bias for “New England” responses.
Percentage of 2002 Indiana University first-year students from each of the six dialect regions included in the Nationwide Speech Project corpus

Similarly, the positive bias for the Midland talkers may have been due to the extreme familiarity of the listeners with talkers from this region. Indiana University is located in the Midland dialect region and the listeners in this study may have responded “Midland” more often because that response was equivalent to “here” for our listeners. In addition, the Midland dialect is also one of the best-represented dialect regions at the University. Therefore, the listeners may have adopted “Midland” as a default benchmark response for all talkers who sounded like themselves, resulting in a large positive bias for the “Midland” response.
Familiarity, or lack thereof, may also be related to the asymmetries found in the stimulus-response confusion matrices. In particular, the fact that Mid-Atlantic talkers were frequently identified as New Englanders but New Englanders were most often misidentified as Midlanders is consistent with the claim that the listeners in the current study were unfamiliar with the New England dialect. In addition, these results also suggest that the listeners recruited for participation in this study may have only a single category for the Northeastern dialects, and that they expect all talkers from the entire Northeastern region to sound like Mid-Atlantic talkers. That is, the listeners do not know which phonological properties are associated with New England talkers (the low-back merger and variable

raising) and which ones are unique to Mid-Atlantic talkers (F2 alignment of

). An alternative interpretation is that the listeners were simply not attending to the distinction between the two Northeastern groups, like the Non-Mobile Northerners' apparent inattention to the differences between Northern and Midland talkers. Future research should examine the perceptual categorization performance of listeners from the Mid-Atlantic and New England regions to determine whether this effect is due to familiarity and exposure or to a general lack of attention to the phonological differences between these two varieties.
CONCLUSIONS
Naïve listeners categorized the talkers from the NSP corpus by regional dialect with 26% accuracy overall. The listeners in the present study were all young adults who differed in their linguistic experience and exposure to dialect variation on two specific dimensions: geographic mobility and region of origin. While the residential history of the listeners did not directly affect the accuracy of their performance in the six-alternative forced-choice task, it did contribute to the patterns of confusions made by the listeners. In particular, mobility increased the distinctiveness of different varieties, presumably as a result of greater experience with specific varieties and with language variation in general. Frequency of exposure has been shown to play an important role in the development of robust perceptual categories in the laboratory, particularly when the participants' experience involves not only a specific item, but also the appropriate category label for that item (Barsalou, 1985). By living in several different regions of the country, the mobile listeners had the opportunity to develop more robust categories through greater exposure to talkers from different dialect regions and implicit knowledge of the appropriate category label for those talkers. Additional research is needed to determine how much exposure to different dialects and at what age is most beneficial for developing robust cognitive representations of dialect variation.
Geographic location, on the other hand, was found to reduce the distinctiveness of certain varieties due to commonly held social beliefs or stereotypes. In the present study, the Non-Mobile Northerners perceived the Northern and Midland talkers as being more similar to each other than the other listeners did, presumably because they did not perceive the differences between the two dialects and they believed that the two groups were highly similar in their speech. In terms of categorization, this finding suggests a “shrinking” of the perceptual distance between the Northern and Midland talkers for the Non-Mobile Northern listeners due to a lack of attention to the phonological differences between the two dialects (see Nosofsky, 1986). Additional research is needed to determine whether the perceptual shrinking observed in studies of dialect classification is due to misperception of the linguistic properties of the signal or perceptual biases, such as those reported by Niedzielski (1999) in her vowel-matching task.
APPENDIX

References
REFERENCES
Barsalou, Lawrence W.
(1985).
Ideals, central tendency, and frequency of instantiation as
determinants of graded structure in categories.
Journal of Experimental Psychology: Learning, Memory, and
Cognition
11:629–654.Google Scholar
Boberg, Charles.
(2001).
The phonological status of Western New England.
American Speech
76:3–29.Google Scholar
Carver, Craig M.
(1987).
American regional dialects: A word geography.
Ann Arbor, MI:
University of Michigan Press.
Clopper, Cynthia G.
(2004).
Linguistic experience and the perceptual classification of dialect
variation.
Doctoral dissertation,
Indiana University.
Clopper, Cynthia G.,
Conrey, Brianna L., &
Pisoni, David B.
(2005).
Effects of talker gender on dialect categorization.
Journal of Language and Social Psychology
24:182–206.Google Scholar
Clopper, Cynthia G., &
Pisoni, David B.
(2004a).
Homebodies and army brats: Some effects of early linguistic
experience and residential history on dialect categorization.
Language Variation and Change
16:31–48.Google Scholar
Clopper, Cynthia G., &
Pisoni, David B.
(2004b).
Some acoustic cues for the perceptual categorization of American
English regional dialects.
Journal of Phonetics
32:111–140.Google Scholar
Clopper, Cynthia G.,
Pisoni, David B., &
de Jong, Kenneth.
(2005).
Acoustic characteristics of the vowel systems of six regional
varieties of American English.
Journal of the Acoustical Society of America
118:1661–1676.Google Scholar
Corter, James E.
(1982).
ADDTREE/P: A PASCAL program for fitting additive trees based on
Sattath and Tversky's ADDTREE algorithm.
Behavior Research Methods and Instrumentation
14:353–354.Google Scholar
Evans, Bronwen G., &
Iverson, Paul.
(2004).
Vowel normalization for accent: An investigation of best exemplar
locations in northern and southern British English sentences.
Journal of the Acoustical Society of America
115:352–361.Google Scholar
Fisher, William M.,
Doddington, George R., &
Goudie-Marshall, Kathleen M.
(1986).
The DARPA speech recognition research database: Specification and
status. In
Proceedings of the DARPA speech recognition workshop.
93–99.
Kalikow, D. N.,
Stevens, K. N., &
Elliott, L. L.
(1977).
Development of a test of speech intelligibility in noise using
sentence materials with controlled word predictability.
Journal of the Acoustical Society of America
61:1337–1351.Google Scholar
Krapp, George P.
(1925).
The English language in America.
New York:
Frederick Ungar.
Labov, William.
(1994).
Principles of linguistic change: Internal factors.
Malden, MA:
Blackwell.
Labov, William.
(1998).
The three dialects of English. In
M. D. Linn (ed.),
Handbook of dialects and language variation.
San Diego, CA:
Academic Press.
39–81.
Labov, William, &
Ash, Sharon.
(1997).
Understanding Birmingham. In
C. Bernstein,
T. Nunnally, &
R. Sabino (eds.),
Language variety in the South revisited.
Tuscaloosa, AL:
University of Alabama Press.
508–573.
Labov, William,
Ash, Sharon, &
Boberg, Charles.
(2005).
Atlas of North American English.
New York:
Mouton de Gruyter.
Luce, R. Duncan.
(1963).
Detection and recognition. In
R. D. Luce,
R. R. Bush, &
E. Galanter (eds.),
Handbook of mathematical psychology.
New York:
Wiley.
103–189.
Mason, H. M.
(1946).
Understandability of speech in noise as affected by region of origin
of speaker and listener.
Speech Monographs
13(2):54–58.Google Scholar
McDavid, Raven I., Jr.
(1958).
The dialects of American English. In
W. N. Francis (ed.),
The structure of American English.
New York:
Ronald Press.
480–543.
Niedzielski, Nancy.
(1999).
The effect of social information on the perception of
sociolinguistic variables.
Journal of Language and Social Psychology
18:62–85.Google Scholar
Nosofsky, Robert M.
(1985).
Overall similarity and the identification of separable-dimension
stimuli: A choice-model analysis.
Perception and Psychophysics
38:415–432.Google Scholar
Nosofsky, Robert M.
(1986).
Attention, similarity, and the identification-categorization
relationship.
Journal of Experimental Psychology: General
115:39–57.Google Scholar
Preston, Dennis R.
(1993).
Folk dialectology. In
D. R. Preston (ed.),
American dialect research.
Philadelphia:
Benjamins.
333–378.
Preston, Dennis R.
(2002).
The social interface in the perception and production of Japanese
vowel devoicing: It's not just your brain that's connected to
your ear.
Paper presented at the 9th Biennial Rice University Symposium on
Linguistics: Speech Perception in Context, Houston, TX.
Rakerd, Brad, &
Plichta, Bartek.
(2003).
More on perceptions of /[Cursive A]/ fronting.
Paper presented at New Ways of Analyzing Variation 32,
Philadelphia, PA.
Ryan, Ellen B., &
Giles, Howard.
(1982).
Attitudes towards language variation.
London:
Edward Arnold.
Sattath, Shmuel, &
Tversky, Amos.
(1977).
Additive similarity trees.
Psychometrika
42:319–345.Google Scholar
Shepard, Roger N.
(1957).
Stimulus and response generalization: A stochastic model relating
generalization to distance in psychological space.
Psychometrika
22:325–345.Google Scholar
Smith, J. E. K.
(1980).
Models of identification. In
R. Nickerson (ed.),
Attention and performance VIII.
Hillsdale, NJ:
Erlbaum.
129–158.
Thomas, Erik R.
(2001).
An acoustic analysis of vowel variation in New World English.
Durham, NC:
Duke University Press.
Thomas, Erik R.
(2002).
Sociophonetic applications of speech perception experiments.
American Speech
77:115–147.Google Scholar
Tice, R., &
Carrell, T.
(1998).
Level16 (Version 2.0.3) [Computer Software].
Lincoln, NE:
University of Nebraska.
Williams, Angie,
Garrett, Peter, &
Coupland, Nikolas.
(1999).
Dialect recognition. In
D. R. Preston (ed.),
Handbook of perceptual dialectology.
Philadelphia:
Benjamins.
345–358.
Willis, Clodius.
(1972).
Perception of vowel phonemes in Fort Erie, Ontario, Canada, and
Buffalo, New York: An application of synthetic vowel categorization tests
to dialectology.
Journal of Speech and Hearing Research
15:246–255.Google Scholar
Residential history of the 99 listeners in the six-alternative forced-choice categorization experiment
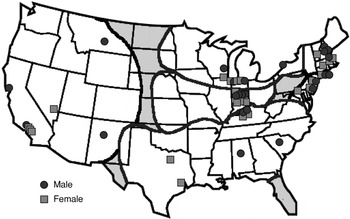
Map showing the hometowns of the 48 talkers in the six-alternative forced-choice categorization task. Dark circles indicate male talkers and light squares indicate female talkers.
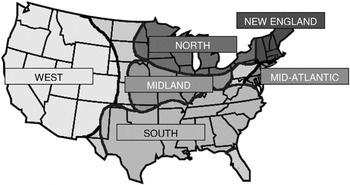
Response alternatives in the six-alternative forced-choice categorization task.
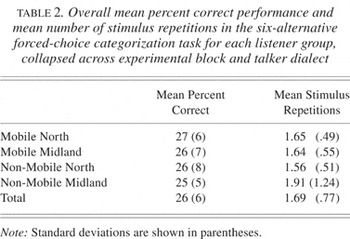
Overall mean percent correct performance and mean number of stimulus repetitions in the six-alternative forced-choice categorization task for each listener group, collapsed across experimental block and talker dialect
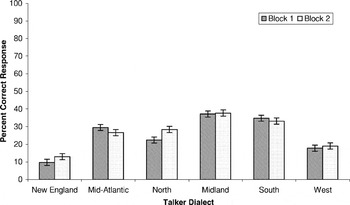
Percent correct categorization for each of the six talker dialect groups in each of the two experimental blocks, collapsed across listener group. Error bars indicate standard error.
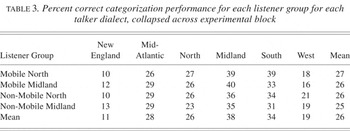
Percent correct categorization performance for each listener group for each talker dialect, collapsed across experimental block
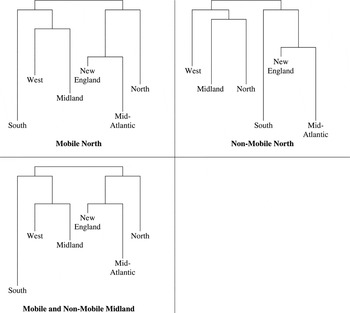
Clustering solutions for the Mobile North, Non-Mobile North, and Midland listeners.
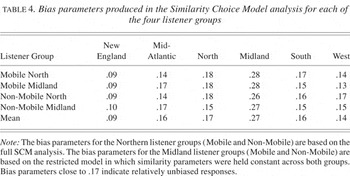
Bias parameters produced in the Similarity Choice Model analysis for each of the four listener groups
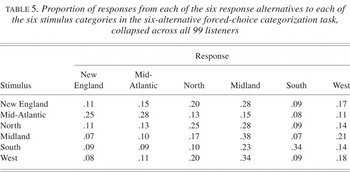
Proportion of responses from each of the six response alternatives to each of the six stimulus categories in the six-alternative forced-choice categorization task, collapsed across all 99 listeners
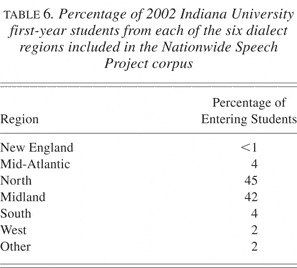
Percentage of 2002 Indiana University first-year students from each of the six dialect regions included in the Nationwide Speech Project corpus
 You have
Access
- 72
- Cited by