

Introduction
In 2011, Yinglak Shinawatra became the first woman prime minister of Thailand. A political neophyte, Yinglak, at 44 years old, was also relatively young for a Thai prime minister. While she spoke well and campaigned effectively, her success as the first female prime minister, at a young age, while running in her first election for parliament, can best be explained by looking to her family. Yinglak is the third member of the Shinawatra family to become prime minister, following her older brother Thaksin, and her brother-in-law Somchai Wongsawat. Her family has been active in the parliament for decades, with her father winning election in the 1960s and her uncle serving in several cabinets in the 1980s. While Yinglak's successful rise to the top is unprecedented, there is nothing unusual about her reliance on family ties: nearly one third of the members of the Thai parliament since 1932 have been members of political families, that is to say families that have won at least one other seat in parliament. Studies of emerging democracies, both in Latin America and Asia, have conceptualised such family politics in terms of corruption and of dominance over a particular province or area. Yet if we turn to literature on Western democracies, we find a very different discussion of family politics, which focuses instead on occupational following. Just as the children of farmers often become farmers, and the children of teachers often become teachers, so too do the children of politicians become politicians. What do we make of this discrepancy in the literature? Can family politics really be so different in emerging democracies? Consider the case of the Masadit Thai political family. Patriarch Surin was largely responsible for building up the Democrat party in the upper South in the 1970s. When he passed away, his daughter Suphatra took over his seat, eventually becoming a member of the cabinet in several coalition governments. When Suphatra retired from the parliament, her brother Surachet took over the seat. There have been no allegations of corruption, and no indications that the family has sought to further expand its influence. In this article, I seek to investigate family politics in Thailand as an occupational following. After contrasting the literature on emerging and Western democracies, I attempt to divide corruption and local dominance from occupational following, given that both may well occur simultaneously. I then explore some patterns and trends in the political families in Thailand, employing hypotheses from the literature.
Family Politics in Emerging and Western Democracies
To start with the literature on emerging democracies, in a study of family politics in Argentina, Behrend (Reference Behrend2011) has examined the ways that interlocked families can gain influence, even control, at the local level. Behrend is interested in the ‘hybrid’ nature of some democratising regimes, where despite democratisation at the national level, in some places at the subnational level non-democratic facets persist (see Behrend Reference Behrend2011; Diamond Reference Diamond2002; Gibson Reference Gibson2005). Behrend argued that in some provinces in Argentina, political families persisted through the creation of ‘closed games’ where, despite free and fair elections, the family and its allies was able to control access to government positions, business opportunities, the media, and the judiciary. The ‘game’ is ‘closed’ by controlling access to political office, and by engaging in “boundary control” in order to both “insulate” the province from national politics and “strengthen their control of their geographical domain” (Behrend Reference Behrend2011: 155). Voters choose these families without coercion, because the families have a record of delivering services, and the opposition has no such record. Such closed games are more likely in less economically developed provinces where competition is more limited.
Beherend thus provides us with mechanisms for control, and a clear hypothesis for the breakdown of such systems: increasingly complex economies, less dependent on provincial government largesse, make it more difficult to keep the game closed (Behrend 2010: 173). At the same time, her assumption that the goal of political families is to keep the game closed should be questioned. Behrend drew on the work of Gibson (Reference Gibson2005); however, in outlining the ‘closed game’, she focuses on what Gibson called ‘the parochialization of power’ at the expense of the other two goals he noted, ‘nationalisation of influence’ and ‘monopolisation of national and subnational linkages’. Gibson (Reference Gibson2005) noted that powerful local politicians not only seek to ‘parochialize’ power, by keeping national competitors out of their area, they also seek to nationalise their own influence, and to control linkages between the local and the national. Rather than close the game, they seek to capture the local political system in order to use it to gain greater influence.
We see this same focus on corruption, closed games and captured localities in work on the Philippines. For example, Roces (Reference Roces1990: 4) defined family politics as “a political process wherein the kinship groups operate for their own interests interacting with other kinship groups as rivals or allies....Once political power is gained by one family it is used relentlessly to accumulate family wealth and prominence, pragmatically bending the rules of the law to gain access to special privileges.” In the most comprehensive analysis of family politics in the Philippines, McCoy (Reference McCoy1993) argued that:
“Two key elements seem to have contributed to the formation of powerful political families – the rise of ‘rents’ as a significant share of the nation's economy and a simultaneous attenuation of central government control over the provinces.” (McCoy Reference McCoy1993: 10)
By granting privileged access to the market through concessions and monopolies, the state made possible the development of powerful privileged entrepreneurs in the provinces. The weak control of the central state in the provinces then allowed the local entrepreneurs to capture the local state, using extensive “kinship networks” to win elections and then to extend their influence to the national level through their local dominance, and through access to the parliament.
The literature on Western democracies, has a very different focus. LaBand and Lentz (Reference LeBand and Lentz1985), in investigating political families in the US Congress, discovered that politicians had followed their fathers' careers at a higher rate than any occupation except farmers and self-employed proprietors, both occupations with tangible business assets to pass down.Footnote 1 This was the case despite electoral laws intended to discourage such “intergenerational transfers” (LaBand and Lentz Reference LeBand and Lentz1985: 395). To explain this phenomenon, LaBand and Lentz employed a supply and demand model, allowing analysis of the choices of both the politicians and the voters. They argue that on the supply side, political fathers can pass down capital in the form of job specific skills, including both campaigning skills and legislative skills. In addition to such mentoring, political contacts can be passed down, contacts who may help in elections or in legislative activities. Fathers can also pass down ‘brand loyalty’ or name recognition. A good reputation with voters can be passed along to other family members who share the same surname.
On the demand side, Laband and Lentz argue that a dilemma for all voters is that legislators, once elected, may pursue their own interests and ignore their constituents. By electing a child as well as a father, voters can ensure some continuity, and may see an expanded commitment as helping to ensure a better balance between personal interest and constituent interest in their legislators. Having several members of the same family in parliament allows a higher level of punishment for self-interested behaviour, as all members of the family can be held responsible.
Finally, LaBand and Lentz note, passing along such political capital does not ensure success (in terms of longevity) for the children of politicians. They may squander capital rather than reinvest it. But having that political capital allows the children of politicians to engage in politics at a younger age, and generally allows those who reinvest it to be more successful. LaBand and Lentz (Reference LeBand and Lentz1985: 402) note that the overall levels of success between children of politicians and others is similar, but there is a binomial distribution among the political heirs, with those spending the capital on leisure balancing out those who reinvest it and succeed at a higher rate. They also argue that measures of voter satisfaction are higher in areas of occupational following, perhaps indicating a higher level of responsiveness, and implying that a system with political families might actually be more representative than one without (LaBand and Lentz Reference LeBand and Lentz1985: 411–412).
In a more recent study, Dal Bo et al. (Reference Bó, Bó and Snyder2009) also turned to the American congress to investigate political families. They noted that there has been a strong and steady decline in the number of children inheriting office in the US congress. At the same time, they found that legislators followed their fathers at the highest rate of any occupation with a significant number of responses in their survey, some nine times as high as economists, the next highest profession, fourteen times as high as doctors, and nearly 20 times as high as lawyers. Thus despite the decline in political families in the US Congress, a high rate of occupational following continues, which Dal Bo et al. argue is not due to voter preference, but rather to locally useful capital, such as name recognition or contacts (Dal Bo et al. Reference Bó, Bó and Snyder2009: 137–38). They also find that following is higher among female legislators (31.2%) than male legislators (8.4%), and that followers are better able to seek election to the Senate without first running for the House (Dal Bo et al. Reference Bó, Bó and Snyder2009: 132). They note that occupational following means that when representatives emerge from particular social groups, they are likely to perpetuate themselves, so that any effect will be long term and difficult to reverse (Dal Bo et al. Reference Bó, Bó and Snyder2009: 116).
Van Liefferinge and Steyvers (Reference van Liefferinge and Steyvers2009) set out to explore the role of family politicisation by examining mayors in Belgium. Like LaBand and Lentz, they apply a supply and demand analysis: on the supply side, they focus on learning, and on transfer of contacts and name recognition, on the demand side, on screening and selection. They concluded that occupational following is primarily a result of the passion for politics that political heirs develop at a young age. They argue further that occupational following is no longer simply a vestigial residue of a pre-modern era, but rather that it has evolved, and taken on a modern and even a post-modern component. The increasing specialisation that comes with modernisation conveys on the children of politicians an advantage in learning the behavioural codes of parties, elections, and legislatures, so that they are better able to engage with specialised political networks than those from other backgrounds: “In rational choice terms, individuals from political families are confronted with lower investment costs and higher (initial) gains in developing a political career (van Liefferinge and Steyvers, Reference van Liefferinge and Steyvers2009:145). They further argue that this advantage declines as the occupational follower becomes better known. In post-modern terms, they claim that new forms of political parties have become “professional electoral machines” who “camp” in elected office, and that under these circumstances, name recognition carries a high premium among selectors and in the election. This pattern is “further reinforced by ‘media logic’” which prefers simple stories with pre-existing referents (van Liefferinge and Steyvers Reference van Liefferinge and Steyvers2009: 145).
Aside from the obvious difference in focus – corruption and capturing of provincial politics contrasted to occupational following through inheritance of contacts and brand name – we can identify a key assumption that may help distinguish these two types of family politics, at least to some degree. The focus in the literature on emerging democracies has, for the most part, focused on the breadth of involvement of these families, looking at their power within a single generation, under the dominance of a powerful individual. McCoy (Reference McCoy1993: 9), citing Yasushi Kakuchi, argued that in the Philippines, the “kinship group” is “a generational corporate group devoid of lineal or vertical continuity but expanded horizontally within each generation with ego as the central figure.” This work on the Philippines thus focused on family leaders who could extend influence within a single generation, in contrast to the majority of the work on families in Western democracies.Footnote 2 Thus one way to try to separate the two types of family politics would be to consider breadth of influence (the number of family members holding seats at the same time) compared to length of influence (intergenerational transfer, or hereditary seats), in trying to separate these two phenomena. I will take that approach below.
The literature on family politics indicates one major similarity, despite very different theoretical approaches. Literature on Western democracies has generally assumed that family-based ascription would disappear with modernisation (Putnam Reference Putnam1976: 61, 108). Literature on new democracies is generally in agreement on this point: economic development, modernisation, and a diversified economy will erode the role of family politics. Yet those who have studied family politics in Western democracies have discovered that while the level of occupational following is decreasing, it remains high compared to other occupations. Thus we might expect high levels of occupational following for some time to come, particularly if, as van Liefferinge and Steyvers (Reference van Liefferinge and Steyvers2009) argued, occupational followers are taking advantage of new modern and post-modern techniques of campaigning. Thus I will investigate whether there is a relationship between the level of modernisation and the prevalence of family politics in the parliament.
If we turn to literature on Thailand, there is an extensive literature on Thai jaopho (‘godfathers’) and the role of their families and supporters in politics (e.g. Fishel Reference Fishel2001; Ockey Reference Ockey1993,Reference Ockey1999; Pasuk and Sungsidh 1996; Sombat 1992), yet there have been few attempts to analyse the nature of political families more generally in contemporary Thai politics. One exception is a little-known MA thesis by Thawatchai Kritiyaphichatkun (Reference Tawatchai1998). Thawatchai turned to the bureaucratic polity to explain the presence of family politics in Thailand. According to Thawatchai, when wealthy entrepreneurs observed the way that those in the bureaucratic polity (bureaucrats and soldiers) were able to use power to enrich themselves, the entrepreneurs undertook to gain political power for themselves, to support their own business interests. Under those circumstances, it was necessary to develop political heirs to preserve business interests over the long term. Thus politics and business became inextricably linked in Thailand, and greater economic competition led to increased competition for parliamentary seats among political families (Thawatchai Reference Tawatchai1998: 3).
Thawatchai (Reference Tawatchai1998: 32–34) also argued that political culture influenced the nature of family politics in the parliament. He believed that the traditional means of child-rearing in Thailand meant that the majority of young people in Thailand felt politics lacked immediacy in their personal lives. Furthermore, those same practices left young people overly dependent on their elders, so that they did not gain the independence of thought necessary in a vibrant democracy. Consequently those not part of a political family tended to avoid politics, those in a political family, out of respect for elders, tended to pursue political careers. The weakness of democracy in other institutions in Thailand, including the education system, the religious establishment, the press, and political parties, meant that these early child-rearing practices played a powerful role in shaping political families and the Thai political system.
Thawatchai identified 97 political families in Thailand since 1932, with 75 then still politically active, and, with business so inextricably linked to politics, he predicted that more would emerge to use politics to protect business interests (Thawatchai Reference Tawatchai1998: 4), putting him at odds with those who have argued that modernisation would lead to a decline in family politics. He also noted that provincial political families were becoming increasingly prominent at the national level, a trend he expected to continue. Thus, for Thawatchai, modernisation would bring no change on its own, but rather would perhaps increase the number of political families. Only a shift in child-rearing practices, or the strengthening of democratic principles in other key institutions, could lead to a change to a more democratic political culture, and a decline in political families, something he did not expect to happen, at least in the short term.
In understanding the roles of political families, as Wyatt (Reference Wyatt1994) observed, it is important to attempt to trace out the roles of the family women. As noted above, studies have found that women MPs in other countries tend to follow family members into parliament at a higher rate than men. In an earlier work (Ockey Reference Ockey2004), I examined some of the ways that women participate in contemporary electoral politics, both on their own behalf, and on the behalf of male family members running for office. Summarising the literature, I pointed out (2004: 56, footnote 1) that scholars have found that women often have greater control over family finances than men. When not running for parliament themselves, women often take the leading role in constituency work. I noted examples where such roles had been played by mothers, wives, and spouses of MPs. By staying in the provinces while male members are in Bangkok, women are able to work closely with voters and vote canvassers so that politics becomes an enterprise of the entire family (2004: 61–62). Of course the reverse may also apply, and sometimes does, with women becoming MPs, while men work with voters and vote canvassers, although I argued that prevailing stereotypes did not support this pattern, making it less common.
Thamora Fishel (Reference Fishel2001), in her brilliant dissertation on gender and reciprocity in provincial Thailand, has written of a provincial political family, with a focus on the contemporary era and particularly on the ways that women from the family engage in politics. By exploring a single contemporary case in great detail, she was able to closely analyse the role of women in provincial politics. Fishel (Reference Fishel2001: Chapter 6) argued that female family members both stand in for male family members in patron-client relationships, as Wyatt's (Reference Wyatt1994) analysis also indicated, and develop their own patron-client networks primarily among women. This makes women doubly important, as they can have powerful influence over male and female voters alike. Wyatt's work, my own work, and Fishel's work all point to the key role played by women in electoral politics even when they do not run themselves, and indicate the skills they learn while supporting other family members in the parliament. This fits well with the arguments of scholars of family politics in Western democracies.
This short review of the literature on family politics in emerging and Western democracies provides insight, some directions to pursue, and some specific hypotheses for the work that follows. No work has yet treated family politics in Southeast Asia as occupational following, as the focus has been entirely on nepotism, corruption, and the capturing of local political systems. I seek to address that imbalance here by focusing on family politics as occupational following.Footnote 3 I thus begin by examining breadth of influence compared to length of influence, in an attempt to separate out the capturing of local politics within a generation from occupational following where a seat is passed down to a younger family member. It was also noted that the support of a family in Western democracies allows younger candidates and women to succeed more frequently. We might expect these trends to be quite strong in Thailand, where the family may provide an effective organisation in the absence of strong political party organisations for much of Thailand, for much of its history. In this light, I investigate the relationship between gender and occupational following, and age and occupational following. Considering that the political capital inherited through the family can be squandered, with younger family members having to perform effectively to maintain their seats, I also examine the ability of those who inherit seats to retain them over time. Lastly, I explore the possible effect of political culture and modernisation on family politics, by comparing Bangkok to the provinces, and by comparing across regions and provinces.
Scope and Methods
This study relies primarily on a database, generated with the help of several research assistants over many years, of the 2750 members of the Thai parliament elected since 1932. The analysis is based on shared surnames, a technique that, while not error-free, is reasonably effective in the Thai case, as surnames for commoners are only about one century old, coming about as the result of a royal decree in 1913. There are a number of surnames that were royally bestowed as well, and some of those, such as Bunnak, are much older. However, those with royally bestowed names received them because of their political and administrative service, and can be considered political families during the period of the absolute monarchy, so that it seems logical to leave them in the analysis, even if those relationships may be more distant. Furthermore, the numbers of Members of Parliament (MPs) from such families is quite small after World War II. This shared surname technique is useful in determining patterns over the full period of Thai democracy. In the more recent era, we have better information on MPs, and this analysis is also shaped by closer investigation of a number of families, through interviews, press reports, and other primary sources, especially for the contemporary period. In this article, however, I focus on general patterns based on surname analysis.
If we turn to the members of the Thai parliament who share the same family name, the quantity of such relationships is compelling. Of the 2750 elected members of parliament since the overthrow of the absolute monarchy, 873 – nearly one third of the total – share a surname with at least one other member of parliament.Footnote 4 Altogether, those 873 members of parliament represent 359 surnames. The large number of political families allows us to consider the patterns of family politics over time and across regions. The large numbers also ensure that if there are some cases where families may have chosen identical names or are not identified due to name changes, it does not affect the statistical analysis.
We begin by attempting to separate those families seeking breadth, seeking ‘parochialisation’ of politics and ‘nationalisation’ of influence, from those who treat politics as an inheritance. I then employ statistical analysis to evaluate differences between family and non-family MPs over the years, in order to evaluate some of the hypotheses generated in the literature on political families and political inheritance in other countries.
Families and Occupational Following
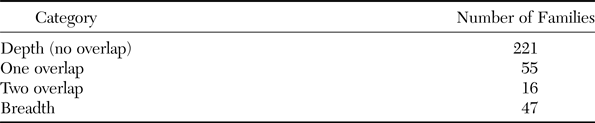
As noted, the literature on family politics in Western democracies has been pre-occupied with occupational following, rather than families and their ability to parochialise politics and nationalise influence, to create ‘bossism’ or jaopho styles of politics. With this in mind, it is worth seeking to separate occupational following and the parochialisation, or domination, of politics. To what degree does family politics represent occupational following? How much of it is an attempt capture localities? We can get a rough idea of the significance of each type by looking at breadth versus depth in political families. Some families seek breadth, trying to control multiple seats in the same parliament. Others have been more concerned with depth, controlling only one seat over a long period of time, passing it down from one family member to another. While far from a perfect measure, as a family might seek power through local politics without maximising influence at the national level, using only one seat in parliament to gather information and a voice at the national level, or families may send allies or proxies for seats in parliament, it does give a rough idea. Table 1 shows families who have only held one seat in parliament with no overlap, families who have overlapped in only one parliament (perhaps holding two seats just once as an elder family member passed down skills and knowledge to a younger one), families who have overlapped in two parliaments (since on two occasions elections have been held within the same calendar year and on two other occasions just one year apart), and those who have held multiple seats in three or more elections, not necessarily consecutively. As we can see, occupational following is much more common than capturing localities, even with the caveat that this is only a very rough measure and likely underestimates the number of families who have captured local political systems.
‘Breadth’ versus ‘Depth’ of political families.

Depending on the thresholds imposed, there are only about 18 families in Thailand since 1932 that have controlled multiple seats in parliament for an extended period of time. Of course the scope of influence of these 18 or so families makes them well worth study, and I will do so in future work. At the same time, families who have never had more than one member in parliament at a time are easily the most common type, and thus occupational following should not be overlooked in studies of family politics. That will be our task here.
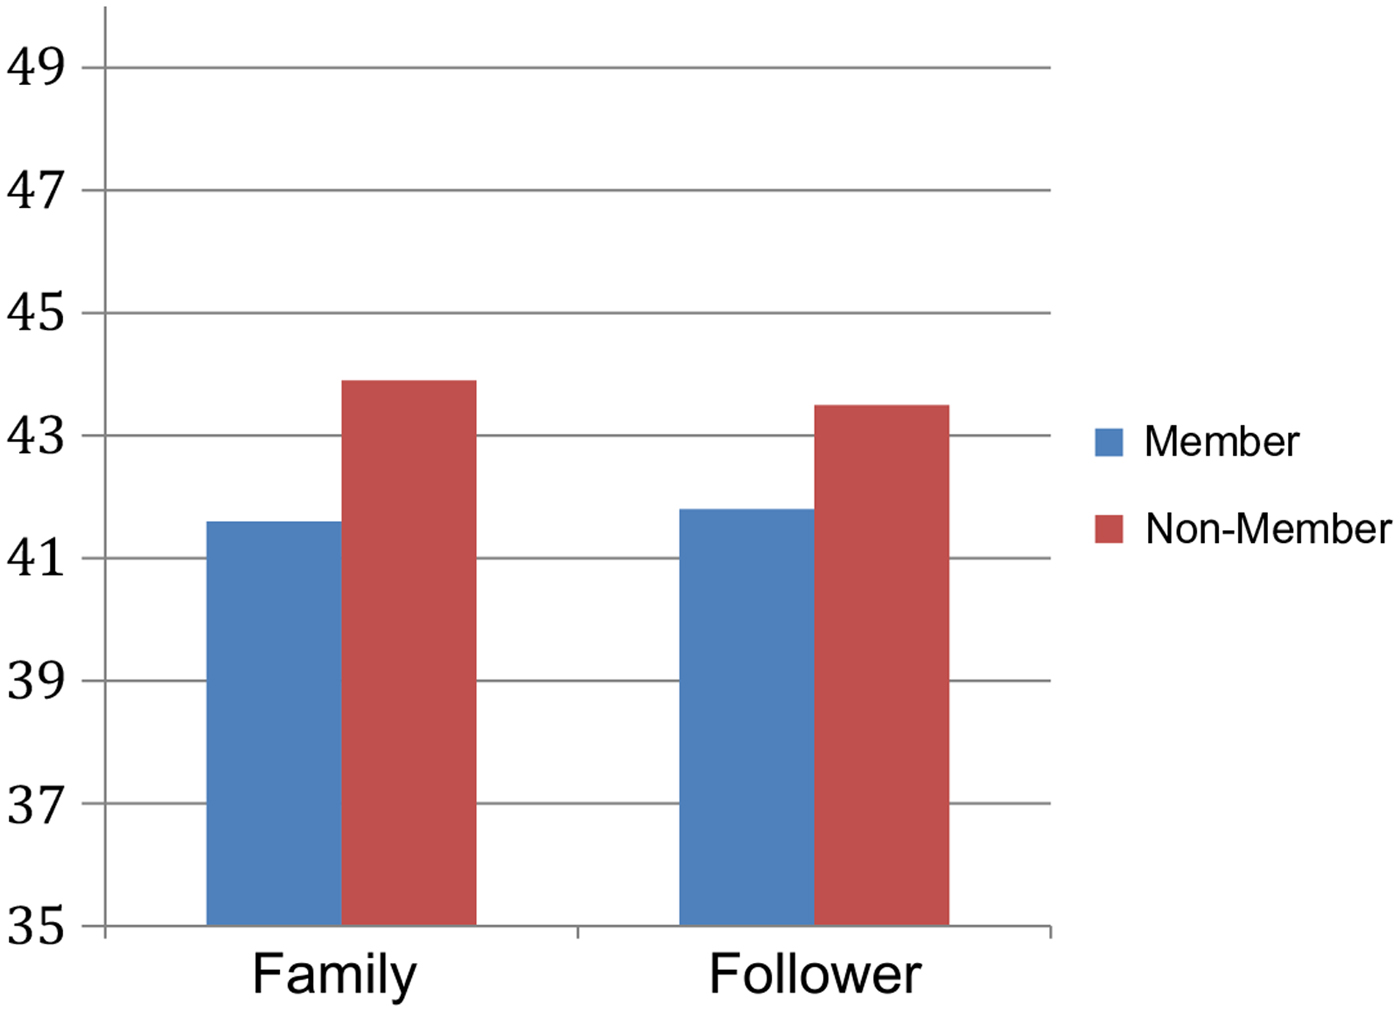
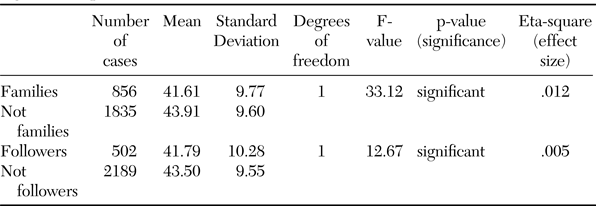
As discussed above, the literature on Western democracies focuses on the advantages conferred on political heirs, and on the consequences of these advantages for their election prospects. The literature indicates that those following another family member into parliament will benefit from the skills, contacts, and name recognition of the family. This might lower barriers to young candidates, so that we might find, as others have found in studies in Western democracies, that family members and political heirs tend to be younger when they first assume office. In a system where seniority plays an important part in gaining access to higher positions such as the cabinet, gaining election at a younger age can translate into much greater power. In Thailand, seniority plays only a limited role, but is of some importance. As we see in Figure 1 (supporting data shown in Table 2), both family members in general and political heirs do tend to get elected at younger ages, and at statistically significant levels.Footnote 5 On average, family members are first elected at about age 41 years and 7 months old, while non-family members are elected at an age of about 43 years and 11 months old, a difference of 2 years and 4 months. This allows further advancement into more powerful positions at a younger age, and indeed we might note that of recent prime ministers, Yingluck, Somchai, Thaksin, Banhan and Chatchai, and to a lesser degree, Samak (one brother) and Aphisit (several more distant relatives) have come from political families, with Yingluck, Thaksin, and Aphisit becoming prime minister while still young. The pattern for political heirs is similar, with a slightly smaller difference due to the even younger average age of the founders of political families. This indicates that the founders have actually come to office at younger ages even than their heirs on average at an age of 41.36 years old, or about 41 years and 4 months. Thus we might conclude that one of the most important aspects of winning election at a young age is a higher chance of gaining enough influence and name recognition to place other family members in parliament. This helps to explain the continuity in political families.
Age at first election in comparison. (Family includes all members of political families, followers includes only those family members who followed another family member into the parliament.)

Age at first election in comparison based on analysis of variance (ANOVA). Significance: p < .01

Error degrees of freedom = 2,689
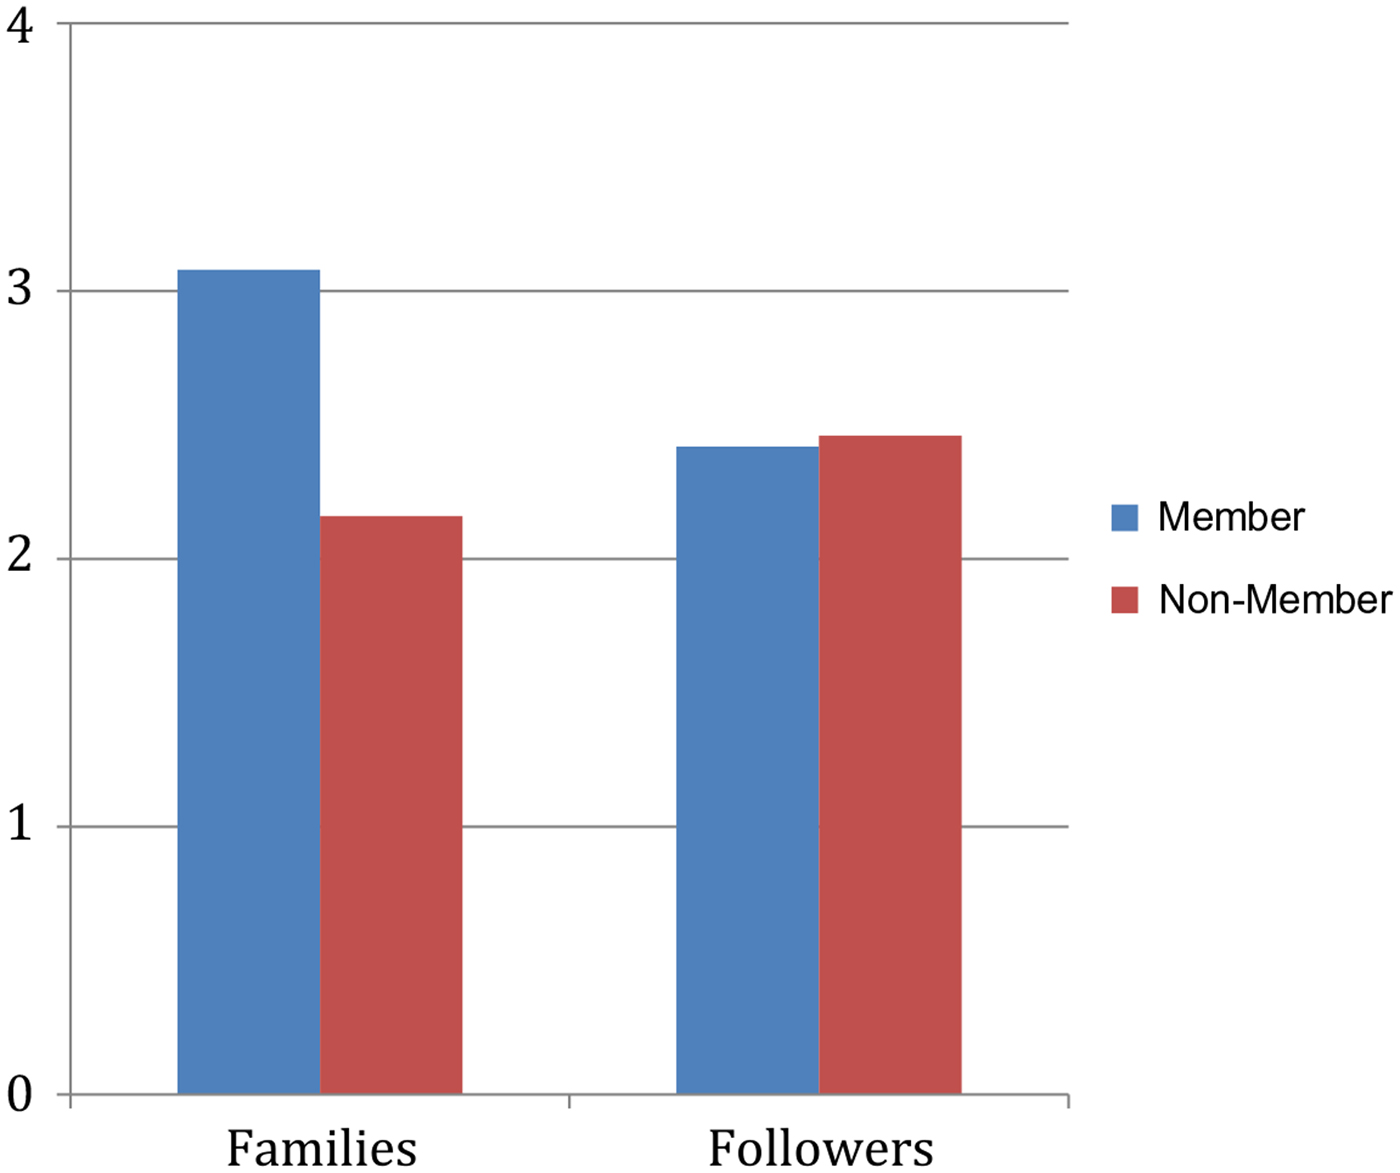
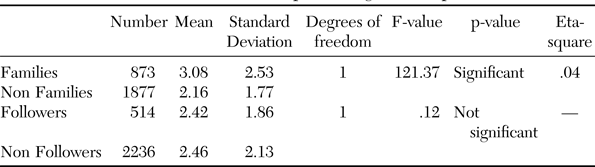
While entering parliament at a younger age can provide a large advantage to political families and occupational followers, the advantage would be vastly multiplied if they also succeeded in gaining re-election at a greater rate. Seniority depends on staying in parliament once elected. As noted earlier, available data on Western democracies indicate that there is little difference between political heirs and others in gaining re-election. This is generally attributed to a balancing effect: while some political heirs are very effective in gaining re-election, due to the inherited advantages, others squander their inheritance. Consequently, there is one group that does very well, another group that does very poorly. Non-heirs, on the other hand, all had to generate their own support and thus have demonstrated the ability to do so. If we look at the data on Thailand in Figure 2 (shown numerically in Table 3), we find that political families do tend to get re-elected more times than non-families, at a statistically significant level. However, political heirs do not. If the literature on Western democracies is accurate, this is because the number of heirs who squander their inheritance suppresses the effect for those who succeed.
Number of times elected in comparison.

Number of times elected in comparison. Significance: p < .01

Error degrees of freedom = 2,748
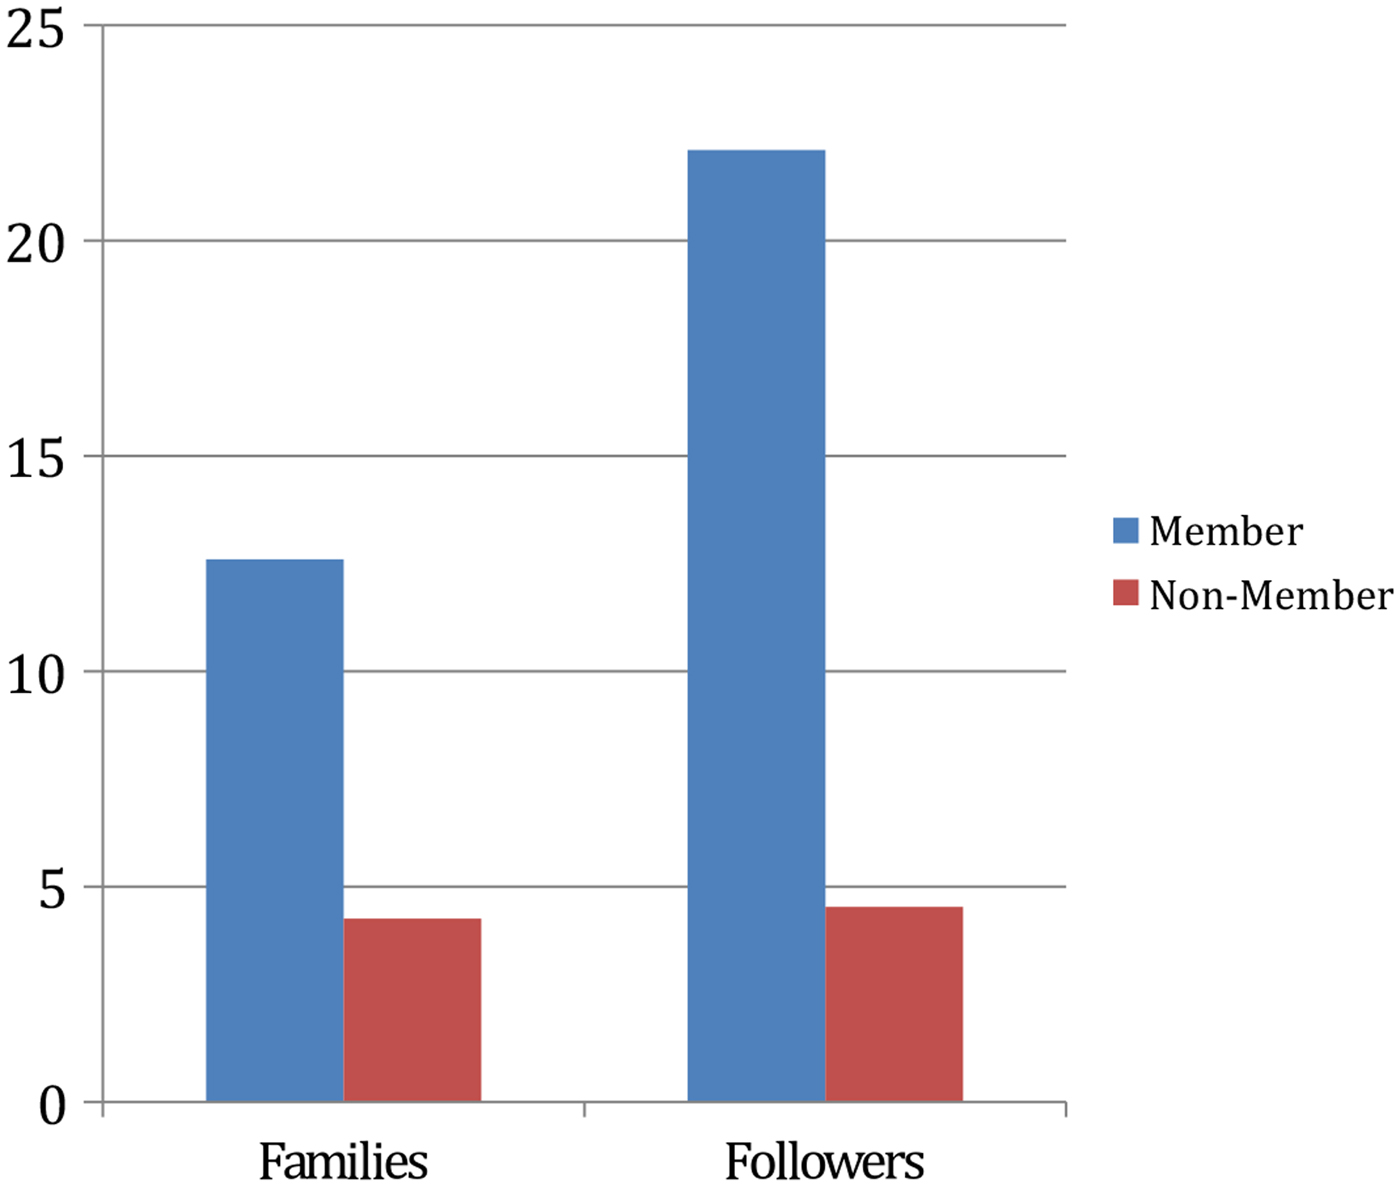
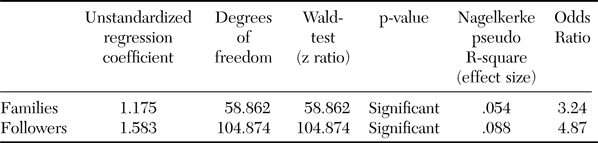
The literature on advanced democracies, and studies of gender and politics in Thailand, indicate that the family may be particularly important for female candidates, who may face both stereotypes and party gate-keepers as obstacles to overcome. Women in Thailand, as we saw in the work of Fishel, often begin their work in politics in support of other family members where they develop skills and contacts necessary to overcome obstacles. The data, presented in Figure 3 (Table 4), bear this out.Footnote 6 In the families, 12.6% of the MPs are women, in the non-family group, only 4.26% are women. Among political heirs, 22.1% are women, compared to 4.53% among those MPs who did not follow another family member into parliament. A logistic regression demonstrates, not surprisingly, that this difference is statistically significant. It is also worth noting that nearly all the founders of political families are male, just 17 of 359 founders were women (4.7%). The implications of this finding are important in understanding the participation of women in the Thai parliament. As noted earlier, much of the participation of women is outside parliament, doing constituency work, which should not be overlooked. The opportunities or especially the desire to learn and employ certain political skills may be lacking where other family members are not involved, since politics has often been deemed a ‘dirty’ profession (as in the phrase nakkanmuang nam nao, dirty water politician). It seems likely, based on these data, that among the reasons relatively few women become politicians, stereotypes among potential candidates – not voters – and a lack of influence with party gatekeepers who select candidates, may be the major barriers for women in entering the parliament. In short, the main barriers are likely in the political system: more willingness for candidates to step forward and more understanding among party gatekeepers may be important areas to address.
Percentage of women in comparison.

Percentage of women in comparison. Significance: p < .01

We can conclude that family support does make it easier for occupational followers to succeed at a younger age, and does help women to overcome obstacles to becoming MPs themselves. Occupational following provides an initial advantage to young and to female candidates; however, it does not guarantee success over the long term. Continued success, the statistical data show, requires that occupational followers develop their own political capital, rather than rely on family, so that over the long term, only effective candidates will continue to win election. If we look at family politics only through this perspective, we might draw much more positive conclusions regarding the role of political families than has generally been the case in the literature, suggesting a more nuanced view may be needed, one that separates corruption from political inheritance, as we have attempted to do here.
Political Families, Political Culture, and Economic Development
In the literature on new democracies scholars have argued that modernisation and the associated diversification of the economy makes it more difficult for a political family to control a region, so that over time, modernisation should decrease the numbers of political families. In Western democracies the numbers of families has declined, although occupational following remains much higher than other professions. We can explore this question in the Thai case in two different ways. First, we can determine whether there is a relationship between political families and level of economic development at the provincial level, using gross provincial product. Second, we seek to determine whether, over the longer term, the numbers of families in the parliament have declined. At the same time, since Thailand has fairly distinct regional cultures, we need to examine whether the different political cultures in each region might have an impact, so that we can ascertain whether, to take the most obvious case, any differences in the Northeast are due to poverty or to political culture.
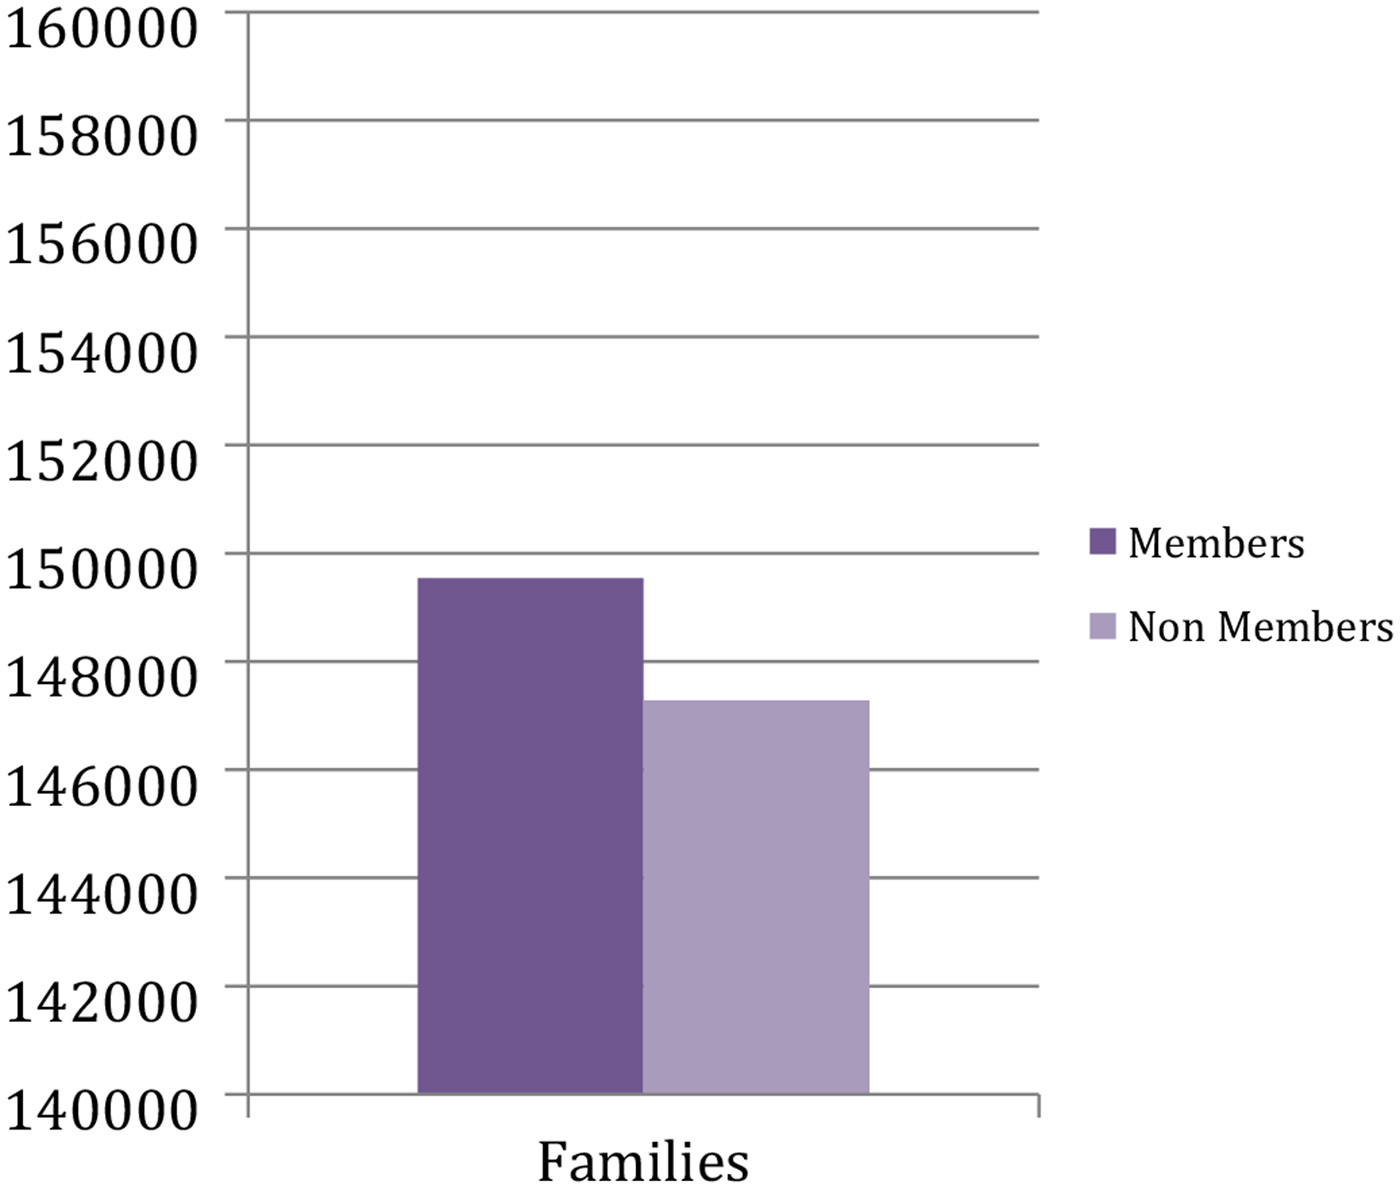
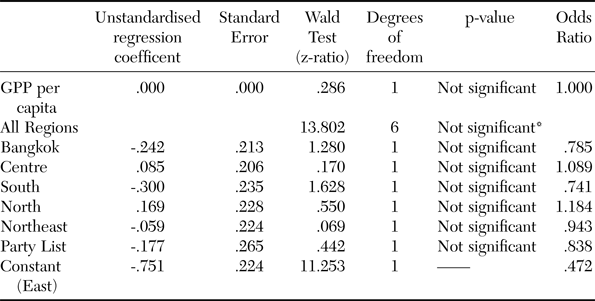
Figure 4 (data in Table 5) shows an assessment of the levels of economic development in provinces with political families compared to those without political families. The comparison is done using logistic regression, as the dependent variable (family/non-family) is categorical, as we seek to determine whether there is a relationship between families and economic development.Footnote 7 Our political families variable assesses the existence of political families in each province since 1932, compared to the current Per Capita Gross Provincial Product (GPP), so that we are looking at the historical effect of families on contemporary level of development and cannot be sure of the direction of causation. It may be that the existence of political families encourages or retards growth, or, as the literature argues, it may be that economic growth limits family politics. At any rate, average per capita GPP in provinces that have had political families (149,543 baht) varies little from provinces without political families (147,284 baht). The slightly higher average in provinces without political families is not statistically significant, and is therefore likely to be due to random fluctuation. That said, in at least one way, modernisation has had a strong impact in an indirect fashion: through declining birth rates. Fertility rates in Thailand dropped from about 6 children per family in the mid-1960s to about 5.5 by 1975, then declined at a rate matched by only a handful of countries, to 2.2 by 1990 (Jones Reference Jones2013). Thus the pool of children available to follow in the family occupation has shrunk rapidly.
Level of economic development and political families (Gross Provincial Product in baht/Families).

Level of economic development and political families (GPP/Families). Significance: p < .01

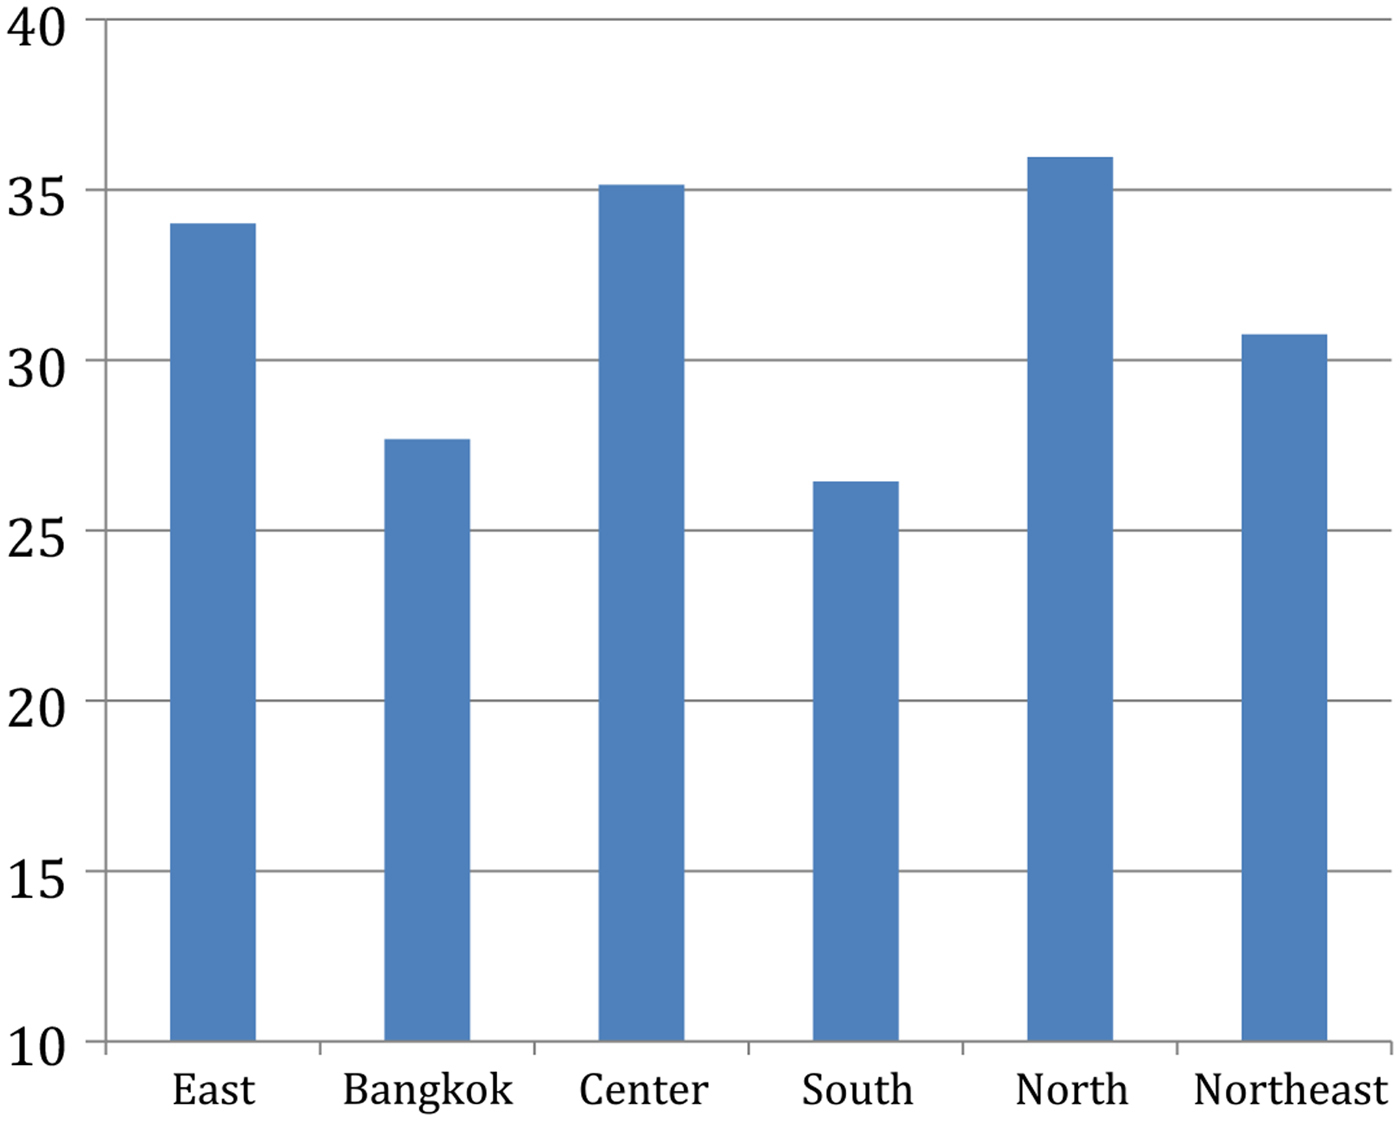
Before examining whether the number of political families has declined over time, it is worth looking at the different regions, to assess whether political culture might have an impact. Using the regions as defined by the Electoral Commission and the Parliament (Eastern Seaboard, Bangkok, Center, South, North, and Northeast), a logistic regression was employed due to the categorical dependent variable, and because of the fairly wide differences in income level in the different regions, economic development was held constant, although, given the results of our previous analysis, that there is no relationship evident between economic development and family politics, this may not have been necessary. As we see in Figure 5 (data shown in Table 6), families are present in all regions. The percentage of families holding seats is slightly lower in Bangkok and the South, higher in the North and Central regions. However, the difference is not statistically significant for any of the regions taken alone, and, while regions overall do meet the lower 0.05 significance threshold, for a database this size, the 0.01 higher threshold is preferable, which has been easily met for the other relationships here. Thus I conclude that there is no clear relationship between region or political culture and family in the Thai case. There is no statistically significant difference when it comes to family politics between, for example, urban culture in Bangkok and the Isan rural culture of the Northeast.
Regional/political culture comparison, holding income constant (percentage).

Regional/political culture comparison: ‘Holding Income Constant’. Significance: p < .01

* Significant at the lower .05 threshold
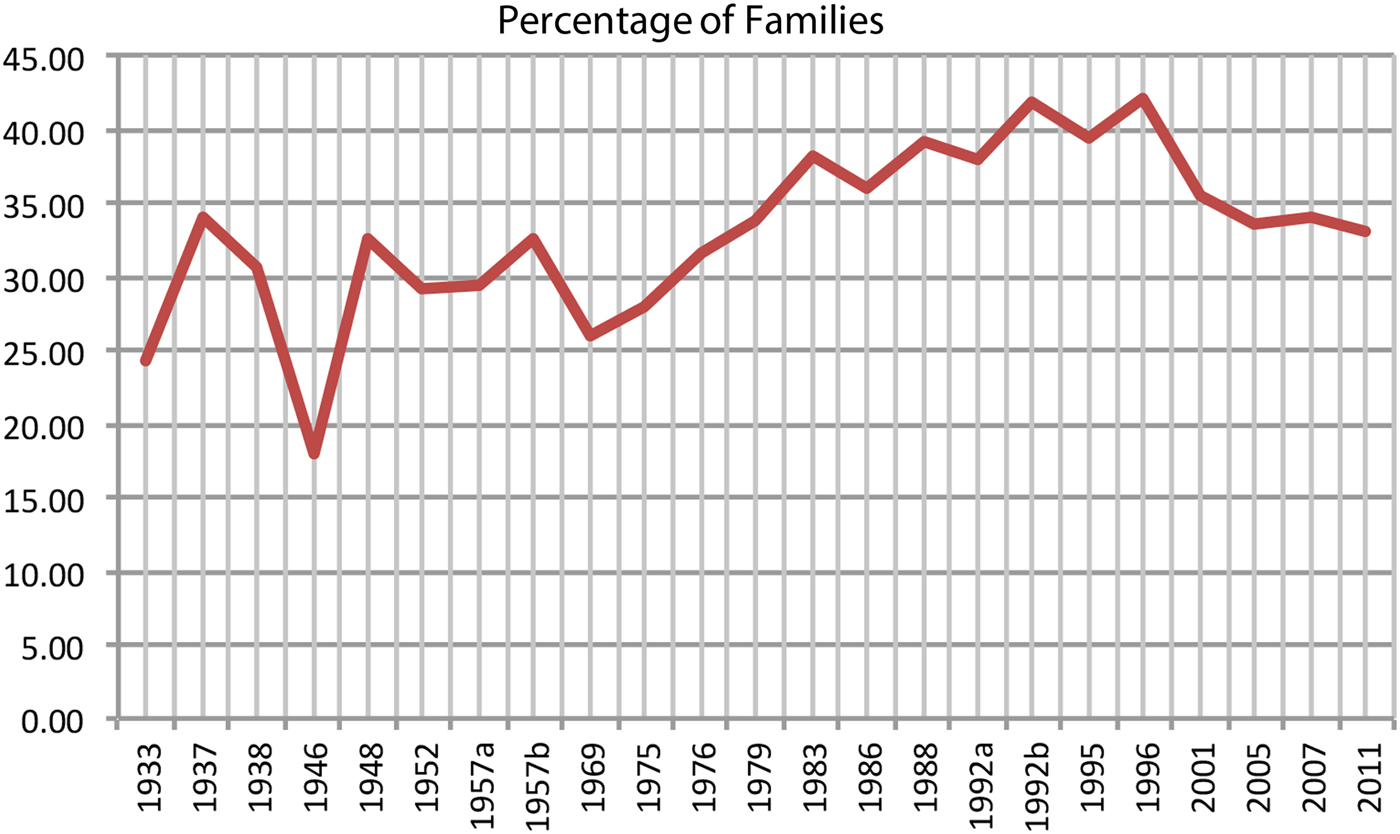
While there is no convincing evidence that modernisation has lessened the role of political families in the Thai parliament, at least at a statistically significant level, given the relationship found in parliaments in Western democracies, it is worth examining the ratio of political families in the Thai parliament over time. In Figure 6, we see the percentage of members who are from a political family in each of the parliaments since 1932. It is worth keeping in mind that the first member of a political family can only be identified retrospectively, after a second member is elected, so that we should expect that ratios in recent parliaments may tail off, because founding members of new families cannot yet be identified. Looking at the graph, that is indeed the pattern, although the ratio has been considerably lower for well over a decade now, enough time that the ratio of families in the Thai parliament likely has declined from its 1990s peak. While modernisation may be a partial explanation for this, the drop occurred at the same time as the 1997 financial crisis, a time when the Thai economy was not growing, but rather was in a temporary decline. Furthermore, the statistical analysis showed no relationship.
Percentage of political family members in the parliament.

In examining the patterns in the graph, it may be useful to consider peaks and valleys and their relationship to electoral structures in searching for an explanation. The highest peaks come in the 1980s and 1990s. Through this period, parliament was elected under a multi-member election district system, with between one and three MPs elected in each district. Under that system, family members contesting within the same election district could share campaign resources, including funding and organisation, and could coordinate their campaigns to maximise their influence. With relatively weak political parties at the time, that proved highly advantageous to family-style political organisation. In 2001, the election system was changed to single member election districts, so that families could no longer share campaign organisations and responsibilities, they had to contest each district separately. That undermined their previous advantages.
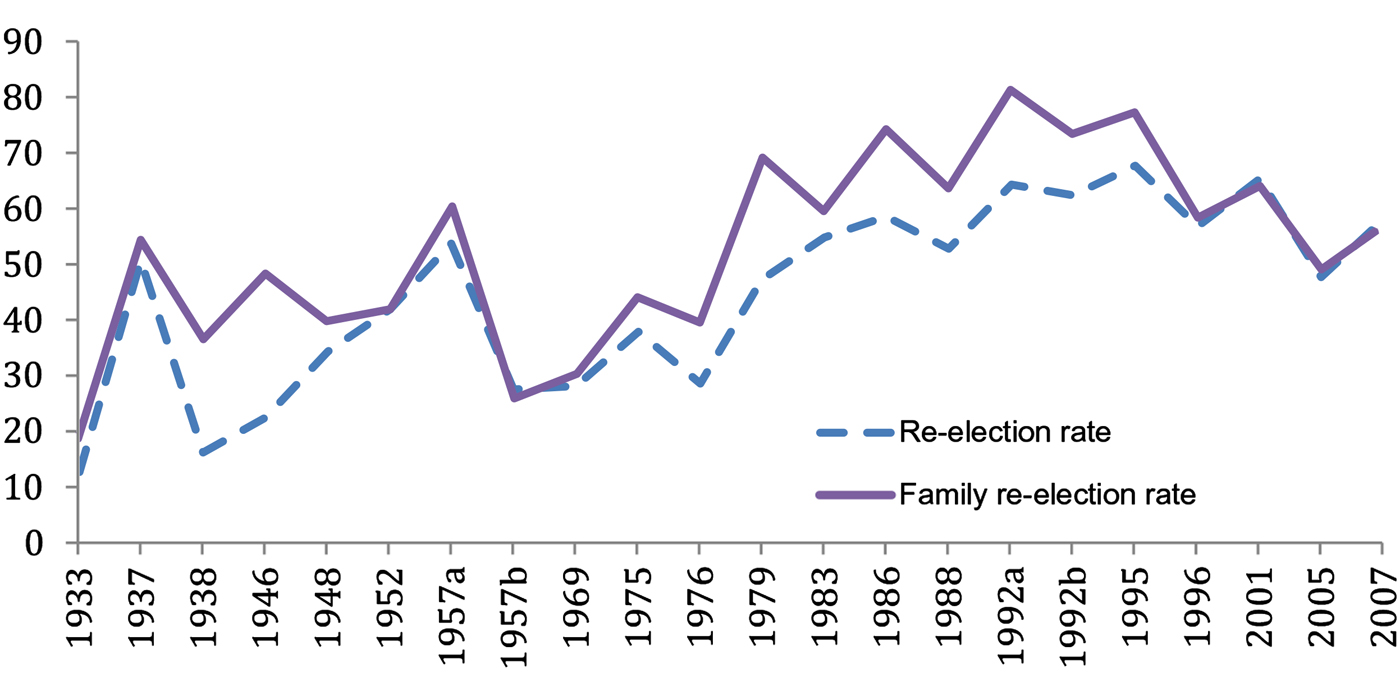
Alongside the change in the electoral system, attempts were made through both constitutional mechanisms and on the ground to reshape and strengthen political parties. A fund was established to support political parties and allocated in part according to the number of party members. A party list system and tighter restrictions on campaign expenditures also provided greater incentive for parties to campaign as parties. Consequently, the party system has stabilised, with two large parties and only a few small ones. Stronger political parties with more coordinated party campaigns have also undercut the importance of family style campaigning. We can see the impact of this change in Figure 7, which compares re-election rates of family members to those without family connections. We see that the success of political families has historically depended on a higher re-election rate. The decline in the ratio of political families has been the result of a decline in re-election rates to match those of parliament as a whole. Twice before families have lost this advantage in re-election rates, in 1957 and in 1969, both periods where political parties were relatively strong. One last change to the political system should be mentioned: the political reforms included devolution of responsibilities and financial resources to local political systems. Consequently, although our data here cannot capture it, many prominent political families increased their efforts to control local politics rather than national level politics.Footnote 8
Comparison of re-election rates for families and other MPs.

In assessing this decline in the ratio of political families, three further points should be made. First, the ratio of political families remains relatively high, despite the decline. Second, as we see in Figure 7, after the decline, the ratio of families stabilised at a lower level, yet still at a higher rate than at any point before the 1970s, and has not gone into continuous decline. Thus many families appear to have adapted to the new circumstances, as van Leifferinge and Steyvers posited. Indeed, the Shinawatra family has developed precisely through the mechanisms indicated by van Leifferinge and Steyvers (Reference van Liefferinge and Steyvers2009), by organising the first political party to make effective use of professional political campaigners, and by its effective use of branding and inside knowledge of media logic. Ownership of a large media empire enhanced these capabilities. Last, on two previous occasions, political families have declined, in 1946 and 1969, only to adapt and return more strongly than ever. Whether they can succeed again will depend on their resilience, and, perhaps more importantly, on their ability to maintain interest and capability with smaller families and fewer children.
Conclusions
Shifting the focus from the prominent families of the corrupt and criminal jaopho to consider political inheritance, or occupational following, more generally, as scholars have done for Western democracies, brings new insights to our understandings of political families in Thailand. Firstly, it is clear that by far the greater part of all political families in the Thai parliament are passing along a political inheritance rather than seeking to capture local politics. This helps provide some balance to the implications that family politics are necessarily corrupt. Certainly nepotism can be and has been associated with some family politics. But just as the child of a teacher may take an interest in education, so the child of a politician may take an interest in politics. This is not inherently nepotistic or corrupt. Secondly, as in the US, occupational following has been the most important path to participation in the parliament for women. With the support of a political family, women seem to be more willing to run and more likely to convince party officials to nominate them. Thirdly, through political inheritance, younger people have easier access to parliament, although they may or may not be able to convert their initial political capital into long political careers. Indeed, many seem to squander political capital. Although seniority plays only a limited role in Thai politics, election at a younger age may confer some advantage to members of political families in seeking cabinet positions over the longer term in some parties. In addition, election at a young age allows more time to build name recognition, contacts and loyalties that are helpful in bringing additional family members into the parliament, so that to some degree family politics of this style is self-perpetuating. Fourth, there is no clear relationship between the presence of political families and economic development, although further analysis using longitudinal data may provide more convincing results. Fifth, no relationship was found between political inheritance and political culture, either between Bangkok and the provinces or between different regions of Thailand. Last, it was observed that there appears to be a relationship between the success of political families in Thailand and political structures. In particular the nature of the election system and the strength of political parties can have a strong impact, with family based organisations effectively reinforcing weak party organisations, but losing effectiveness when parties are stronger.
Of course nothing presented here should be construed to mean that there is no problem of corruption in family politics in Thailand. There are corrupt families in Thai politics, as I noted above, in trying to distinguish the two. There are also many corrupt politicians who are not part of a political family. The argument is not that corruption is unimportant, but rather that we should not let it blind us to other important political phenomena, such as political inheritance. Nor should we assume that political families are so very different in Western and emerging democracies. By looking at political families in this different light, we discover that the impact of political inheritance goes beyond corruption and nepotism, and our studies need to account for the broader impact of political families. Furthermore, comparisons to Western democracies seem particularly apt as the Bush family has been able to dominate American politics in ways that combine political inheritance and other types of power. Perhaps there are similarities to the ways that the Shinawatra family has dominated Thai politics. Focusing on only one type of political family, the jaopho, no matter how powerful or disturbing they may be, can lead us to overlook the rise of new types of political families, and the new opportunities and advantages for those political families, advantages which may leave them as enduring as their predecessors.